As global markets experience shifts driven by easing trade concerns and mixed economic signals, investors are exploring diverse opportunities across various sectors. Penny stocks, a term that might seem outdated but still holds significance, often refer to smaller or newer companies with the potential for growth. For those willing to look beyond established names, these stocks can offer intriguing possibilities when backed by strong financial health and market positioning.
Top 10 Penny Stocks In Asia
| Name | Share Price | Market Cap | Rewards & Risks |
| Advice IT Infinite (SET:ADVICE) | THB4.84 | THB3B | ✅ 4 ⚠️ 3 View Analysis > |
| CNMC Goldmine Holdings (Catalist:5TP) | SGD0.41 | SGD166.17M | ✅ 4 ⚠️ 3 View Analysis > |
| YKGI (Catalist:YK9) | SGD0.10 | SGD42.5M | ✅ 2 ⚠️ 3 View Analysis > |
| Beng Kuang Marine (SGX:BEZ) | SGD0.189 | SGD37.65M | ✅ 4 ⚠️ 3 View Analysis > |
| Yangzijiang Shipbuilding (Holdings) (SGX:BS6) | SGD2.25 | SGD8.86B | ✅ 5 ⚠️ 0 View Analysis > |
| Ever Sunshine Services Group (SEHK:1995) | HK$1.93 | HK$3.34B | ✅ 5 ⚠️ 1 View Analysis > |
| Bosideng International Holdings (SEHK:3998) | HK$4.06 | HK$46.48B | ✅ 4 ⚠️ 1 View Analysis > |
| Lever Style (SEHK:1346) | HK$1.06 | HK$668.81M | ✅ 4 ⚠️ 2 View Analysis > |
| Goodbaby International Holdings (SEHK:1086) | HK$1.15 | HK$1.92B | ✅ 4 ⚠️ 2 View Analysis > |
| TK Group (Holdings) (SEHK:2283) | HK$1.95 | HK$1.62B | ✅ 4 ⚠️ 1 View Analysis > |
Click here to see the full list of 1,169 stocks from our Asian Penny Stocks screener.
Below we spotlight a couple of our favorites from our exclusive screener.
Simply Wall St Financial Health Rating: ★★★★★☆
Overview: Hong Kong Technology Venture Company Limited operates an e-commerce business in Hong Kong and has a market cap of HK$1.75 billion.
Operations: The company’s revenue is primarily derived from its Hong Kong Ecommerce Business, which generated HK$3.77 billion, supplemented by HK$201.39 million from New Ventures and Technology Business.
Market Cap: HK$1.75B
Hong Kong Technology Venture Company Limited, while unprofitable, maintains a strong cash position with a runway exceeding three years due to positive free cash flow growth. The company’s e-commerce segment remains resilient, evidenced by stable customer engagement and an increase in unique customers and active app users despite seasonal fluctuations. However, recent results show a drop in average order value and gross merchandise value due to promotional activities. The firm is debt-free with seasoned management and board members. Despite short-term liabilities exceeding assets, the company announced a special dividend of HK$0.38 per share for 2024.
Simply Wall St Financial Health Rating: ★★★★☆☆
Overview: Shandong Molong Petroleum Machinery Company Limited, along with its subsidiaries, designs, develops, produces, and sells products and services for the energy equipment industry both in China and internationally; it has a market cap of approximately HK$2.73 billion.
Operations: Shandong Molong Petroleum Machinery Company Limited has not reported any specific revenue segments.
Market Cap: HK$2.73B
Shandong Molong Petroleum Machinery Company Limited faces challenges as it remains unprofitable, with losses increasing by 9.2% annually over the past five years. Despite this, the company has a substantial cash runway exceeding three years, supported by positive free cash flow. Recent earnings showed a significant revenue increase to CN¥291.39 million for Q1 2025 from CN¥193.61 million the previous year, yet net income dropped sharply to CN¥5.42 million from CN¥216.91 million due to non-recurring financial adjustments and high debt levels with a net debt-to-equity ratio of 201.3%.
Simply Wall St Financial Health Rating: ★★★★★☆
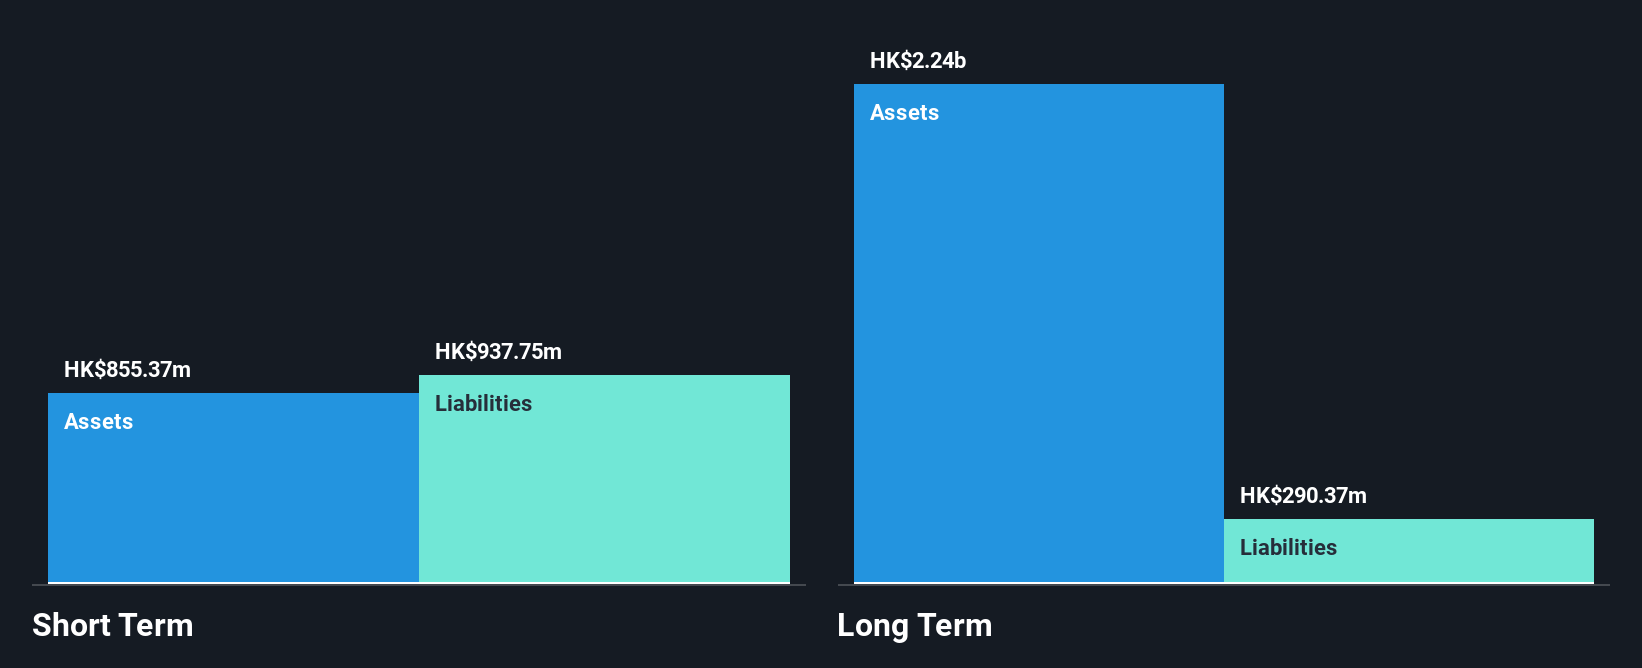
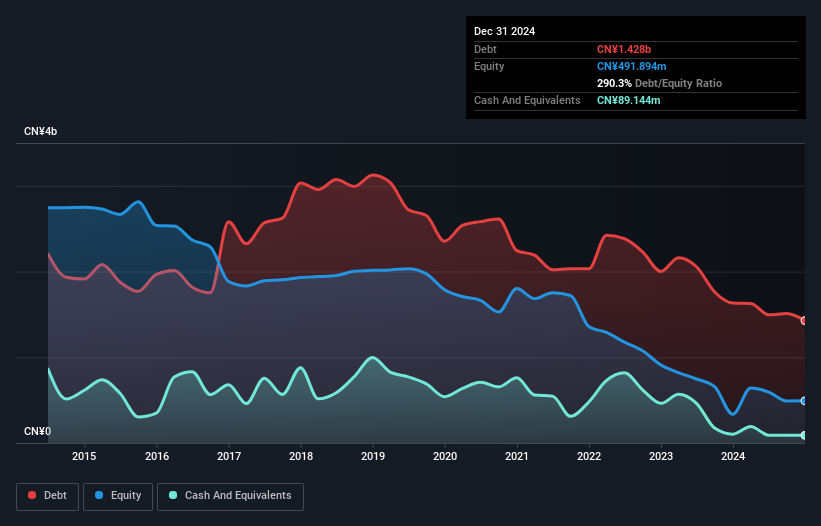
Overview: Shanghai Kinlita Chemical Co., Ltd. focuses on the research, production, sale, and service of industrial coatings in China with a market cap of CN¥2.01 billion.
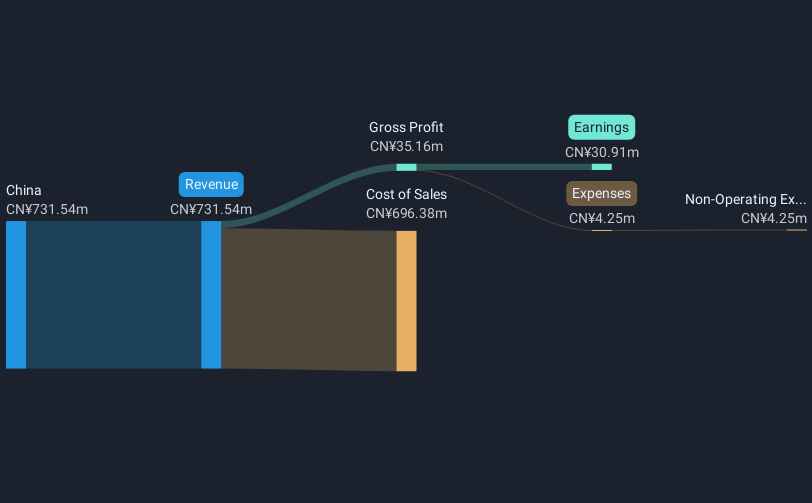
Operations: The company’s revenue is derived from its operations in China, totaling CN¥731.54 million.
Market Cap: CN¥2.01B
Shanghai Kinlita Chemical Co., Ltd. has shown a significant improvement in earnings, growing by 115.7% over the past year, which contrasts with its five-year average decline of 15.6% annually. The company’s net profit margin improved to 4.2%, up from 2% last year, and its debt is well covered by operating cash flow at 91.2%. Despite high volatility in share price and trading below estimated fair value, the company maintains a satisfactory net debt-to-equity ratio of 7.8%. Its management team and board are considered experienced with average tenures of over three years each.
Next Steps
This article by Simply Wall St is general in nature. We provide commentary based on historical data
and analyst forecasts only using an unbiased methodology and our articles are not intended to be financial advice. It does not constitute a recommendation to buy or sell any stock, and does not take account of your objectives, or your
financial situation. We aim to bring you long-term focused analysis driven by fundamental data.
Note that our analysis may not factor in the latest price-sensitive company announcements or qualitative material.
Simply Wall St has no position in any stocks mentioned.
New: Manage All Your Stock Portfolios in One Place
We’ve created the ultimate portfolio companion for stock investors, and it’s free.
• Connect an unlimited number of Portfolios and see your total in one currency
• Be alerted to new Warning Signs or Risks via email or mobile
• Track the Fair Value of your stocks
Have feedback on this article? Concerned about the content? Get in touch with us directly. Alternatively, email editorial-team@simplywallst.com