In this Stacked Pro breakdown:
Do Older Leasehold Condos Like Loyang Valley Still Have Room to Grow?
Comparison
We analysed how Loyang Valley, a 1985 leasehold project in Pasir Ris, performed from 2016 to 2024. This was benchmarked against both islandwide trends and newer nearby developments, most of which are freehold.
Key Insight
Despite its age and leasehold status, Loyang Valley outpaced many peers in both quantum and $PSF growth, even recording the highest annualised price growth among nearby projects with transactions in both years.
Why This Matters
With new launches getting smaller and pricier, older condos like Loyang Valley show that space, layout, and upcoming MRT access can outweigh age, and may still offer long-term upside.
🔓 Read the full data breakdown — only on Stacked Pro.
Already a subscriber? Log in here.
Loyang Valley is one of the older leasehold condos in Singapore today, dating back to 1985. It’s also come on the radar again recently, largely thanks to the new Cross Island Line (CRL): once Loyang MRT station is up and running in 2029, this once-inaccessible condo may yet be an undervalued gem. But do larger unit sizes, an upcoming train station, and lower price psf allow this older leasehold condo to stay in demand? Let’s take a closer look at the numbers:
A quick profile of Loyang Valley
Located along Loyang Avenue (District 17), Loyang Valley was built in 1985 (99-year lease starting in 1982), and has 362 units. The project has a land area of around 79,212 sqm, and is particularly identifiable for its red-brick facade. Loyang Valley is nestled in a green area, next to Kuala Loyang (a small forested area).
Looking at the performance of Loyang Valley compared to the overall market
Let’s look at how Loyang Valley has fared versus leasehold non-landed properties, island-wide. We’ll break this down based on unit sizes for a fairer comparison:
2-bedroom units
Average price
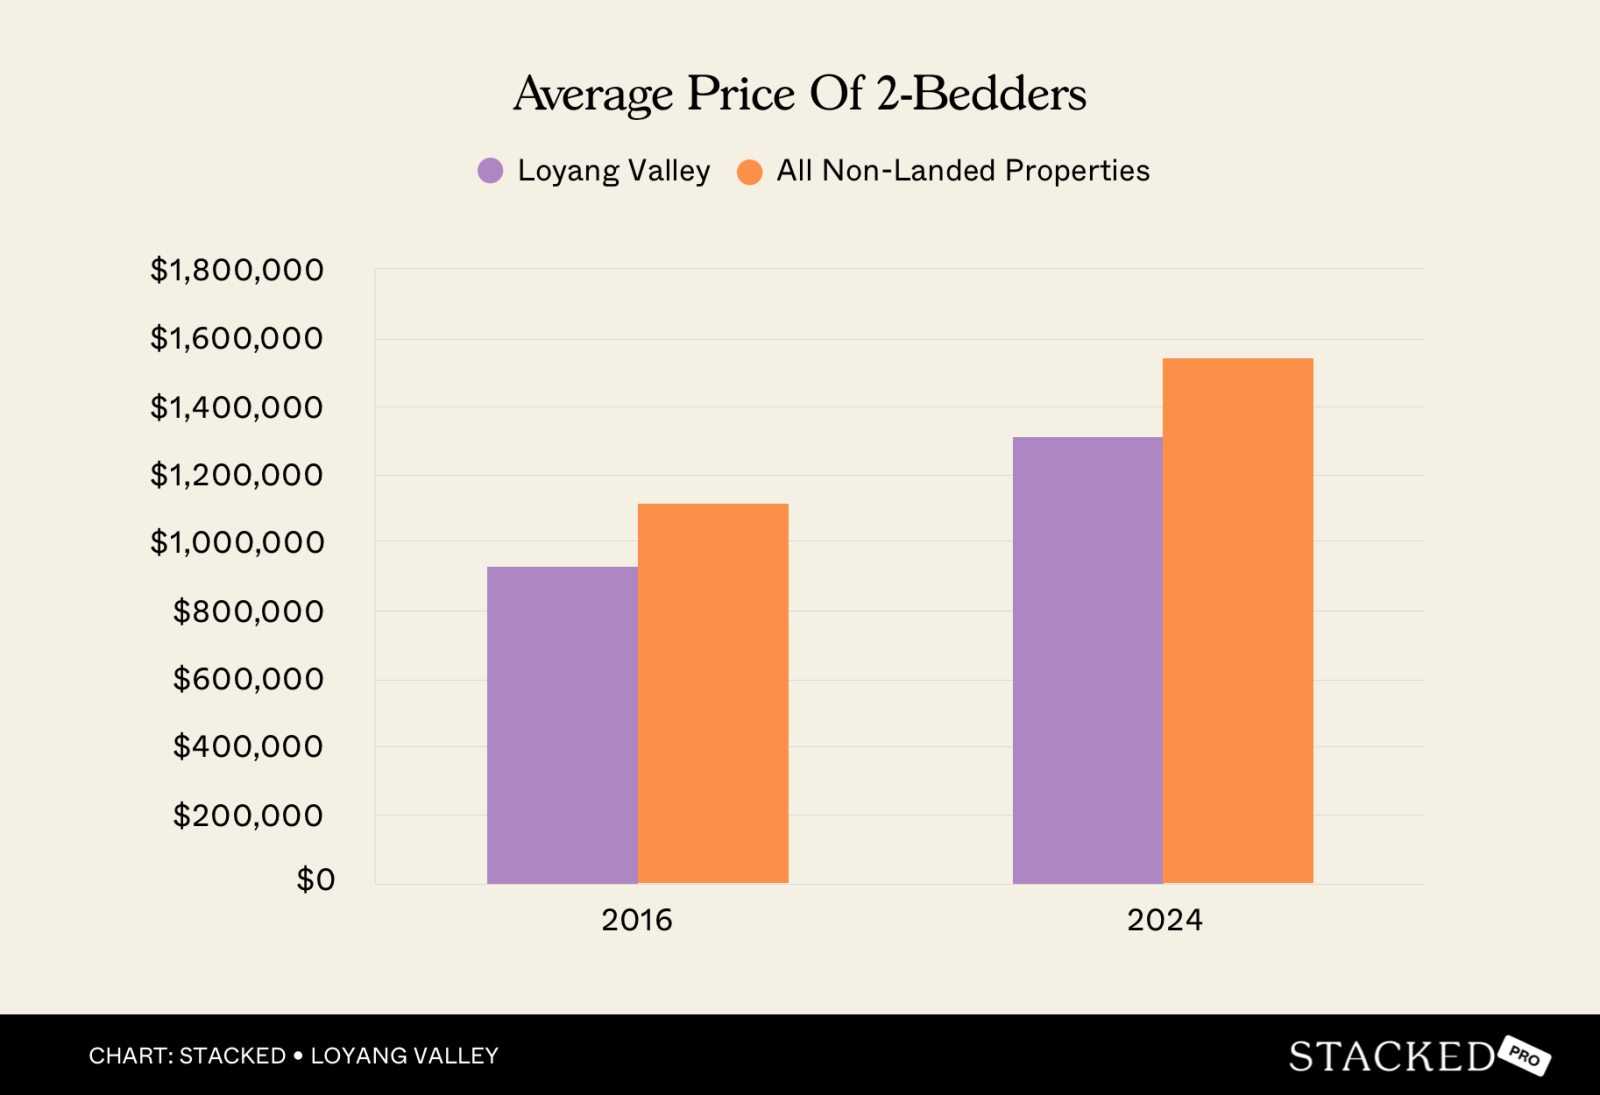
| Year | Loyang Valley | All non-landed properties | % difference |
|---|---|---|---|
| 2016 | $929,000 | $1,116,441 | -16.79% |
| 2024 | $1,310,000 | $1,541,044 | -14.99% |
Average size
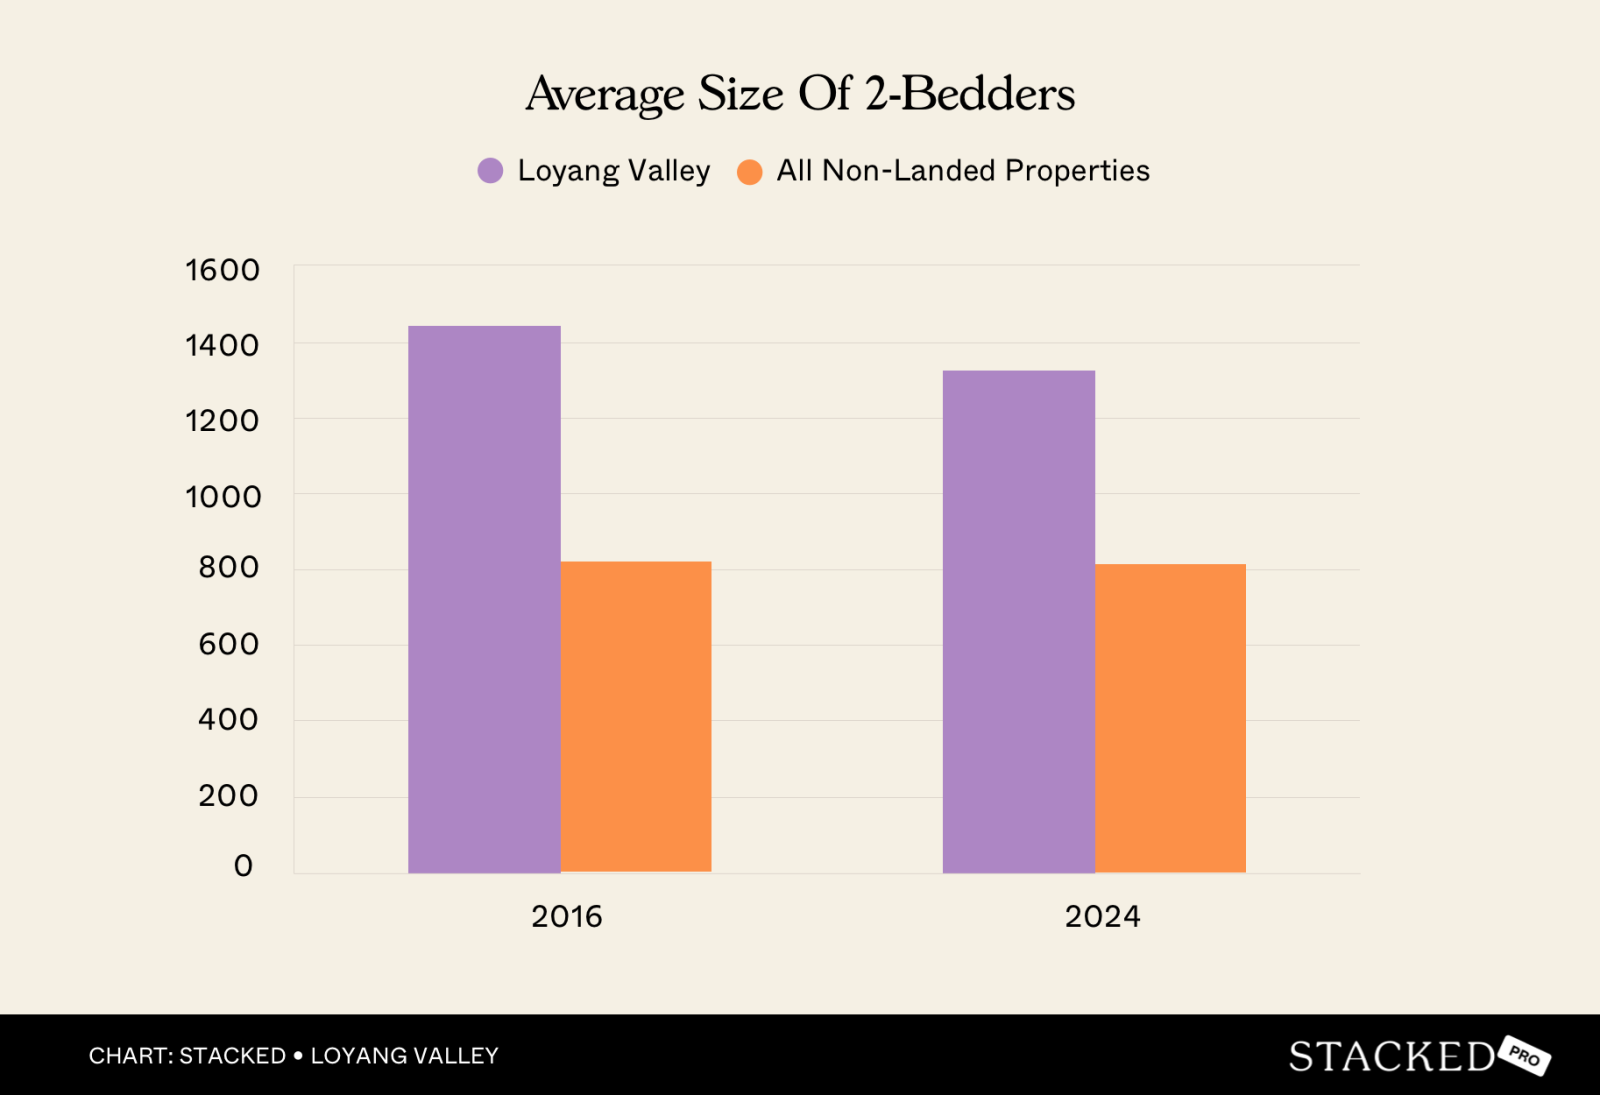
| Year | Loyang Valley | All non-landed properties | % difference |
| 2016 | 1,444 | 823 | 75.37% |
| 2024 | 1,328 | 816 | 62.62% |
3-bedroom units
Average price
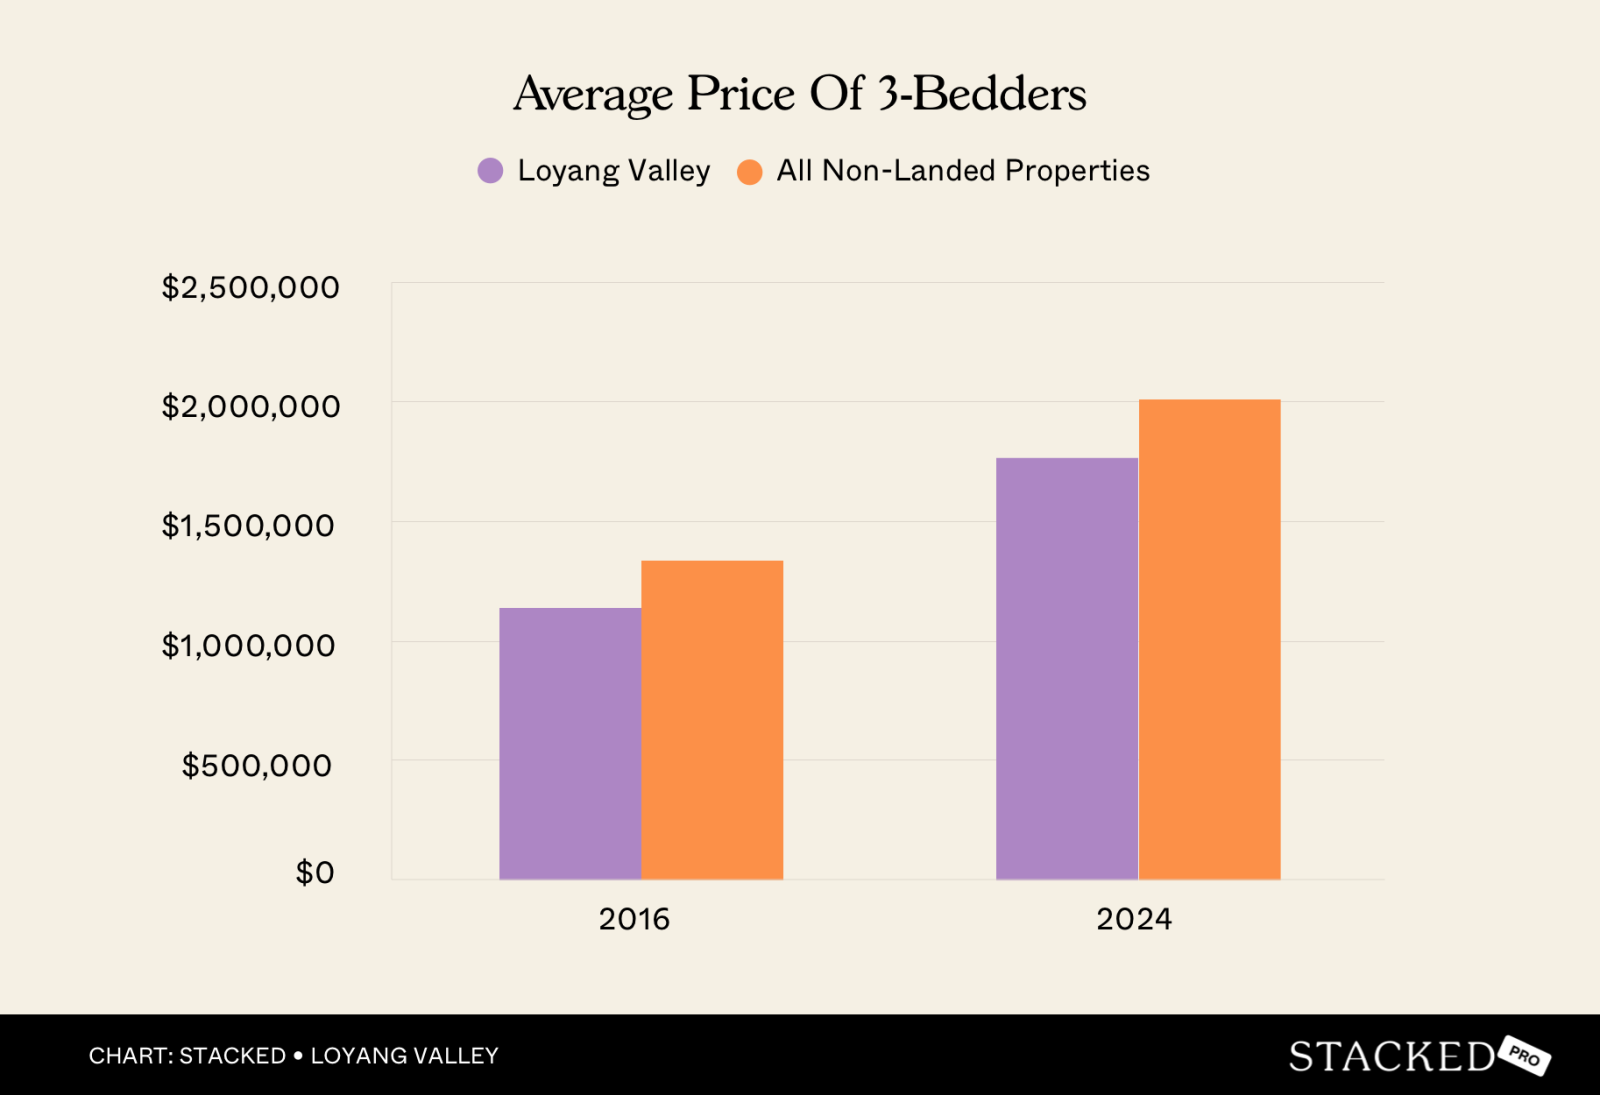
| Year | Loyang Valley | All non-landed properties | % difference |
| 2016 | $1,133,000 | $1,334,758 | -15.12% |
| 2024 | $1,762,667 | $2,012,081 | -12.40% |
Average size
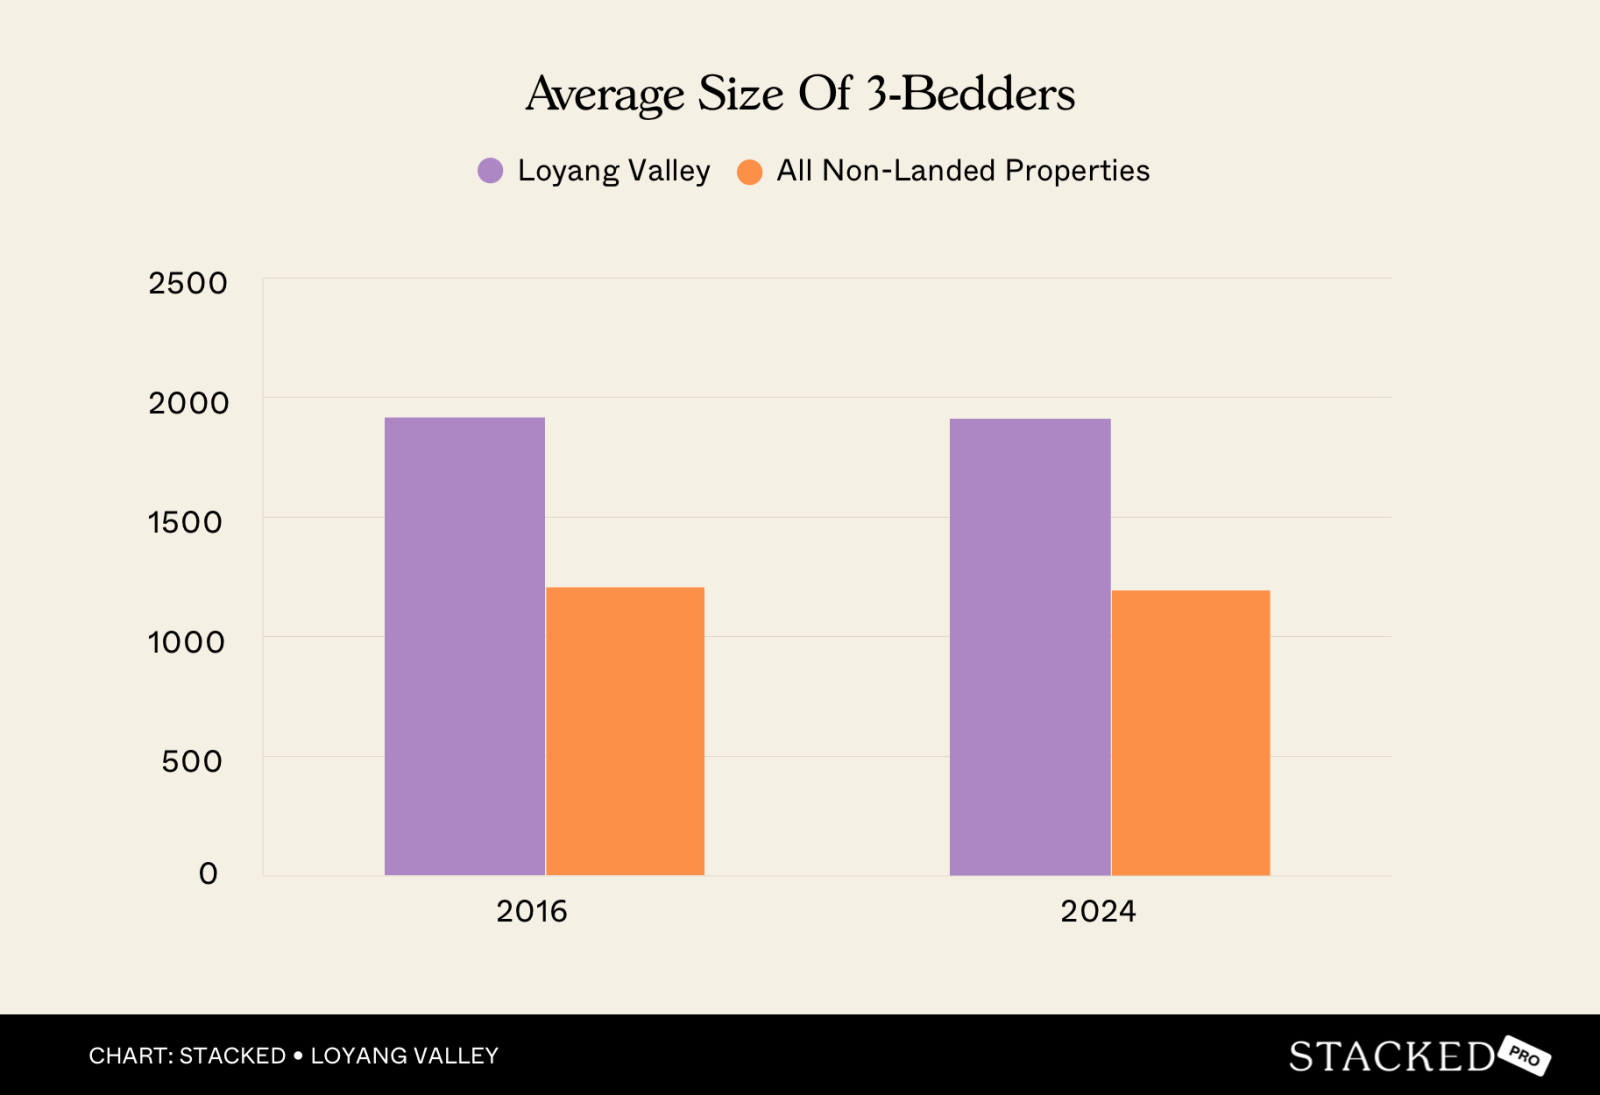
| Year | Loyang Valley | All non-landed properties | % difference |
| 2016 | 1,914 | 1,209 | 58.32% |
| 2024 | 1,912 | 1,196 | 59.93% |
From 2016 to 2024, the average price gap between Loyang Valley and all non-landed, leasehold private properties narrowed by approximately 2.26 per cent, across both two and three-bedroom units. This means prices at Loyang Valley have risen slightly faster than the national average. Even though they’re still cheaper, they’re catching up, and this is happening despite the age difference.
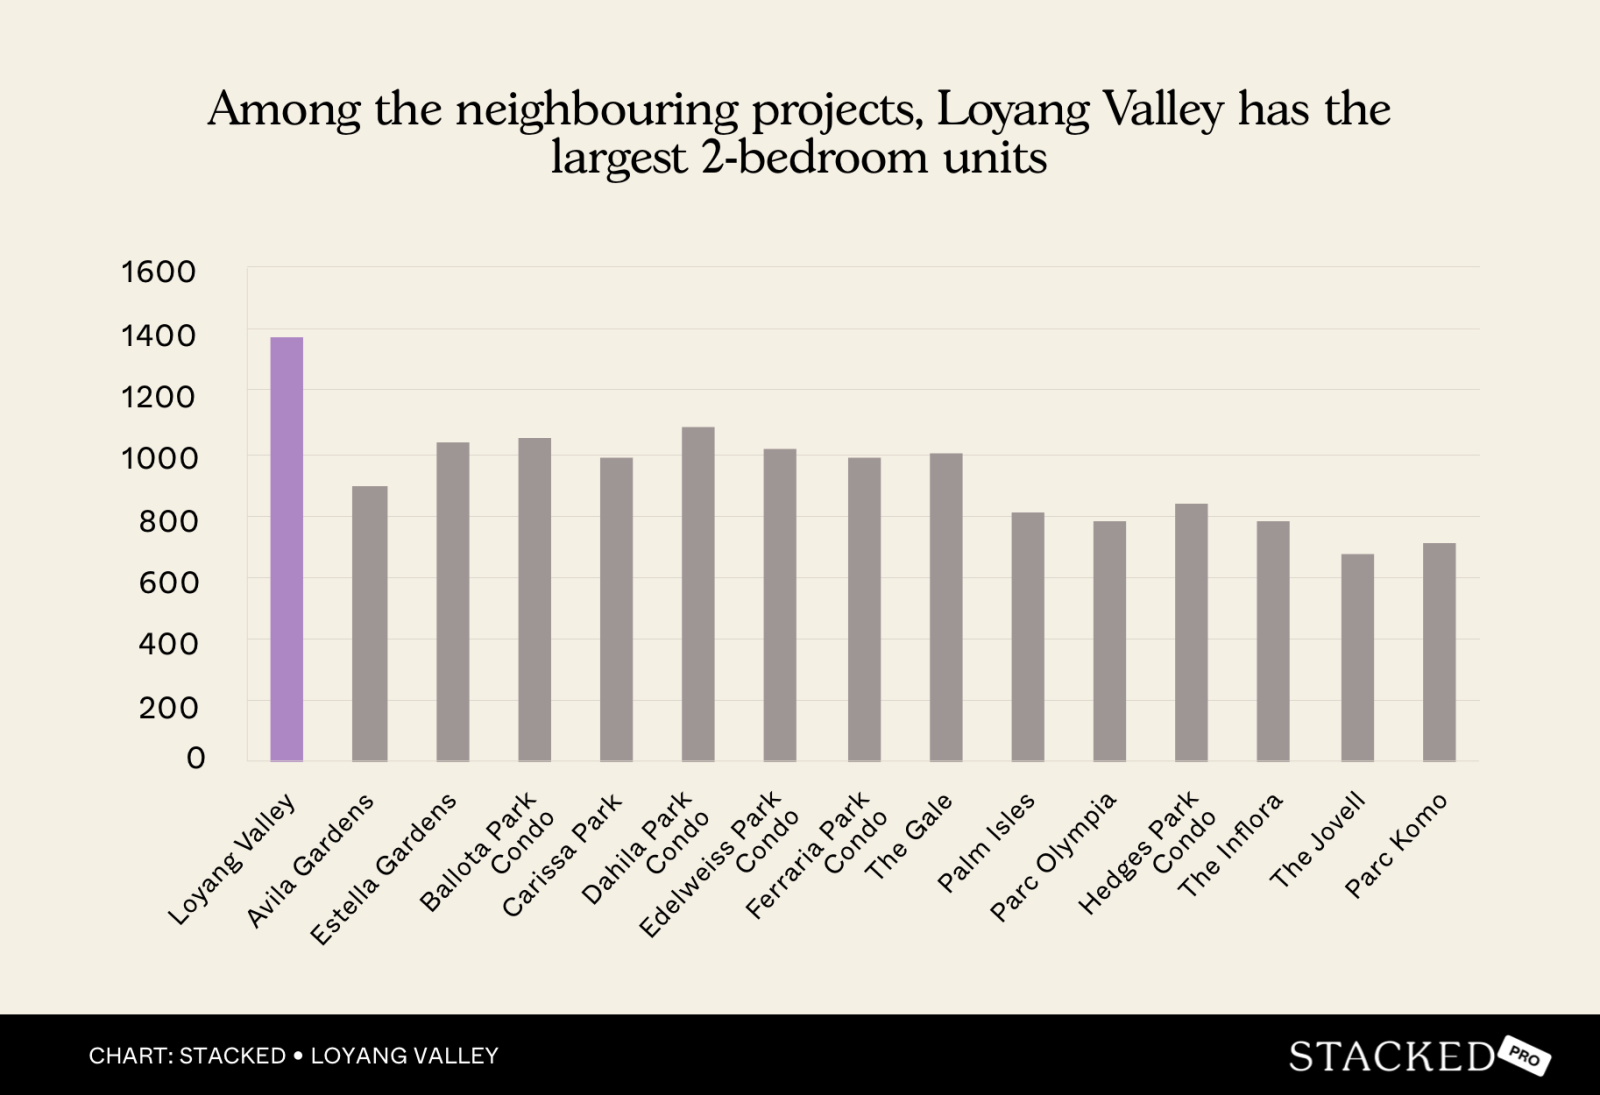
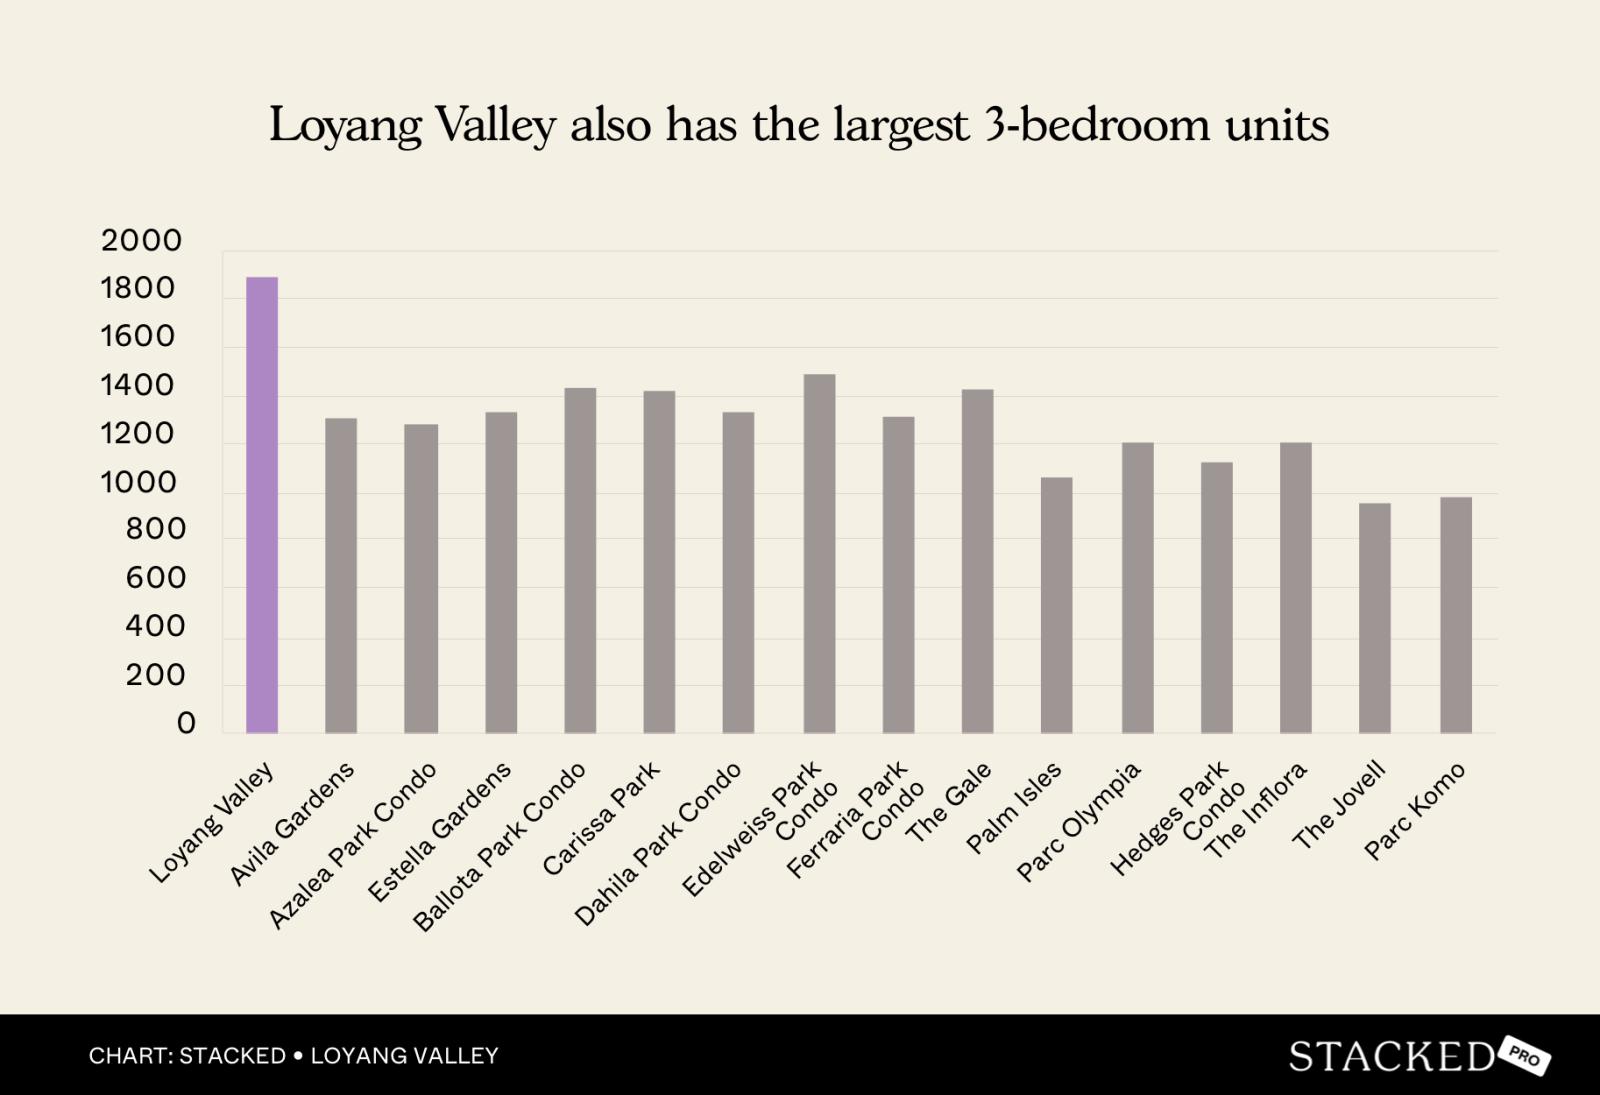
The unit sizes might give us a hint as to what’s going on. Loyang Valley’s units remain substantially larger than the national average, with sizes that are around 60 to 75 per cent larger for two and three-bedders. Bear in mind that by 2025 standards, units of 1,300 sq ft or larger are often four-bedders.
Despite its current inaccessibility, the combination of larger units and an upcoming MRT station may be driving demand for this older project.
Next, let’s compare Loyang Valley to its nearest counterparts
Looking at the completion years of nearby condos, there has been a steady stream of new projects launched over the decades, and notably, the majority are freehold:
| Project | Loyang Valley | Avila Gardens | Azalea Park Condominium | Estella Gardens | Ballota Park Condominium | Carissa Park | Dahila Park Condominium | Edelweiss Park Condominium | Ferraria Park Condominium | The Gale | Palm Isles | Parc Olympia | Hedges Park Condominium | The Inflora | The Jovell | Parc Komo |
| Completion | 1985 | 1995 | 1996 | 1999 | 2000 | 2001 | 2003 | 2006 | 2009 | 2013 | 2015 | 2015 | 2015 | 2016 | 2022 | 2023 |
| Number of units | 362 | 347 | 316 | 350 | 365 | 528 | 299 | 517 | 472 | 329 | 429 | 486 | 501 | 396 | 428 | 276 |
| Tenure | 99-years | Freehold | 999-years | Freehold | Freehold | Freehold | Freehold | Freehold | Freehold | Freehold | 99-years | 99-years | 99-years | 99-years | 99-years | Freehold |
Note that usually, being a leasehold condo amid freehold or 999-year condos would be a disadvantage, just by way of contrast. But let’s look at the transaction numbers:
Now let’s take a look at some price comparisons, based on two and three-bedders

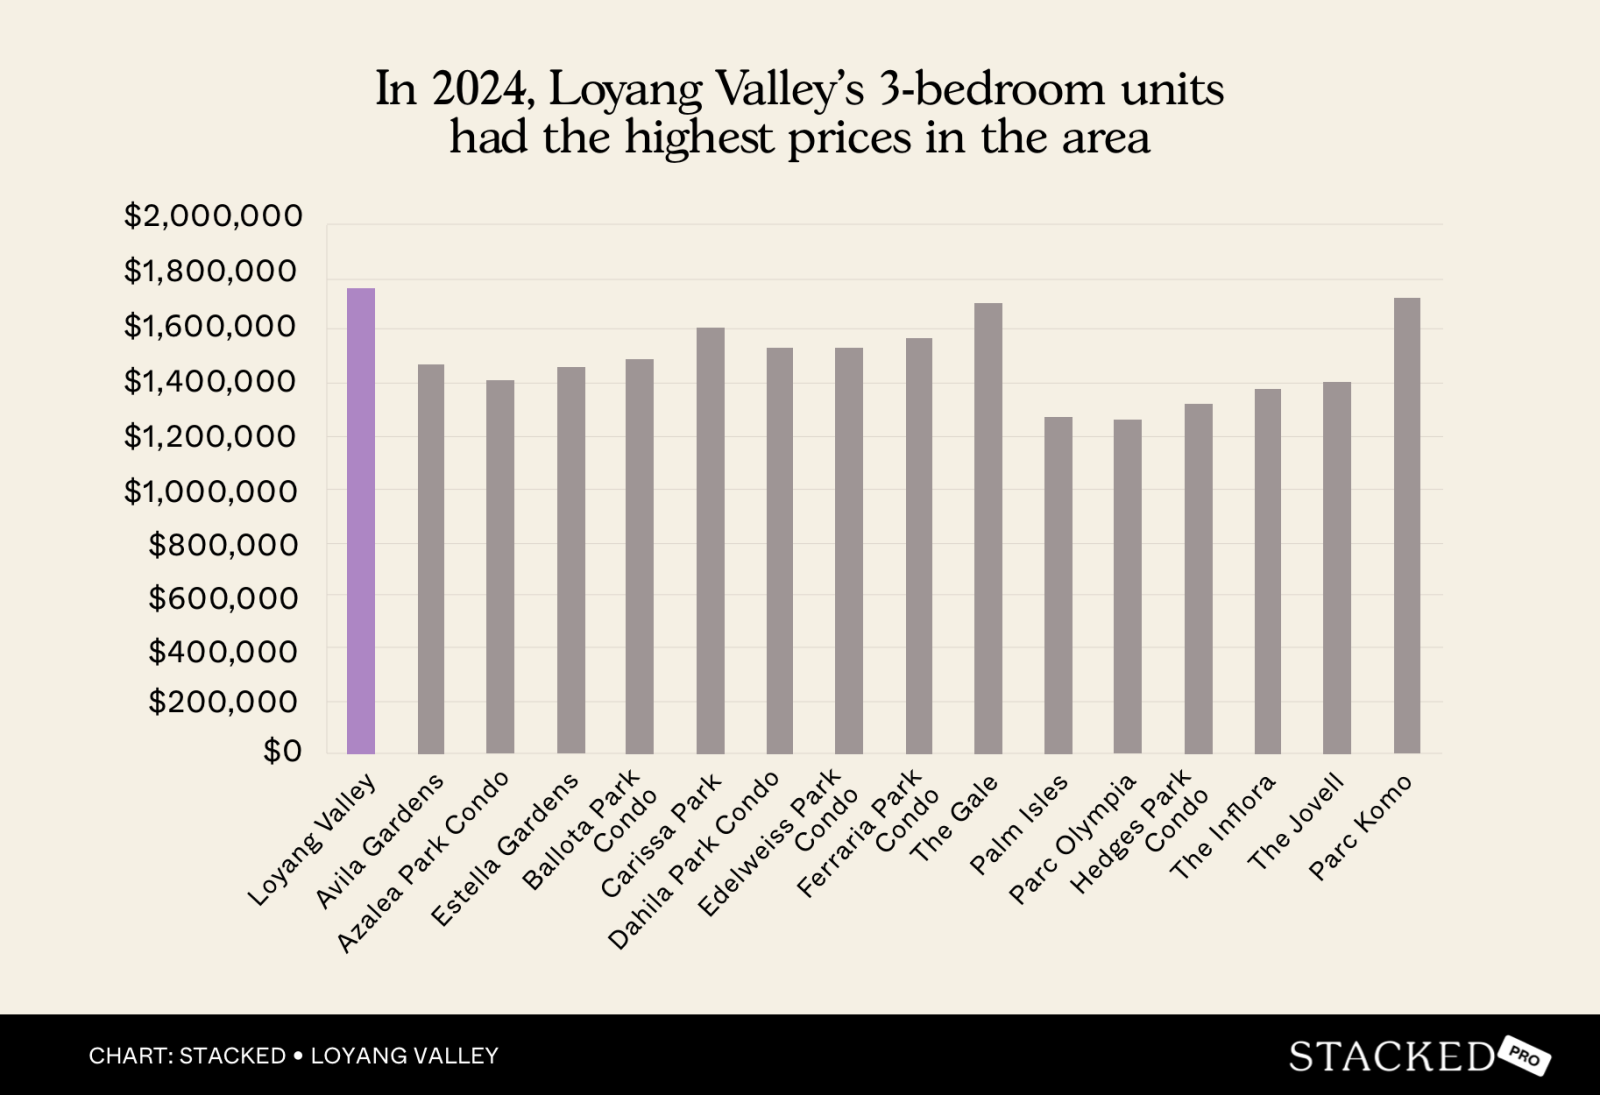
Loyang Valley’s average two and three-bedder prices (by quantum) are actually higher than many of its younger freehold counterparts. From the table above, we can see it outpaces Azalea Park (1996, 999-year), Ballota Park (2000, freehold), and even Edelweiss Park (2006, freehold) in terms of total average transacted prices.
From 2016 to 2024, the price gap between Loyang Valley and surrounding projects also widened: the gap for two-bedders increased from -13.25 per cent to -16.69 per cent, while the three-bedder gap increased from -8.65 per cent to -16.1 per cent.
This suggests that Loyang Valley appreciated faster than many nearby freehold condos, particularly in terms of overall price. This is especially impressive, given that Loyang Valley is nearly 40 years old and suffering lease decay.
One possible reason besides size: Loyang Valley is the only development among these projects that will be within walking distance of Loyang MRT station. This upcoming infrastructure boost has drawn more recent attention to it, and benefits it more than further-located freehold alternatives.
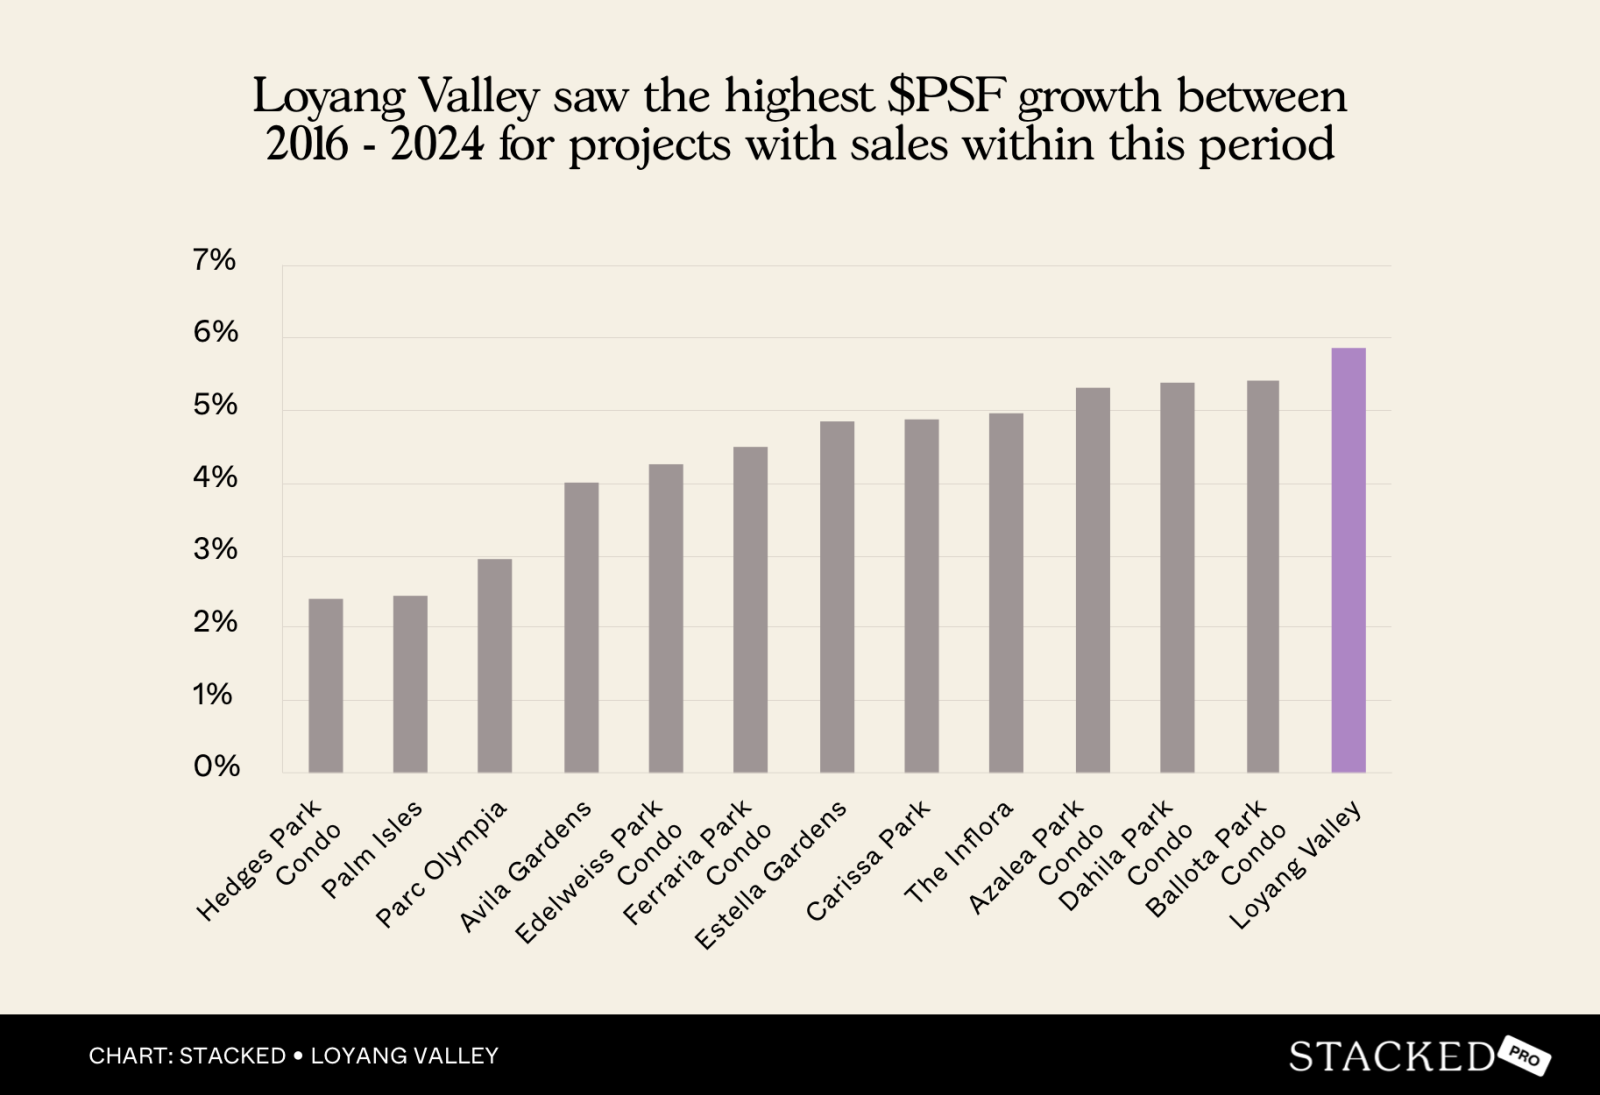
We can see the same level of performance when looking at the price psf:
| Loyang Valley | Avila Gardens | Azalea Park Condominium | Estella Gardens | Ballota Park Condominium | Carissa Park | Dahila Park Condominium | Edelweiss Park Condominium | Ferraria Park Condominium | The Gale | Palm Isles | Parc Olympia | Hedges Park Condominium | The Inflora | The Jovell | Parc Komo | |
| 2016 | $604 | $816 | $731 | $795 | $674 | $792 | $758 | $768 | $857 | $1,011 | $926 | $1,034 | $891 | |||
| 2017 | $618 | $792 | $733 | $796 | $686 | $774 | $750 | $736 | $829 | $884 | $1,003 | $935 | $936 | $1,062 | ||
| 2018 | $692 | $813 | $864 | $853 | $750 | $818 | $807 | $817 | $907 | $953 | $975 | $936 | $925 | $1,058 | $1,287 | |
| 2019 | $717 | $884 | $910 | $893 | $770 | $879 | $819 | $841 | $917 | $965 | $939 | $911 | $981 | $1,097 | $1,290 | $1,512 |
| 2020 | $739 | $847 | $834 | $868 | $768 | $863 | $787 | $793 | $907 | $960 | $944 | $922 | $932 | $1,051 | $1,264 | $1,497 |
| 2021 | $771 | $943 | $894 | $903 | $808 | $910 | $853 | $888 | $974 | $1,007 | $980 | $963 | $1,001 | $1,037 | $1,336 | $1,570 |
| 2022 | $914 | $1,018 | $1,021 | $1,033 | $904 | $1,040 | $975 | $996 | $1,090 | $1,093 | $1,070 | $1,065 | $1,085 | $1,182 | $1,474 | $1,650 |
| 2023 | $929 | $1,265 | $1,062 | $1,119 | $1,007 | $1,058 | $1,063 | $1,087 | $1,165 | $1,225 | $1,207 | $1,181 | $1,209 | $1,295 | $1,543 | $1,816 |
| 2024 | $954 | $1,118 | $1,106 | $1,161 | $1,028 | $1,158 | $1,153 | $1,072 | $1,219 | $1,234 | $1,226 | $1,168 | $1,250 | $1,312 | $1,535 | $1,754 |
| Annualised | 5.86% | 4.01% | 5.30% | 4.85% | 5.41% | 4.87% | 5.38% | 4.26% | 4.50% | 2.44% | 2.95% | 2.40% | 4.95% |
Note: Some projects like The Gale, The Jovell, and Parc Komo are excluded due to incomplete early-year data.
Loyang Valley’s PSF appreciation rate is the highest in the area, even beating many younger and freehold developments. This shows that it didn’t just appreciate due to large sizes (quantum) but also grew strongly on a PSF basis, defying the common concern of lease decay.
We can see the effect of unit sizes and the upcoming MRT station, so now let’s do a quick floor plan comparison
We’ll start with the two-bedders, using Avila Gardens and Palm Isles. These are the closest points of comparison in size, but note that they are still respectively around 22 and 29 per cent cheaper than Loyang Valley:
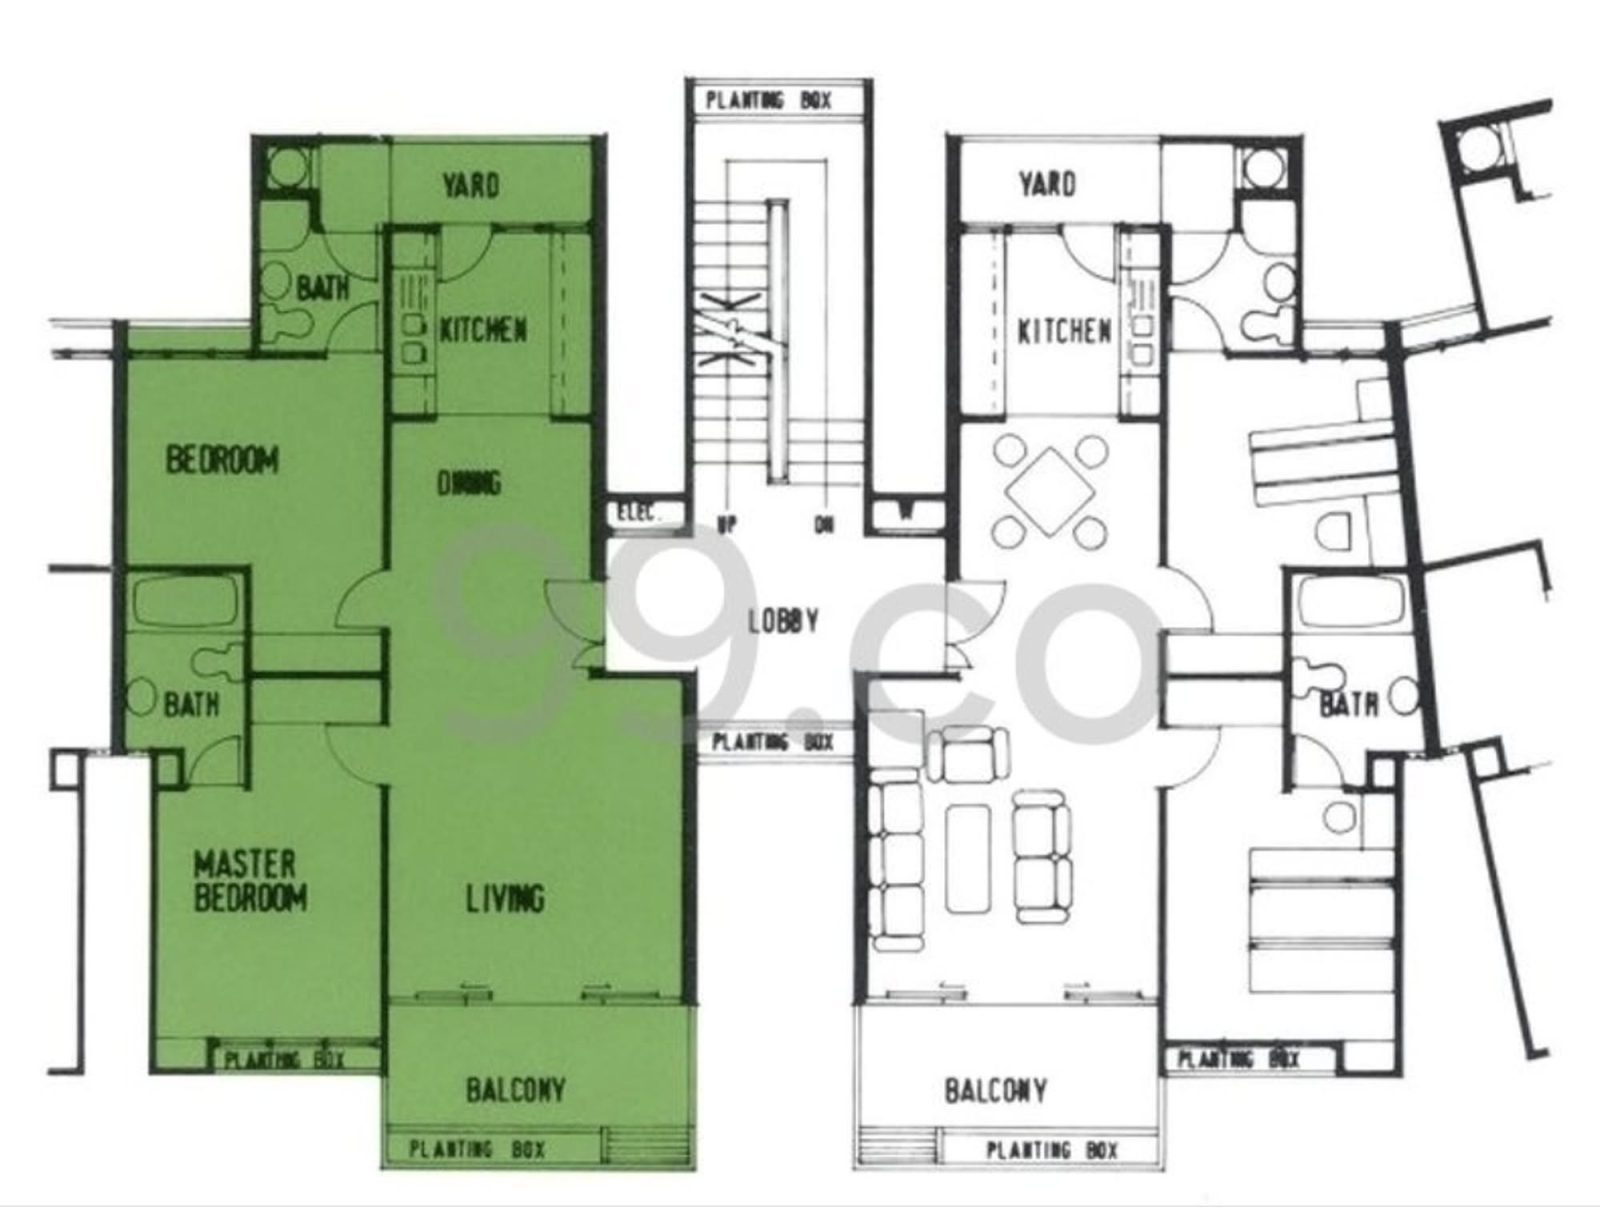
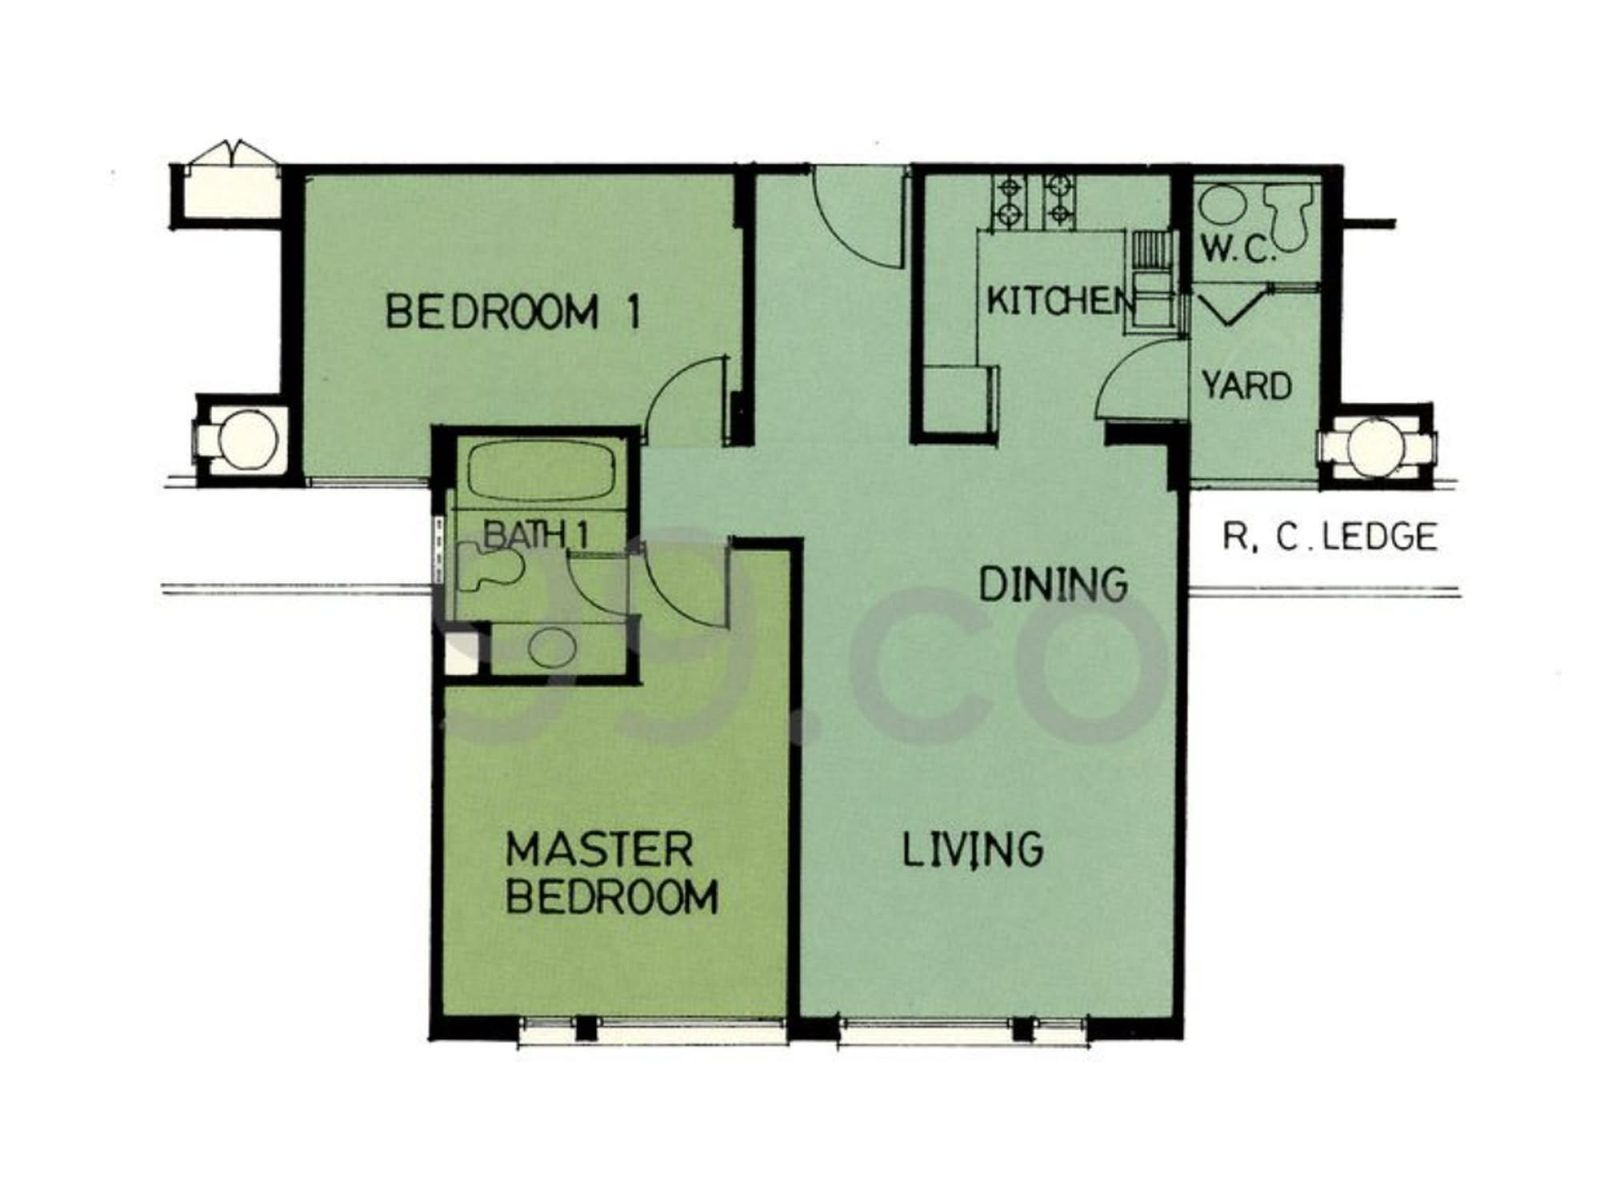
Both Loyang Valley and Palm Isles offer two-bed, two-bath configurations with balconies, while Avila Gardens has a smaller two-bed, one-bath layout without a balcony (which may be seen as a space-saving benefit by some).
An interesting element of Loyang Valley’s units is that they’re as efficient as today’s dumbbell layouts, despite being 40 years old. Notice that Loyang Valley’s layout doesn’t use hallways, which is highly efficient; and it has an enclosable kitchen with a well-positioned service yard (Avila Gardens has this element too, but it’s much smaller.)
As a clever convenience, the Jack-and-Jill common bathroom can be directly accessed from the yard: this can be very convenient, such as when you’re moving wet towels, clothes, etc. from the bathroom straight out to the yard.
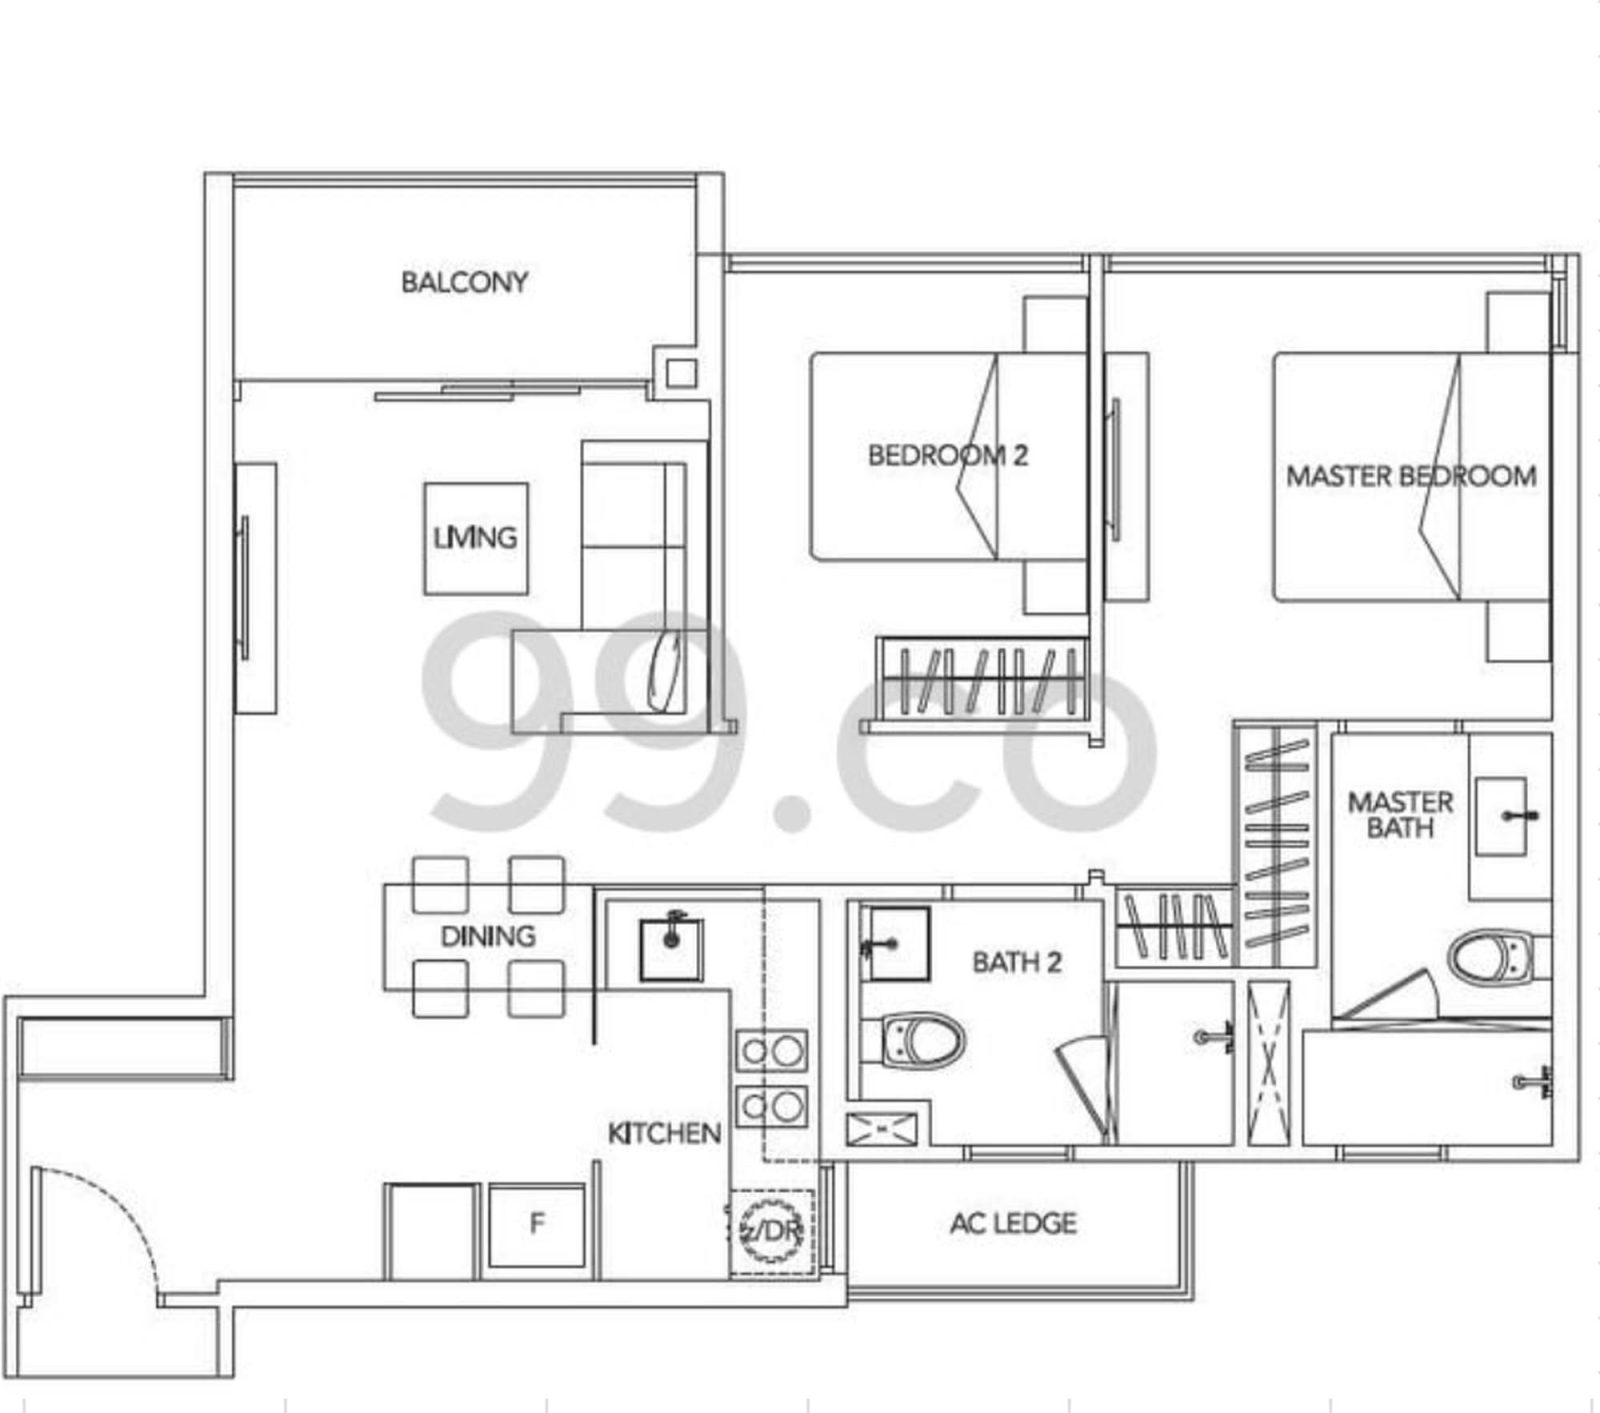
Now let’s look at the three-bedder units
For the three-bedders we will look at Azalea Park and Parc Olympia, which are the closest points of comparison, but about 19.75 and 28.52 per cent cheaper than Loyang Valley.
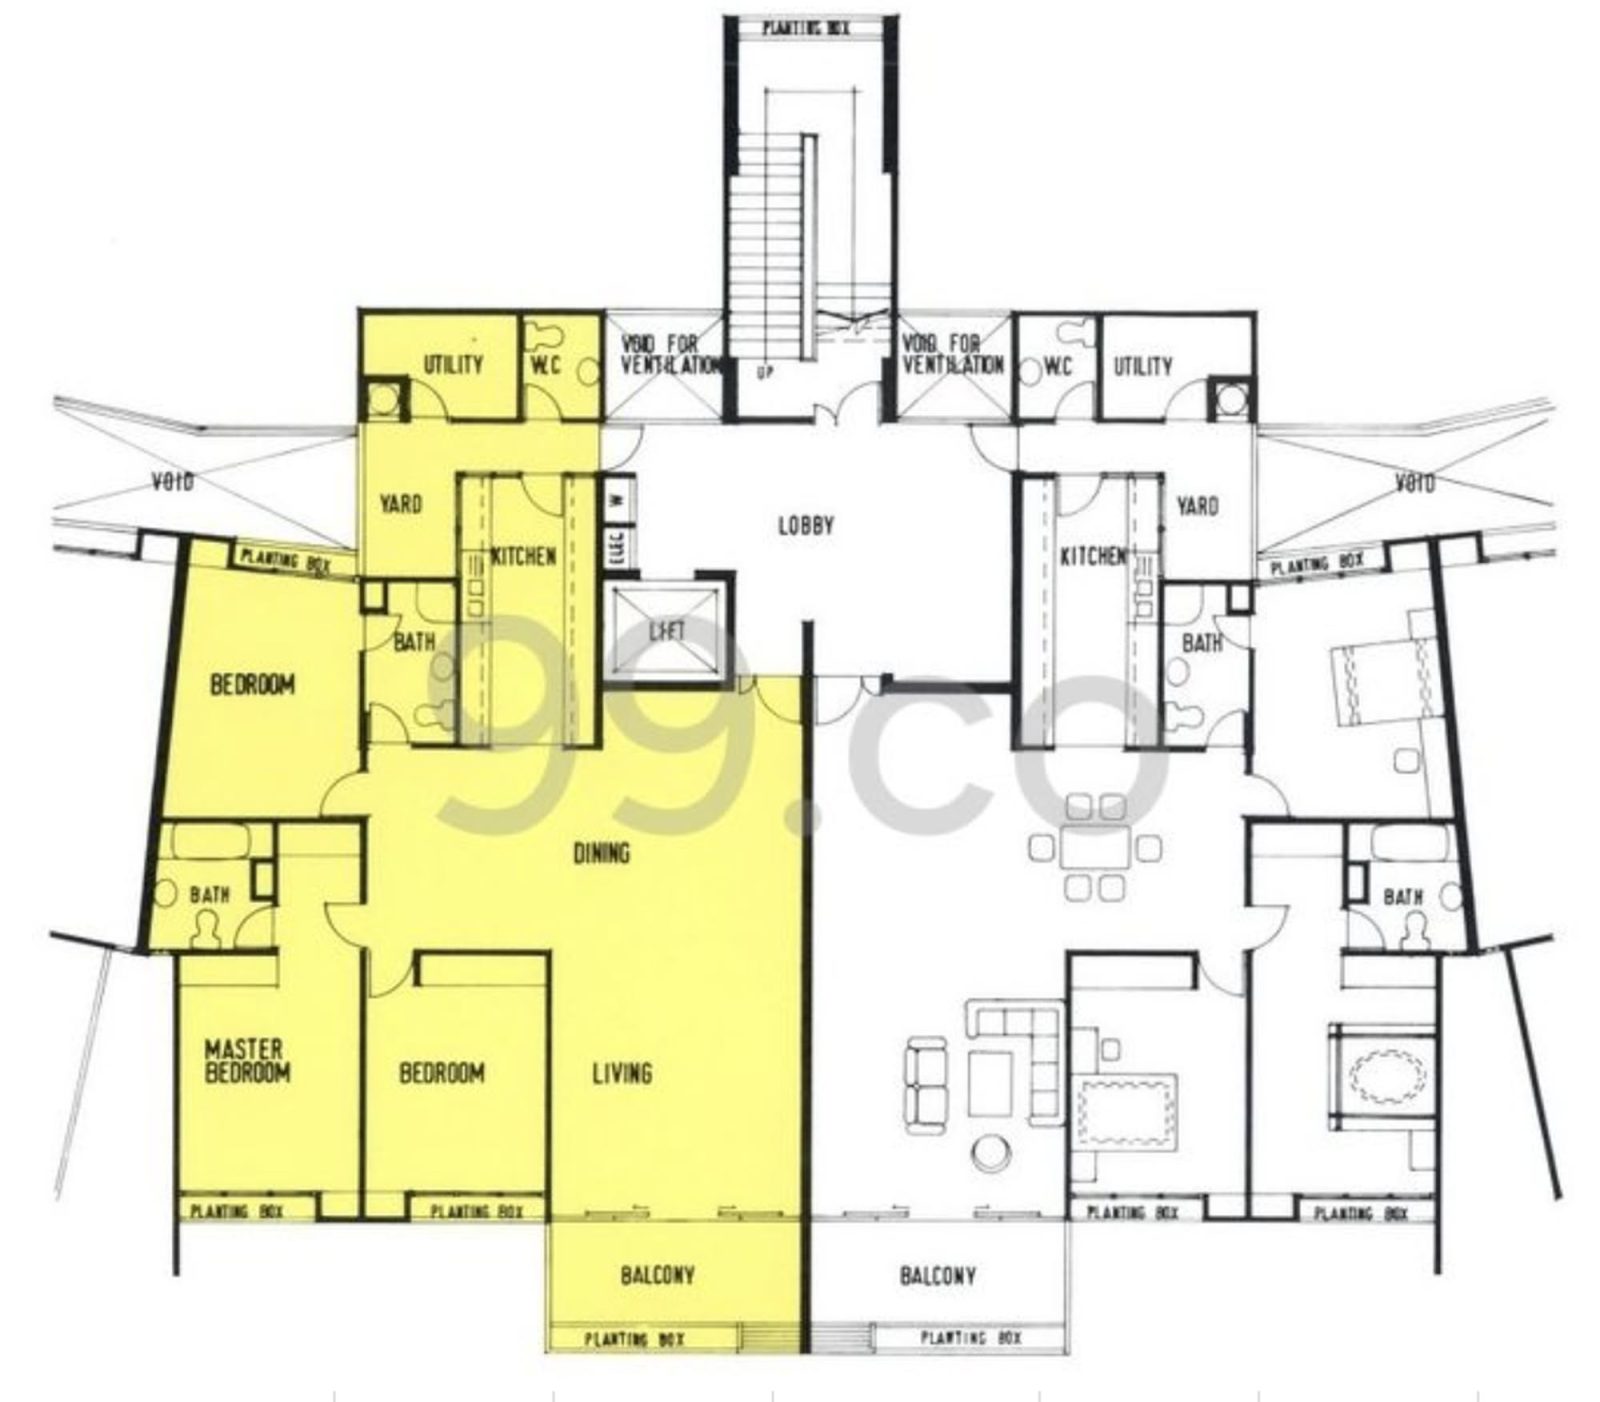
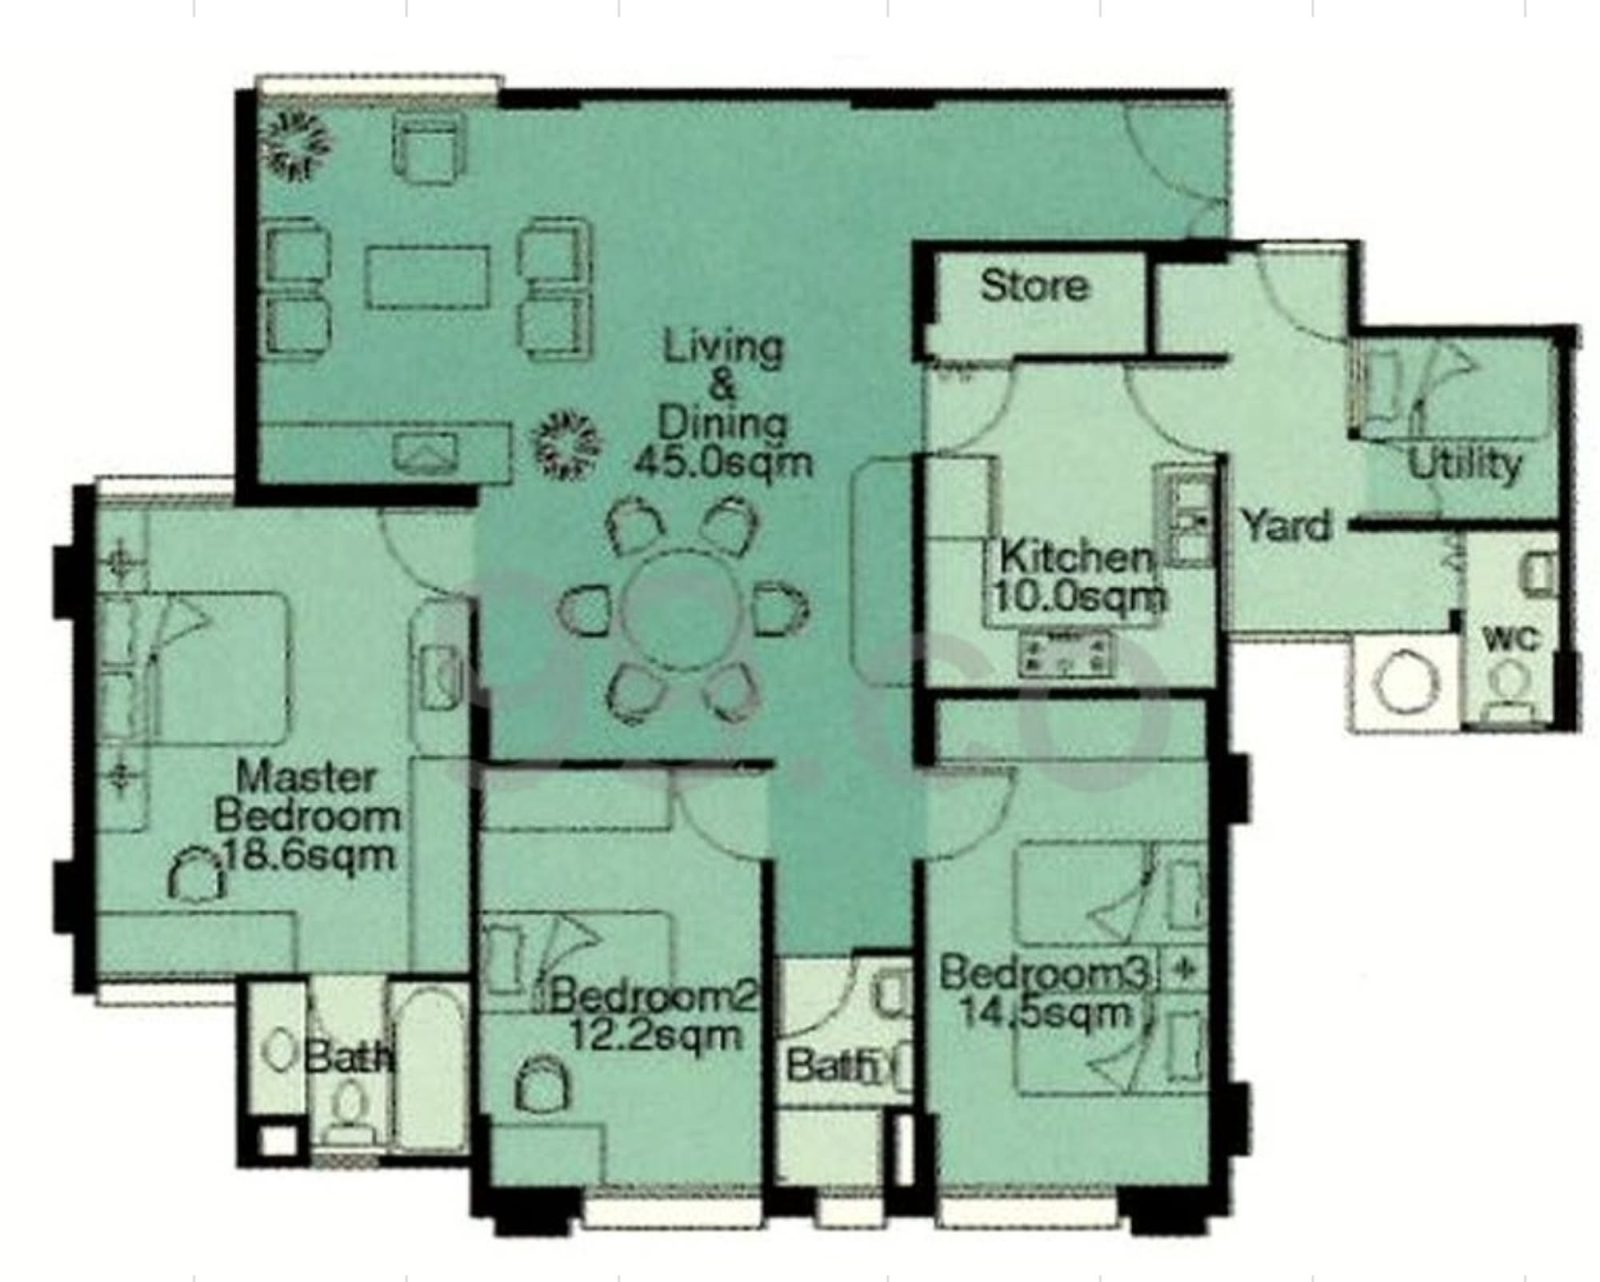
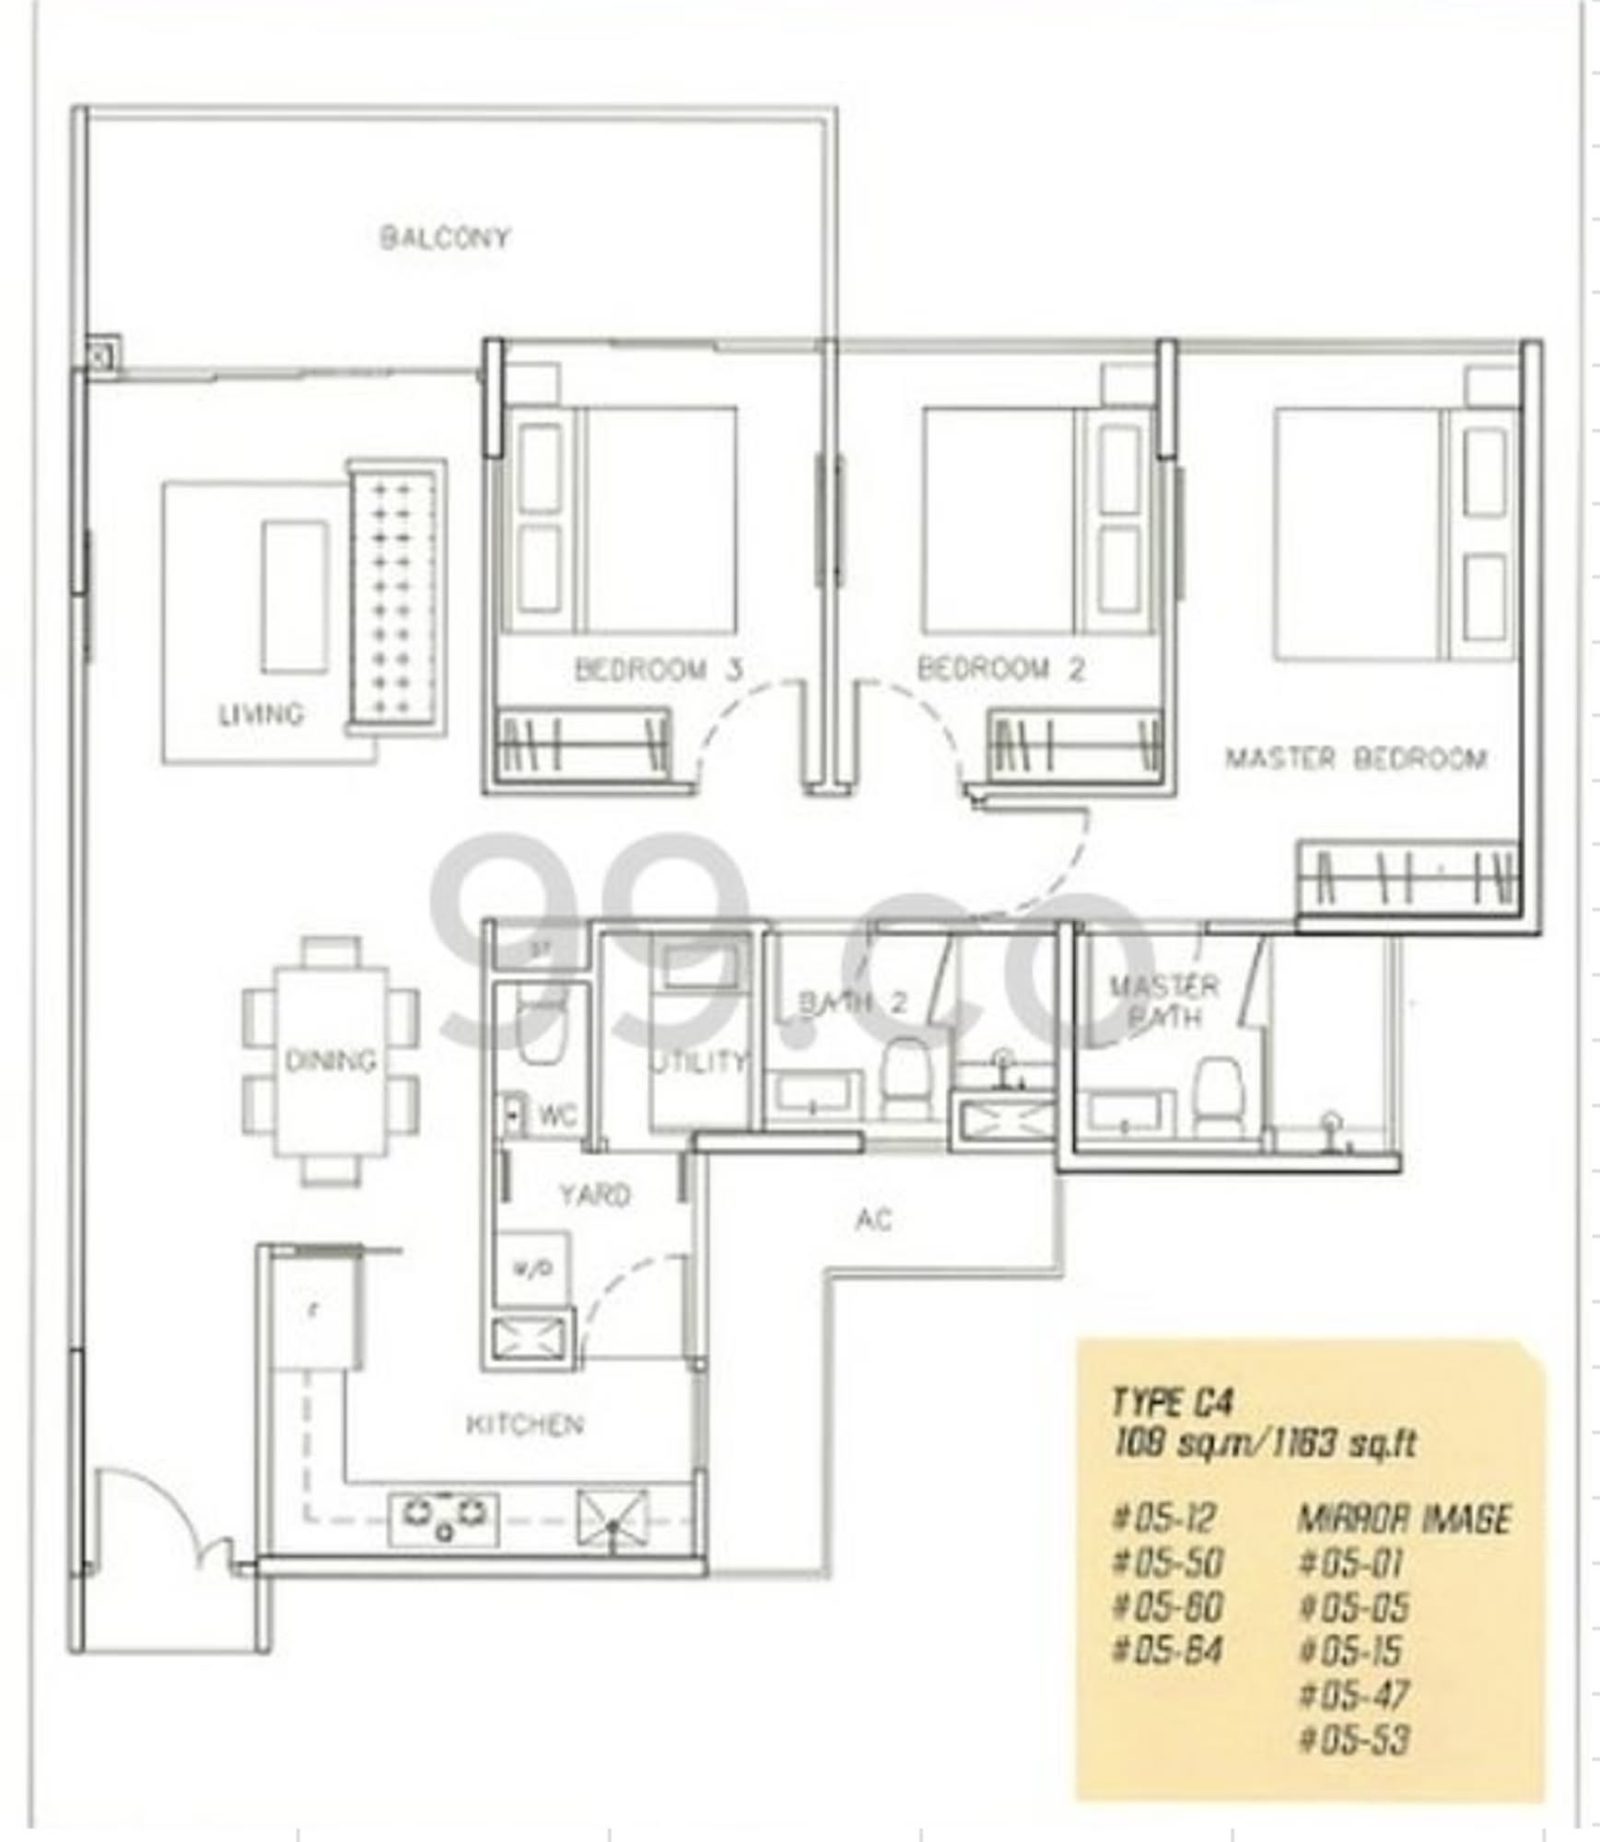
Azalea Park has one of the better layouts here: first because it doesn’t have a space-wasting balcony, and second because it has a more squarish layout than Loyang Valley. Azalea Park also has the most efficient U-shaped kitchen design among the three, with the storeroom nicely tucked behind the nook.
Between the three though, Loyang Valley again wastes the least amount of space on hallways. And as good as Azalea Park’s layout is, Loyang Valley overpowers the small differences just by sheer size – the huge living and dining area can easily be configured to create an extra study or a small bedroom, given the overall 2,045 sq. ft. size.
We will use only resale transactions from 2016 to 2024, to avoid distorting the annualised return from Loyang Park’s long 40-year history:

Loyang Valley grew at an annualised rate of 5.86 per cent, slightly outperforming the broader Pasir Ris market of 99-year leasehold condos, which grew at 5.72 per cent. Again, this is an unusual performance, as it shows Loyang Valley is shrugging off lease decay issues and older facilities.
Let’s have a look at the wider OCR for comparison as well:
| Year | Bedok | Bukit Batok | Bukit Panjang | Choa Chu Kang | Clementi | Hougang | Jurong East | Jurong West | Pasir Ris | Punggol | Sembawang | Sengkang | Serangoon | Tampines | Woodlands | Yishun |
| 2016 | $921 | $790 | $866 | $750 | $953 | $917 | $807 | $916 | $839 | $911 | $959 | $838 | $1,050 | $818 | $822 | $821 |
| 2017 | $944 | $837 | $907 | $762 | $980 | $931 | $915 | $896 | $863 | $954 | $945 | $883 | $1,098 | $831 | $824 | $841 |
| 2018 | $1,076 | $923 | $995 | $758 | $1,073 | $993 | $1,103 | $1,033 | $941 | $1,004 | $913 | $996 | $1,241 | $882 | $779 | $853 |
| 2019 | $1,063 | $917 | $1,029 | $781 | $1,099 | $1,003 | $1,082 | $979 | $961 | $1,017 | $891 | $999 | $1,172 | $894 | $774 | $864 |
| 2020 | $1,070 | $926 | $1,016 | $841 | $1,155 | $1,002 | $1,011 | $990 | $941 | $1,006 | $914 | $1,042 | $1,196 | $924 | $770 | $866 |
| 2021 | $1,148 | $1,013 | $1,123 | $877 | $1,315 | $1,073 | $1,209 | $1,109 | $1,010 | $1,071 | $1,018 | $1,095 | $1,322 | $966 | $883 | $976 |
| 2022 | $1,287 | $1,142 | $1,247 | $989 | $1,447 | $1,218 | $1,324 | $1,218 | $1,127 | $1,226 | $1,169 | $1,223 | $1,457 | $1,134 | $997 | $1,115 |
| 2023 | $1,407 | $1,270 | $1,378 | $1,245 | $1,564 | $1,340 | $1,496 | $1,285 | $1,239 | $1,327 | $1,292 | $1,350 | $1,565 | $1,250 | $1,078 | $1,228 |
| 2024 | $1,485 | $1,334 | $1,422 | $1,294 | $1,637 | $1,399 | $1,434 | $1,408 | $1,310 | $1,417 | $1,334 | $1,442 | $1,714 | $1,442 | $1,155 | $1,252 |
| Annualised | 6.15% | 6.77% | 6.39% | 7.05% | 7.00% | 5.43% | 7.46% | 5.52% | 5.72% | 5.69% | 4.21% | 7.01% | 6.32% | 7.35% | 4.34% | 5.42% |
Across the Outside Central Region (OCR), annualised $PSF growth for 99-year leasehold condos ranged from 4.21 per cent to 7.46 per cent, between 2016 and 2024. We’ve seen Loyang Valley’s annualised growth of 5.86 per cent slightly outperform the Pasir Ris average, and hence it’s competitive with stronger OCR towns despite its advanced age. This defies expectations within the wider OCR as well.
Now let’s look at transaction volumes, as another reflection of demand
No. of resale transactions in Pasir Ris in recent years
| 1-bedders | 2-bedders | 3-bedders | 4-bedders | 5-bedders | |
| 2020 | 82 | 166 | 326 | 82 | 8 |
| 2021 | 149 | 392 | 524 | 174 | 16 |
| 2022 | 122 | 279 | 385 | 114 | 16 |
| 2023 | 94 | 179 | 242 | 67 | 9 |
| 2024 | 80 | 227 | 302 | 111 | 10 |
| % of total unit supply (for 2024 transactions) | 4.06% | 4.41% | 4.27% | 6.43% | 4.31% |
There’s nothing too surprising here. Three and four-bedders showed the highest resale activity, which is what we’d expect from the OCR (this is a family-oriented region, with most buyers being HDB upgrader families).
Notably, four-bedders had the highest turnover rate (6.43 per cent) in 2024 despite having the smallest original supply. This would weigh in favour of Loyang Valley and its larger unit sizes.
Now let’s look at Loyang Valley’s rental yields, to see if there’s investor demand contributing to its continued appreciation
2-bedroom units
| Average rent for 2-bedroom units | Average transacted price | Rental yield | |
| 2016 | $2,783 | $929,000 | 3.60% |
| 2024 | $3,666 | $1,310,000 | 3.36% |
3-bedroom units
| Average rent for 3-bedroom units | Average transacted price | Rental yield | |
| 2016 | $3,332 | $1,133,000 | 3.53% |
| 2024 | $4,164 | $1,762,667 | 2.83% |
So far, this doesn’t appear to be a contributing factor, as rental yields for both the two and three-bedders have dipped. Rental yields are also nothing spectacular at 3.36 per cent and 2.83 per cent for two and three-bedders, respectively.
This suggests owner-occupiers, rather than investors, are probably driving the demand for Loyang Valley. This is typical of an OCR condo, however.
Let’s look at the rental yields of neighbouring condos:
Rental yield of other condos in the vicinity (in 2024)
2-bedroom units
| Average rent | Average price | Rental yield | |
| AVILA GARDENS | $3,183 | $1,020,000 | 3.75% |
| BALLOTA PARK CONDOMINIUM | $3,165 | $1,108,648 | 3.43% |
| CARISSA PARK CONDOMINIUM | $3,246 | $1,116,222 | 3.49% |
| DAHLIA PARK CONDOMINIUM | $3,266 | $1,230,000 | 3.19% |
| EDELWEISS PARK CONDOMINIUM | $3,222 | $1,032,250 | 3.75% |
| ESTELLA GARDENS | $3,219 | $1,100,000 | 3.51% |
| FERRARIA PARK CONDOMINIUM | $3,391 | $1,188,615 | 3.42% |
| HEDGES PARK CONDOMINIUM | $3,174 | $1,036,000 | 3.68% |
| PALM ISLES | $3,297 | $928,841 | 4.26% |
| PARC KOMO | $3,293 | $1,234,286 | 3.20% |
| PARC OLYMPIA | $3,121 | $963,452 | 3.89% |
| THE GALE | $3,453 | $1,307,222 | 3.17% |
| THE INFLORA | $3,355 | $999,100 | 4.03% |
| THE JOVELL | $3,293 | $1,014,286 | 3.90% |
3-bedroom units
| Average rent | Average price | Rental yield | |
| AVILA GARDENS | $3,982 | $1,476,667 | 3.24% |
| AZALEA PARK CONDOMINIUM | $3,757 | $1,414,500 | 3.19% |
| BALLOTA PARK CONDOMINIUM | $3,781 | $1,491,000 | 3.04% |
| CARISSA PARK CONDOMINIUM | $3,970 | $1,612,000 | 2.96% |
| DAHLIA PARK CONDOMINIUM | $3,797 | $1,538,500 | 2.96% |
| EDELWEISS PARK CONDOMINIUM | $3,916 | $1,536,444 | 3.06% |
| ESTELLA GARDENS | $4,067 | $1,464,722 | 3.33% |
| FERRARIA PARK CONDOMINIUM | $4,116 | $1,575,988 | 3.13% |
| HEDGES PARK CONDOMINIUM | $3,713 | $1,324,444 | 3.36% |
| PALM ISLES | $3,812 | $1,274,000 | 3.59% |
| PARC KOMO | $4,233 | $1,723,833 | 2.95% |
| PARC OLYMPIA | $3,853 | $1,260,000 | 3.67% |
| THE GALE | $4,385 | $1,702,500 | 3.09% |
| THE INFLORA | $3,762 | $1,382,000 | 3.27% |
| THE JOVELL | $3,983 | $1,405,648 | 3.40% |
Again, we see Loyang Valley probably doesn’t interest investors as much. While it may have the highest absolute rental rate, thanks to its high square footage, its yields of 3.36 and 2.83 per cent (for two and three-bedders, respectively) are below average for this area. Even older projects like Estella Gardens (3.33 per cent) and The Jovell (3.40 per cent) outperform Loyang Valley on rental yield.
Conclusion:
From 2016 to 2024, Loyang Valley has defied expectations, outperforming many surrounding developments despite its age and 99-year leasehold status.
Islandwide, the price gap between Loyang Valley and other non-landed private properties narrowed by an average of 2.26 per cent across both two and three-bedders, which is still an astounding performance for a 40-year-old leasehold condo. And locally, the reverse occurred: the price gap widened against Loyang Valley’s neighbours (see above), and Loyang Valley has appreciated faster than its neighbours.
From here, we can see that with the right ingredients – large and efficient layouts, greenery views, and upcoming access to an MRT station – an older leasehold project can outperform even newer freehold counterparts. This is proof that there are almost always exceptions to the rule in the property market.
We should add, however, that Loyang Valley is an outlier: it’s a rare combination of traits that allows a condo to perform better, and we wouldn’t expect it of most ageing leasehold projects.
It’s not just about tenure, it’s about recognising when the fundamentals are aligned for outperformance.
Curious how these principles apply to your own home search or selling strategy? Let’s chat – we’ll connect you with someone from our team who can break it down based on your goals.
For more detailed comparisons and insights, check out our case studies of The Tanamera, Orchid Park, and The Arcadia in the next articles on Stacked Pro.