
In this Stacked Pro breakdown:
– We studied over 30 resale transactions at Treasure at Tampines to uncover if early buyers actually profited more
– See how a mere 6–12 month difference in purchase timing impacted returns — sometimes up to 150% more profit
– Learn why later buyers occasionally outperformed, and how resale timing plays a crucial role in your investment outcome
Already a subscriber? Log in here.
As the largest condo development currently existing in Singapore (2,203 units), Treasure at Tampines is the very embodiment of a mega-development. With room for a wider range of facilities and lower costs (both in quantum and for maintenance), it’s emblematic of why many Singaporeans prefer bigger projects today. There’s also one more added advantage: due to its vast size and longer period of developer sales, Treasure provides an excellent study of whether it’s best to buy earlier or later for a new launch. Here’s what we found out:
A rundown on Treasure at Tampines
Treasure at Tampines is a 99-year leasehold condo in Tampines (District 18). It’s the largest condo project in Singapore to date, by unit count: there are 2,203 units here. Treasure was launched in March 2019 and was completed in 2023. The average annualised return has been 5.5 per cent, with the typical holding period being 3.8 years (this is a bit shorter than our other case studies, as Treasure is very new).
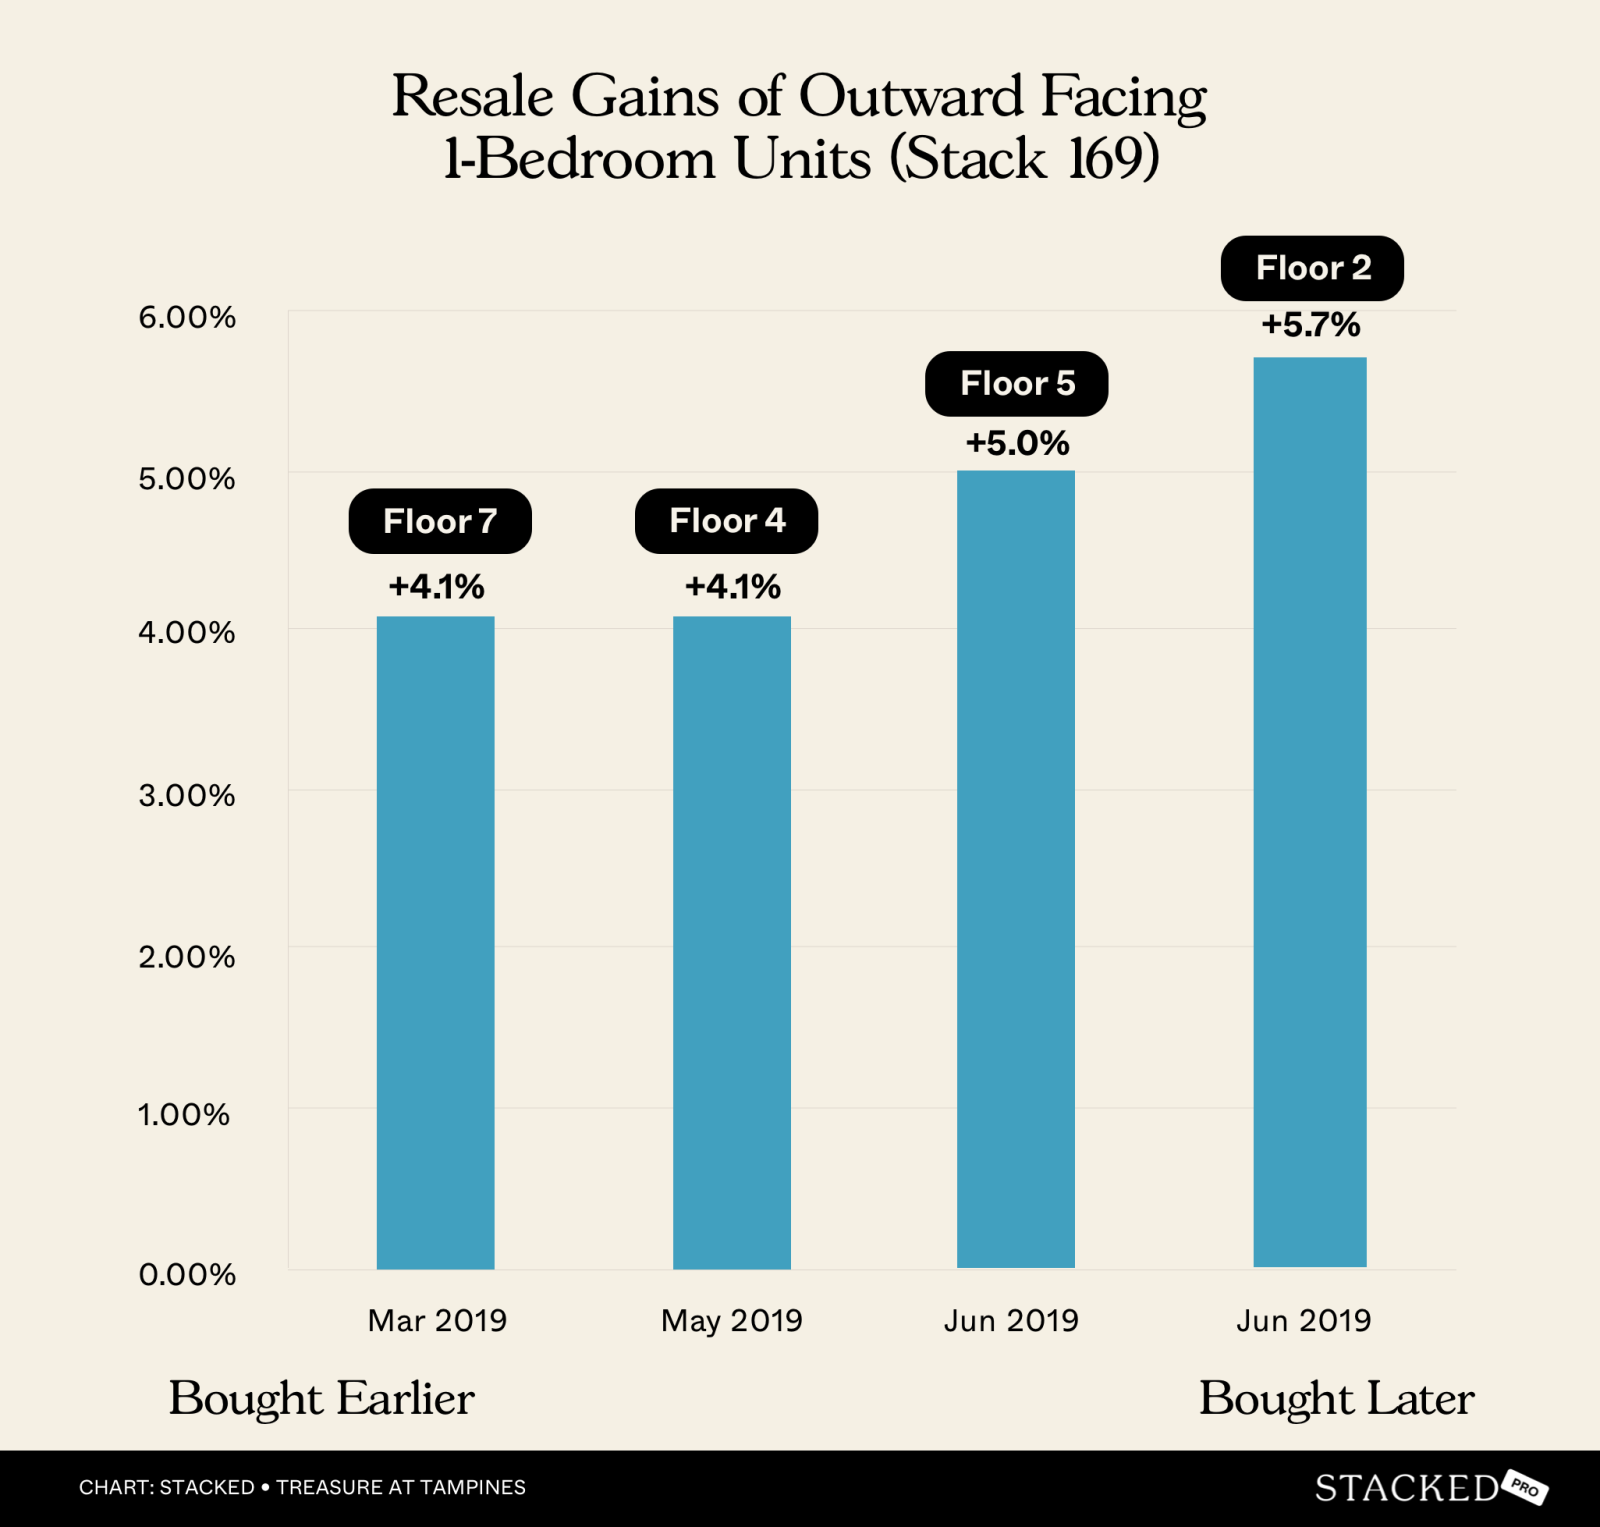
Let’s start by looking at the 1-bedders, which face the direction of the PIE
| Sold on | Address | Size | Bedrooms | Sale PSF | Profit/loss | Purchase PSF | Purchase date | Days | Years | Annualised (%) |
| 23 Jul 2024 | 49 Tampines Lane #07-169 | 484 | 1 | 1,641 | 155,000 | 1,321 | 23 Mar 2019 | 1,949 | 5.3 | 4.1 |
| 28 Jun 2024 | 49 Tampines Lane #04-169 | 484 | 1 | 1,602 | 145,000 | 1,303 | 11 May 2019 | 1,875 | 5.1 | 4.1 |
| 21 Aug 2023 | 49 Tampines Lane #05-169 | 484 | 1 | 1,610 | 145,000 | 1,311 | 1 Jun 2019 | 1,542 | 4.2 | 5 |
| 29 Sep 2023 | 49 Tampines Lane #02-169 | 484 | 1 | 1,631 | 167,000 | 1,286 | 24 Jun 2019 | 1,558 | 4.3 | 5.7 |
Note that during early developer sales, the premium difference between floors was not substantial; but the advantage of a higher floor did show an advantage during resales. E.g., higher floors (#07-169) commanded slightly higher sale PSFs ($1,641) compared to lower floors (#02-169, $1,631).
Annualised gains and profits are consistent between the units with similar holding periods.
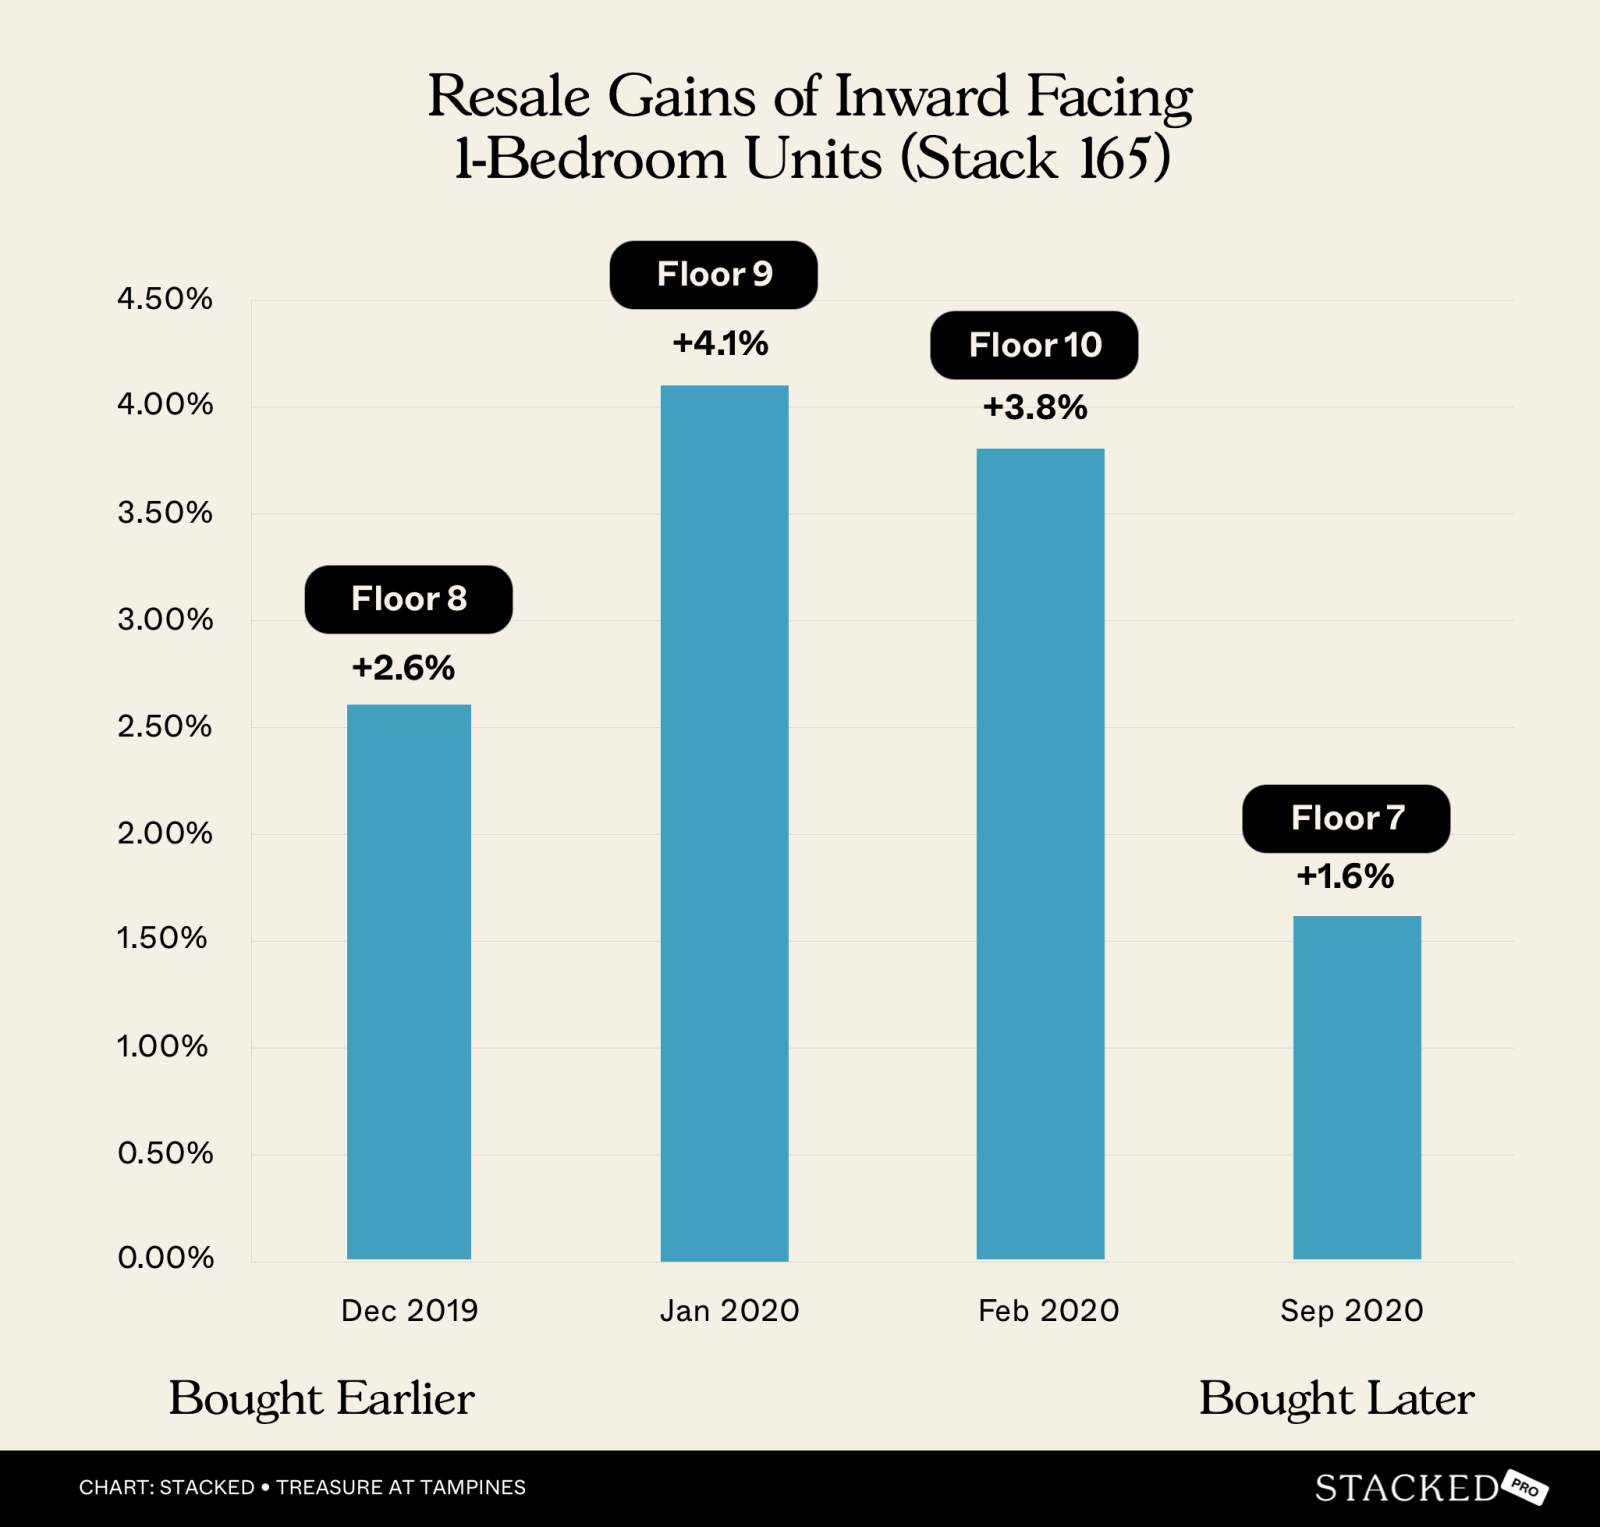
But let’s look at some other 1-bedders, which are inward-facing instead
| Sold on | Address | Size | Bedrooms | Sale PSF | Profit/loss | Purchase PSF | Purchase date | Days | Years | Annualised (%) |
| 26 Jan 2023 | 49 Tampines Lane #08-165 | 463 | 1 | 1,599 | 58,000 | 1,473 | 12 Dec 2019 | 1,141 | 3.1 | 2.6 |
| 22 Sep 2023 | 49 Tampines Lane #09-165 | 463 | 1 | 1,707 | 108,888 | 1,472 | 12 Jan 2020 | 1,349 | 3.7 | 4.1 |
| 30 Jul 2024 | 49 Tampines Lane #10-165 | 463 | 1 | 1,750 | 124,000 | 1,482 | 28 Feb 2020 | 1,614 | 4.4 | 3.8 |
| 22 Oct 2024 | 49 Tampines Lane #07-165 | 463 | 1 | 1,694 | 50,000 | 1,586 | 16 Sep 2020 | 1,497 | 4.1 | 1.6 |
Earlier purchases (e.g., #08-165 and #09-165) had a lower price psf ($1,473 and $1,472), hence the higher annualised returns compared to later purchases.
The most notable example can be found between #10-16 and #07-16. Notice that both #10-16 and #07-16 had a roughly similar holding period of just over four years. But because #07-16 was purchased at a later date (September instead of February), it was purchased at around seven per cent higher. This resulted in #10-16 seeing profits of almost 150 per cent higher.
Likewise, note that #07-16 was bought at 7.7 per cent higher than #08-16, because it was bought 10 months after #08-16. So we can see how its later purchase contributes to it showing the smallest gains.
Finally, we observe that the purchase of #08-16 and #09-16 were just one month apart (December 2019 and January 2020, respectively). At the time, #09-16 was sold at just $1 more in psf. But by the time #10-16 was purchased in February 2020, it was priced at around $10 psf higher than #09-16. This shows how the price gap widened for 1-bedders across the sales period.
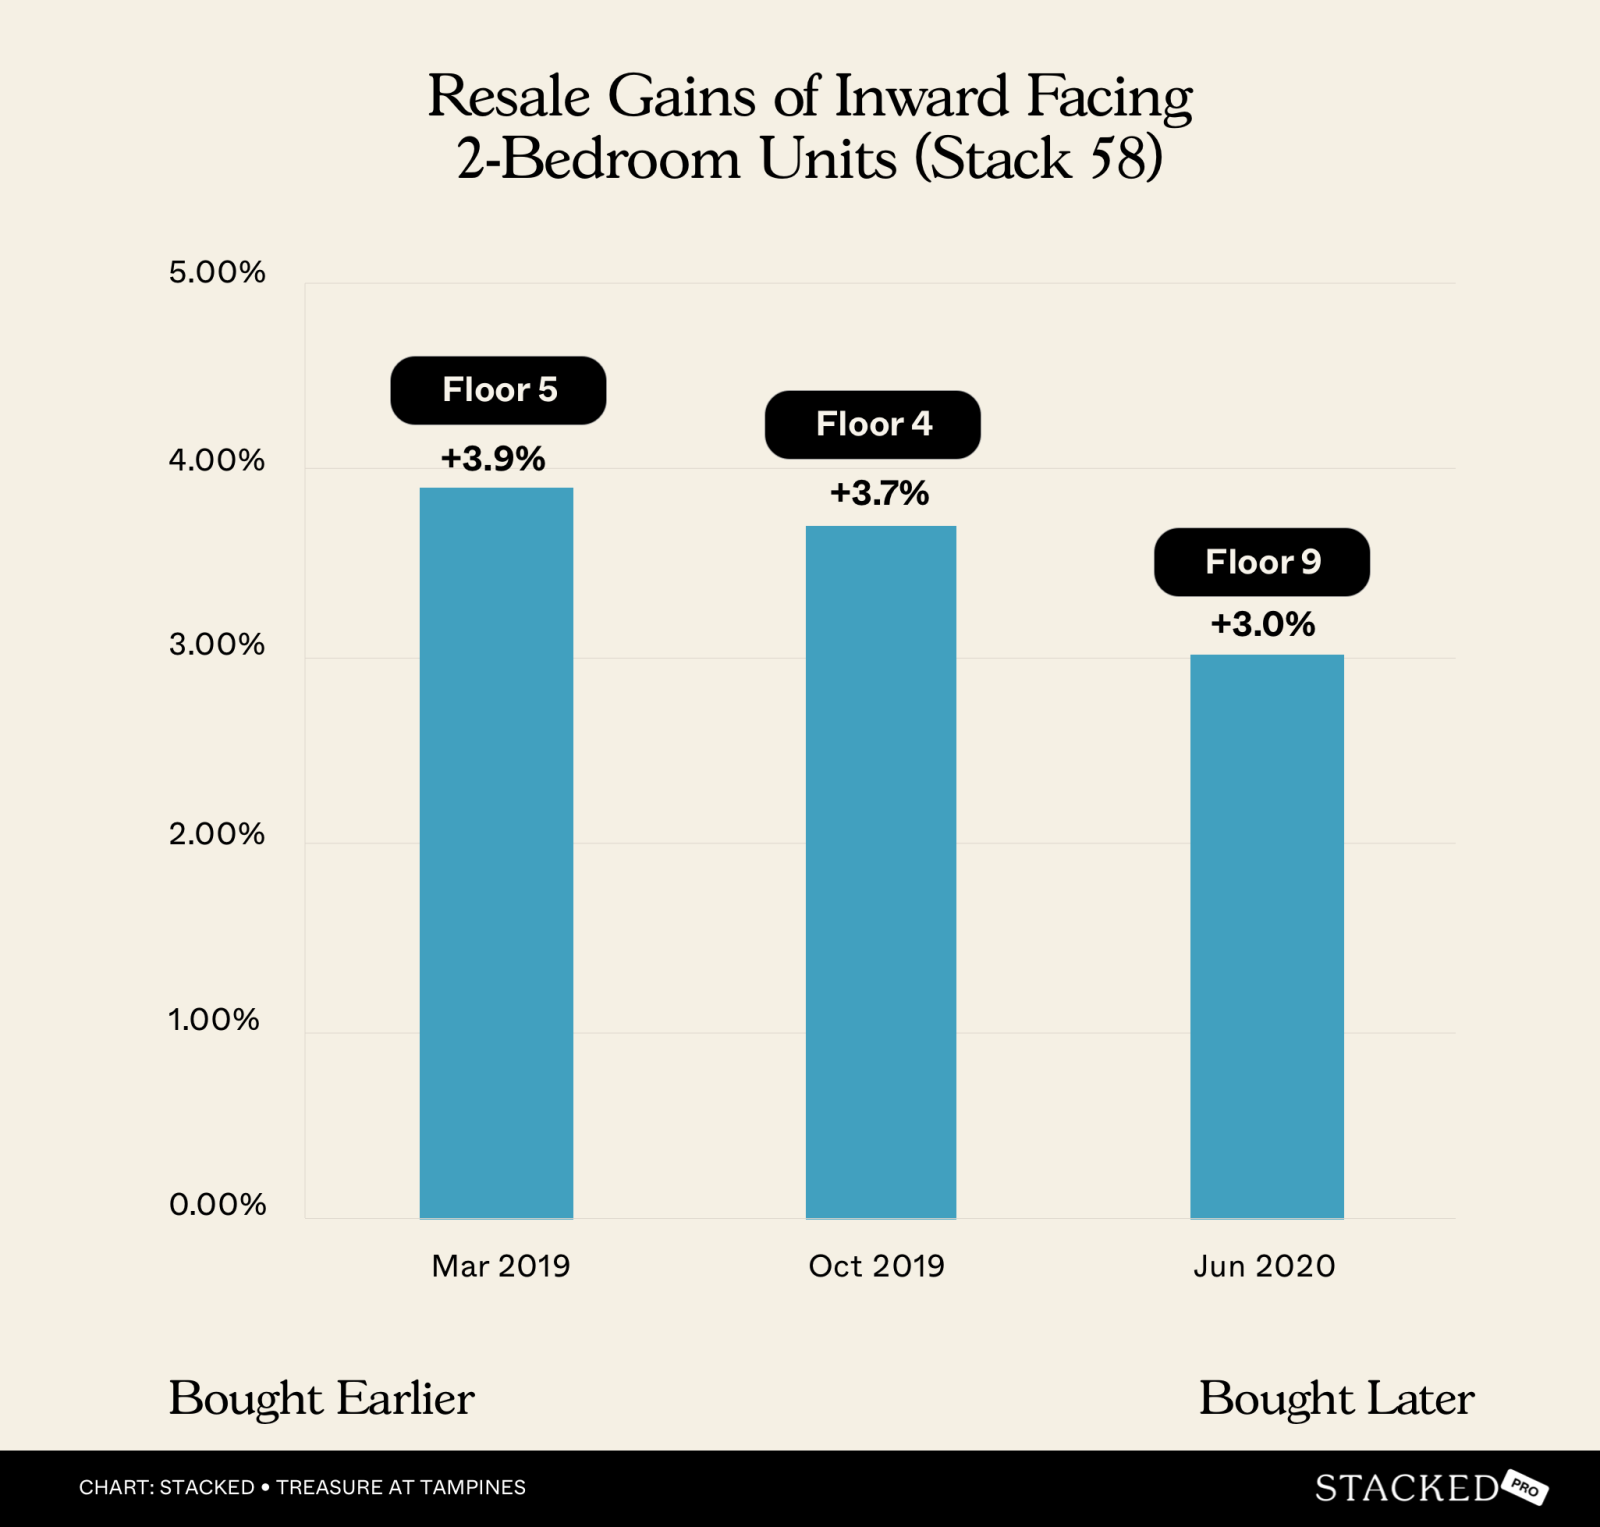
2-bedders (inward facing)
| Sold on | Address | Size | Bedrooms | Sale PSF | Profit/loss | Purchase PSF | Purchase date | Days | Years | Annualised (%) |
| 8 Nov 2023 | 15 Tampines Lane #05-58 | 592 | 2 | 1,659 | 158,000 | 1,392 | 23 Mar 2019 | 1,691 | 4.6 | 3.9 |
| 30 Jun 2023 | 15 Tampines Lane #04-58 | 592 | 2 | 1,605 | 122,000 | 1,399 | 3 Oct 2019 | 1,366 | 3.7 | 3.7 |
| 22 Jul 2024 | 15 Tampines Lane #09-58 | 592 | 2 | 1,638 | 110,000 | 1,453 | 18 Jun 2020 | 1,495 | 4.1 | 3 |
Again, earlier purchases at a lower price psf resulted in better annualised gains.
#05-58 was the first to be bought on our list. By the time #04-58 was bought half a year later, the price was about 0.5 per cent higher. And by the time #09-58 was bought, about eight months after #04-58, the price had gone up by around four per cent.
(In addition, the price premium per floor had risen from around 0.5 per cent to 0.8 per cent)
#05-58 saw the highest gain, despite not being on the highest floor of the three.
Unit #09-58, three floors higher, achieved a selling price of just $1,638 psf, versus #05-08’s selling price of $1,659 psf; so we can see the advantage of buying earlier here.
If you compare #04-58 and #09-58, which have a closer holding period, the profits made by the later purchase are also lower; a difference of about 0.7 per cent.
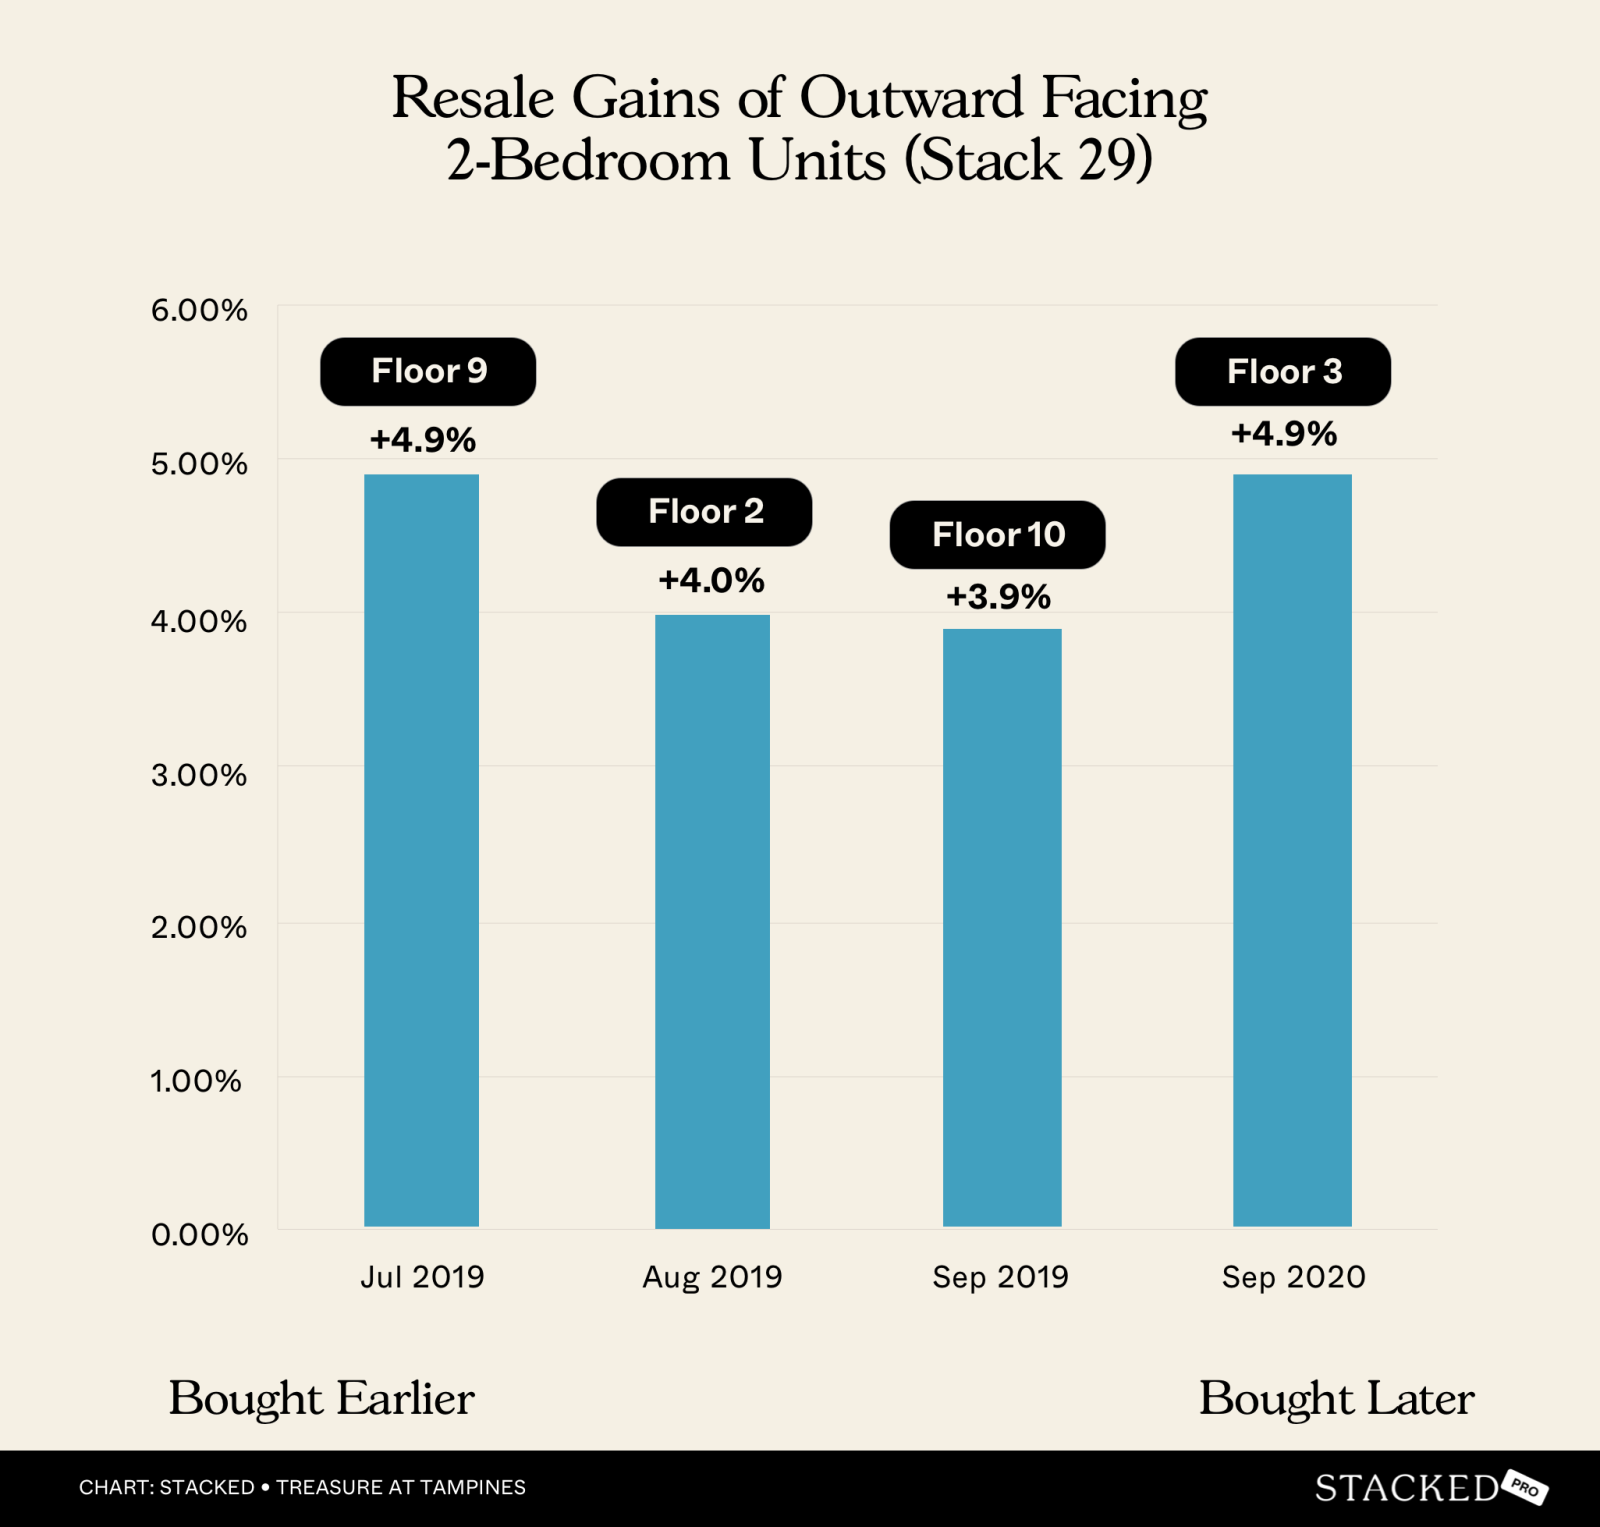
2-bedders (outer facing)
| Sold on | Address | Size | Bedrooms | Sale PSF | Profit/loss | Purchase PSF | Purchase date | Days | Years | Annualised (%) |
| 6 Apr 2023 | 7 Tampines Lane #09-29 | 592 | 2 | 1,660 | 160,000 | 1,390 | 10 Jul 2019 | 1,366 | 3.7 | 4.9 |
| 5 Jan 2024 | 7 Tampines Lane #02-29 | 592 | 2 | 1,588 | 149,000 | 1,336 | 4 Aug 2019 | 1,615 | 4.4 | 4 |
| 5 Feb 2024 | 7 Tampines Lane #10-29 | 592 | 2 | 1,655 | 152,000 | 1,399 | 1 Sep 2019 | 1,618 | 4.4 | 3.9 |
| 20 Oct 2023 | 7 Tampines Lane #03-29 | 592 | 2 | 1,655 | 137,000 | 1,424 | 3 Sep 2020 | 1,142 | 3.1 | 4.9 |
While the earlier purchases generally won out, #03-29 is an oddity here.
Despite being bought the latest (September 2020), and at a higher price psf than the others ($1,424 psf), it still achieved an annualised return higher than the earliest purchase (#09-29). It’s also on a lower floor and has a shorter holding period!
(That said, #03-29 was the lowest in absolute gains of $137,000).
This oddity aside, we can still see how prices rose across the months, and how the next latest purchase (#10-29 in September 2019) saw the lowest annualised returns, being the next latest purchase.
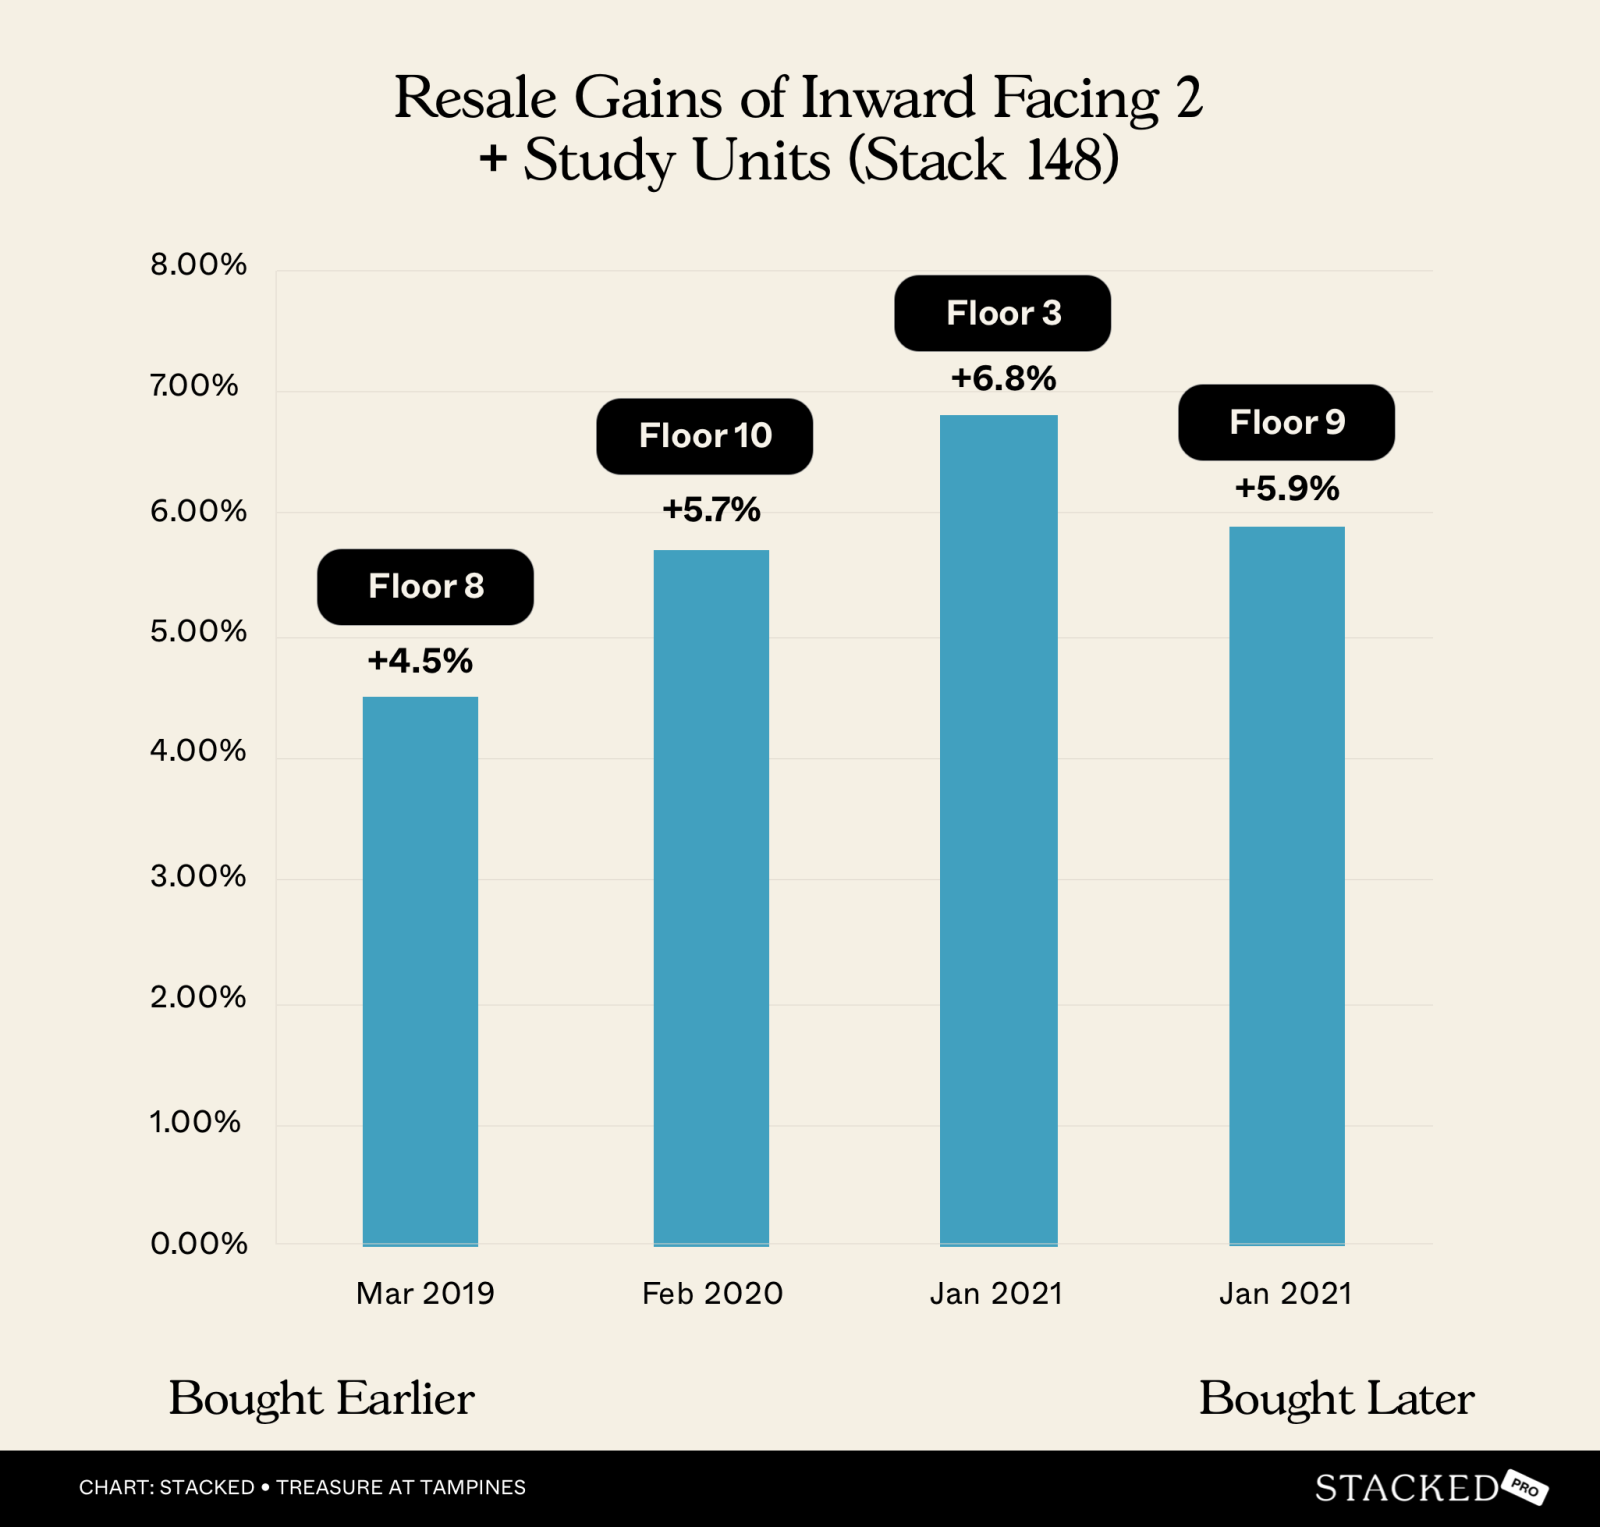
2+Study units
| Sold on | Address | Size | Bedrooms | Sale PSF | Profit/loss | Purchase PSF | Purchase date | Days | Years | Annualised (%) |
| 19 Dec 2024 | 45 Tampines Lane #08-148 | 678 | 2 | 1,836 | 277,000 | 1,427 | 31 Mar 2019 | 2,090 | 5.7 | 4.5 |
| 6 Apr 2023 | 45 Tampines Lane #10-148 | 678 | 2 | 1,725 | 185,000 | 1,453 | 29 Feb 2020 | 1,132 | 3.1 | 5.7 |
| 28 Mar 2024 | 45 Tampines Lane #03-148 | 678 | 2 | 1,770 | 227,000 | 1,435 | 16 Jan 2021 | 1,167 | 3.2 | 6.8 |
| 26 Feb 2024 | 45 Tampines Lane #09-148 | 678 | 2 | 1,770 | 194,000 | 1,483 | 24 Jan 2021 | 1,128 | 3.1 | 5.9 |
In this case, the earliest buyers (e.g., #08-148) locked in lower PSFs, achieving higher total profits; however, they saw lower annualised returns. Later buyers (e.g., #03-148) achieved excellent annualised returns (6.8 per cent) in a shorter time frame.
#08-14 was among the earliest purchases, selling within the month of the initial launch. By the time #10-14 was purchased, about 11 months later, the price was up by about 1.8 per cent (though note the minor two-storey difference).
#03-14, which was bought around two years after #08-14, was bought at a 0.6 per cent higher price, despite being five floors lower than #08-14.
There are two oddities here: #09-18 was bought later than #10-18, at a price of about two per cent higher; but it still saw a slightly higher gain, despite a similar holding period to #10-18.
#08-14 to #03-14 is the most glaring difference, as #03-14 achieved higher annualised returns despite being bought much later (#08-14 was purchased in March 2019, whereas #03-14 was purchased in January 2021). But note that while its annualised gain was higher, it had an absolute profit that was about $50,000 lower.
3-bedders
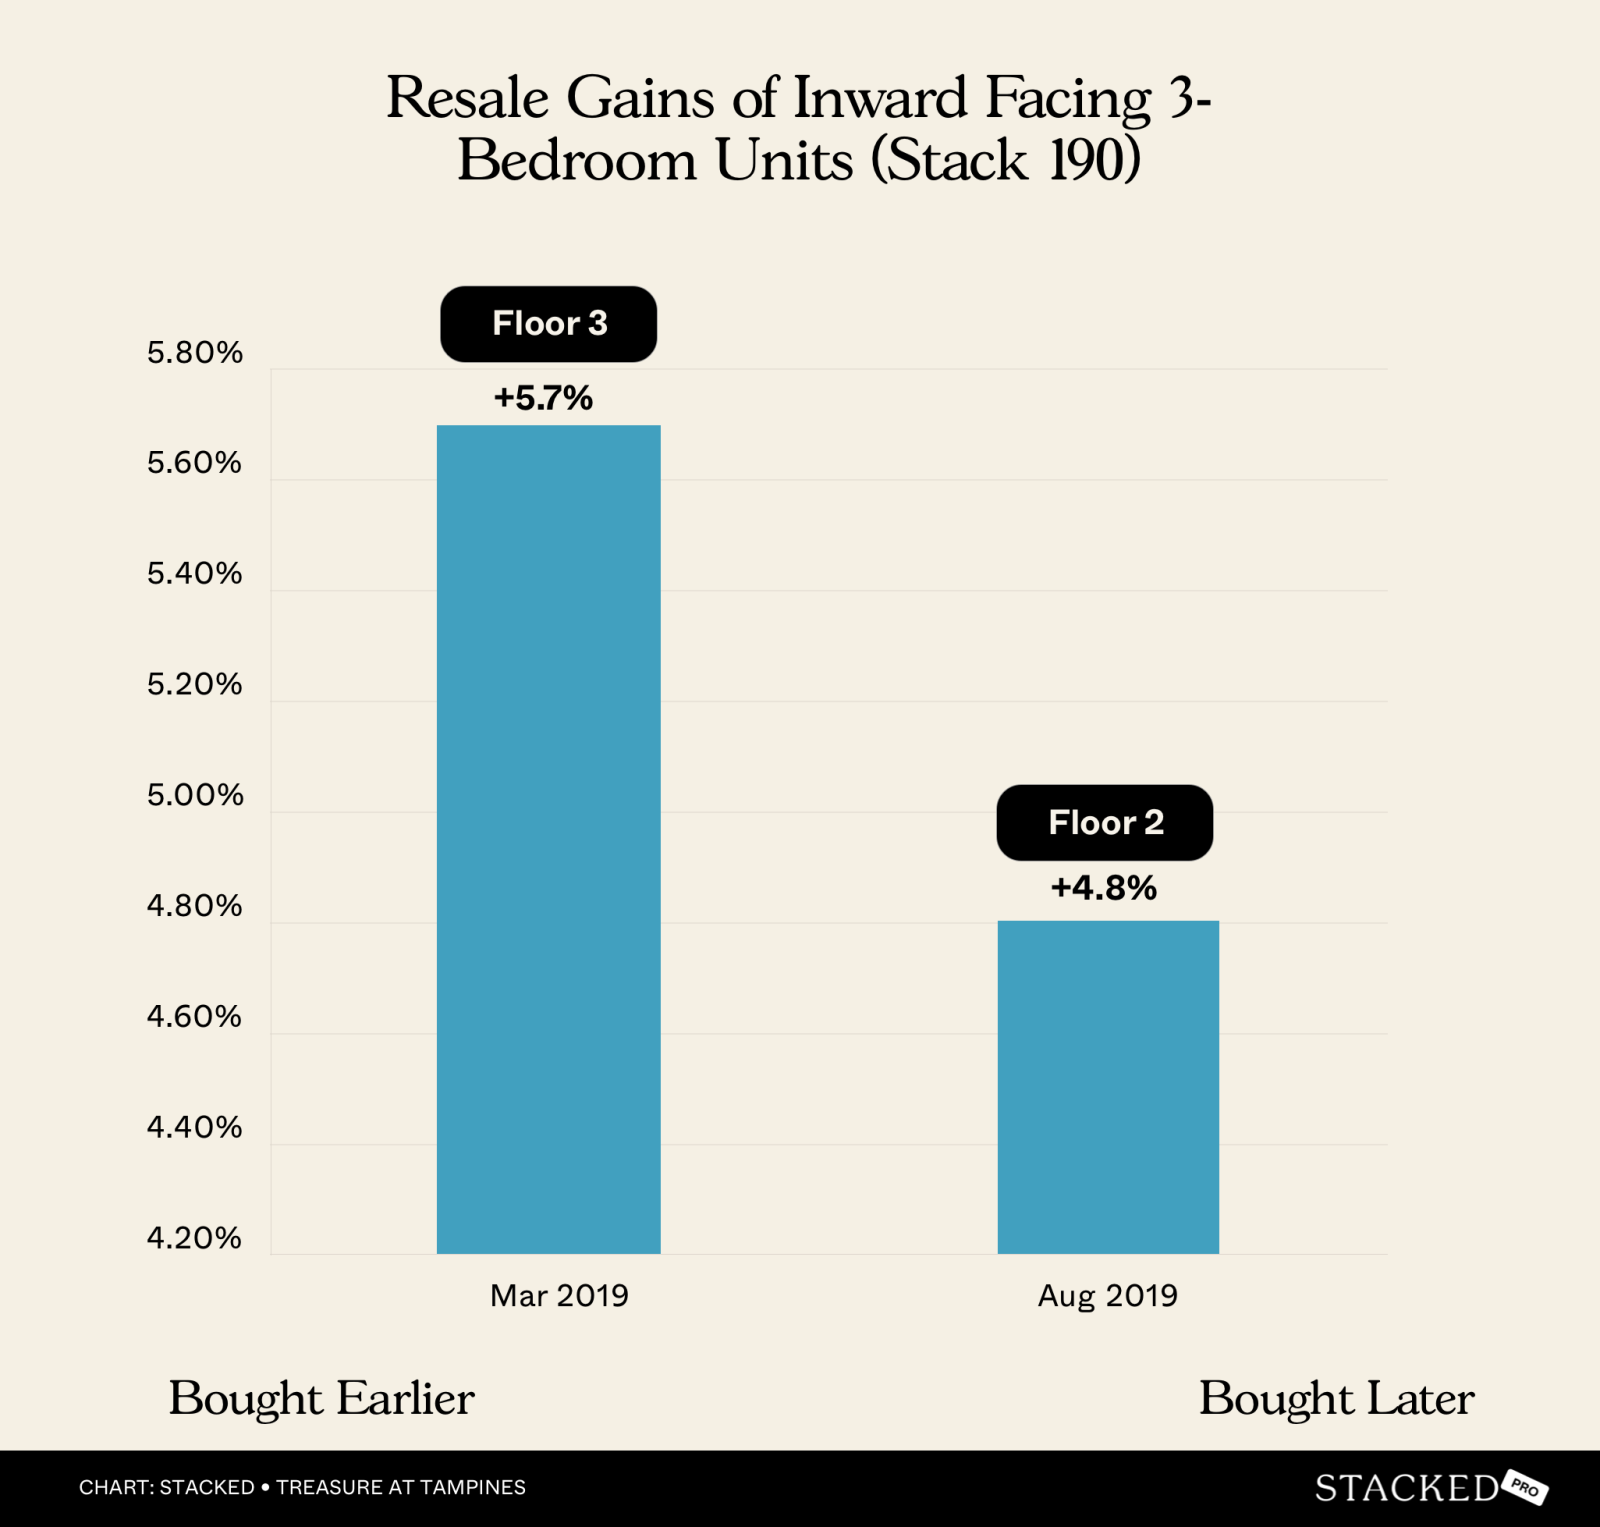
There’s only one viable point of comparison we found here (relatively similar holding periods). It’s these two units:
| Sold on | Address | Size | Bedrooms | Sale PSF | Profit/loss | Purchase PSF | Purchase date | Days | Years | Annualised (%) |
| 5 May 2023 | 55 Tampines Lane #03-190 | 840 | 3 | 1,667 | 284,000 | 1,329 | 23 Mar 2019 | 1,504 | 4.1 | 5.7 |
| 17 Aug 2023 | 55 Tampines Lane #02-190 | 840 | 3 | 1,608 | 228,000 | 1,336 | 31 Aug 2019 | 1,447 | 4.0 | 4.8 |
The third-floor unit (#03-190) outperformed the second-floor unit (#02-190) in both annualised returns and absolute profit. This is likely due to its lower purchase price and higher floor.
#02-19 was bought around five months after #03-190, and at a price point that’s 0.5 per cent higher. Upon resale, this ended up translating to making around $50,000 less.
Inward-facing 3-bedder units
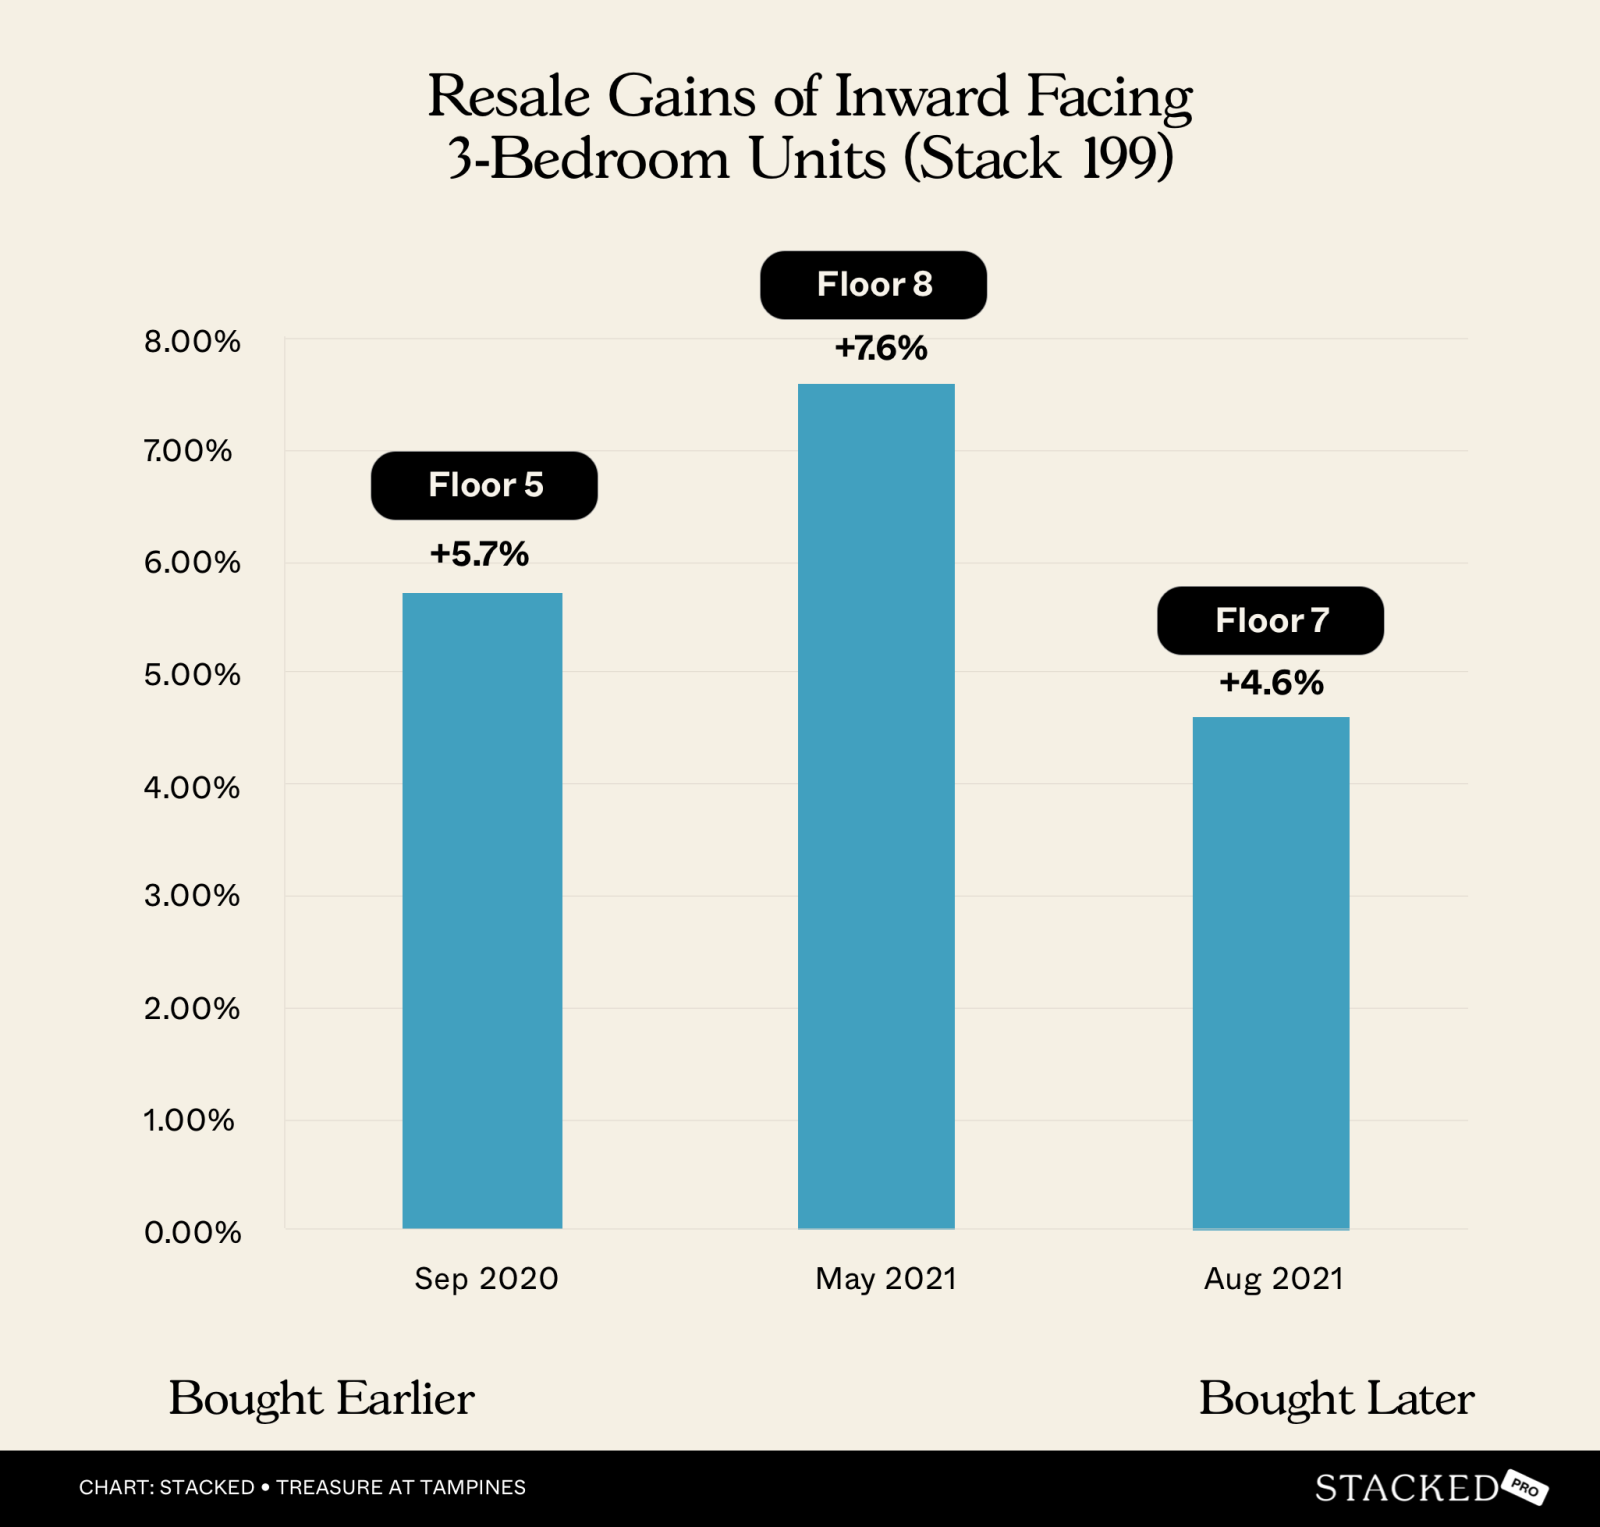
| Sold on | Address | Size | Bedrooms | Sale PSF | Profit/loss | Purchase PSF | Purchase date | Days | Years | Annualised (%) |
| 29 Jan 2024 | 57 Tampines Lane #05-199 | 947 | 3 | 1,636 | 263,000 | 1,359 | 20 Sep 2020 | 1,226 | 3.4 | 5.7 |
| 29 Oct 2024 | 57 Tampines Lane #08-199 | 947 | 3 | 1,795 | 377,000 | 1,397 | 30 May 2021 | 1,248 | 3.4 | 7.6 |
| 13 Dec 2024 | 57 Tampines Lane #07-199 | 947 | 3 | 1,786 | 235,000 | 1,538 | 5 Aug 2021 | 1,226 | 3.4 | 4.6 |
It could be that purchasing in a phase of market growth (2021) and selling in an upswing (2024) resulted in some of the quirks here. #08-19 had the highest annualised return, despite being purchased much later than #05-19.
While #08-19 was purchased higher (about 2.8 per cent more), it had a stronger annualised return than #05-19, despite a similar holding period. Compared to #07-19, which also had the same holding period, we can see that #08-19 still had a higher return and a higher profit of over $142,000.
There may be other factors about the unit, such as being on a higher floor, that also contributed to the higher price point.
3-bedders facing the PIE
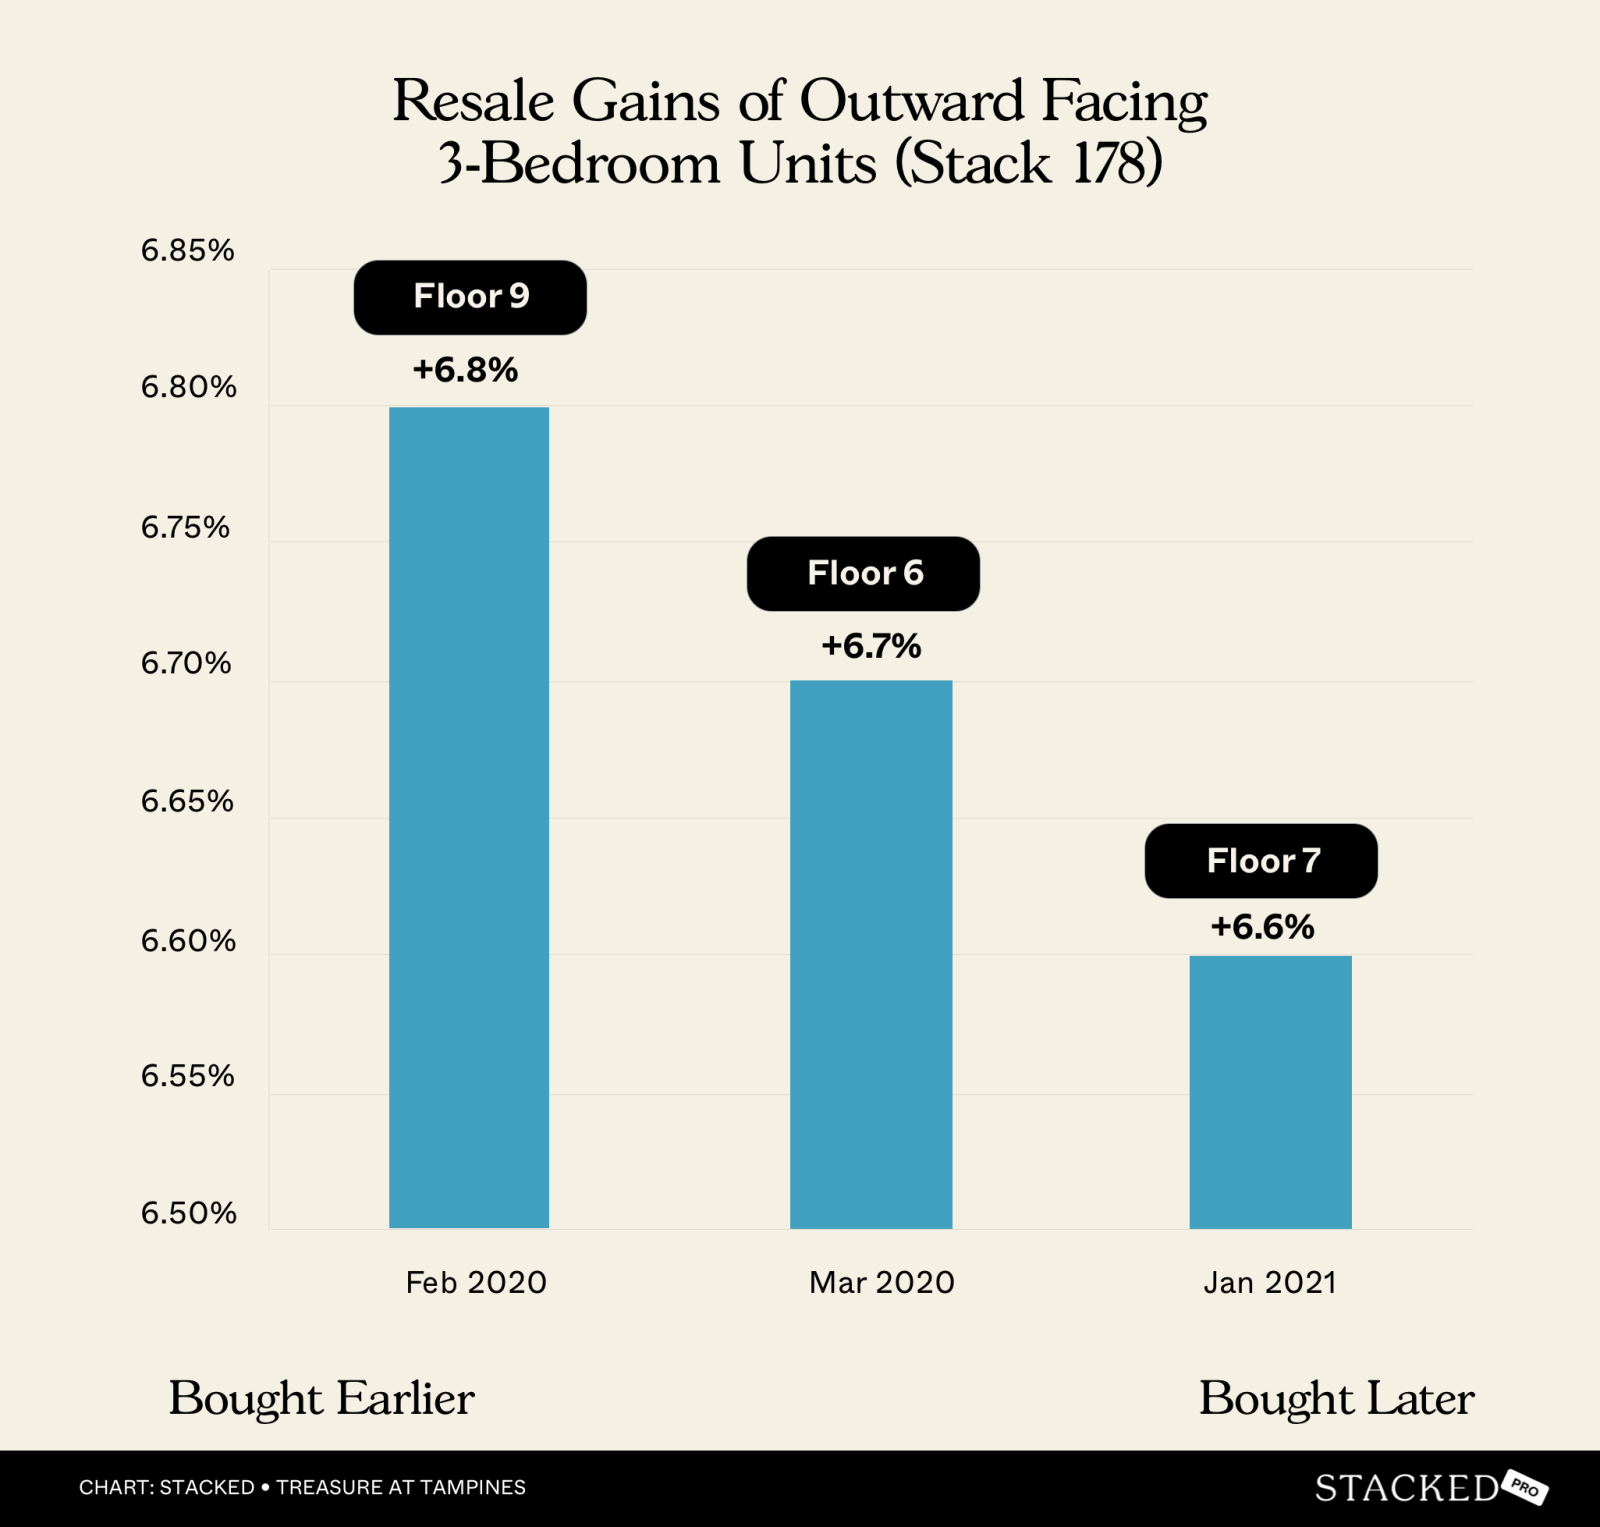
| Sold on | Address | Size | Bedrooms | Sale PSF | Profit/loss | Purchase PSF | Purchase date | Days | Years | Annualised (%) |
| 1 Jun 2023 | 51 Tampines Lane #09-178 | 915 | 3 | 1,585 | 279,000 | 1,280 | 25 Feb 2020 | 1,192 | 3.3 | 6.8 |
| 19 Apr 2024 | 51 Tampines Lane #06-178 | 915 | 3 | 1,650 | 353,000 | 1,265 | 14 Mar 2020 | 1,497 | 4.1 | 6.7 |
| 23 Sep 2024 | 51 Tampines Lane #07-178 | 915 | 3 | 1,683 | 323,000 | 1,330 | 24 Jan 2021 | 1,338 | 3.7 | 6.6 |
The differences seem flat among this batch. The annualised returns are very similar, despite their different points of purchase. While the gains do go down slightly for each later purchase, a difference of 0.1 per cent is quite negligible.
That said, if you compare #06-17 and #07-17, their holding periods are not too far off, but #06-17 still saw absolute profits of about $30,000 more. Also note that the earliest purchase, #09-17, had the lowest absolute gain.
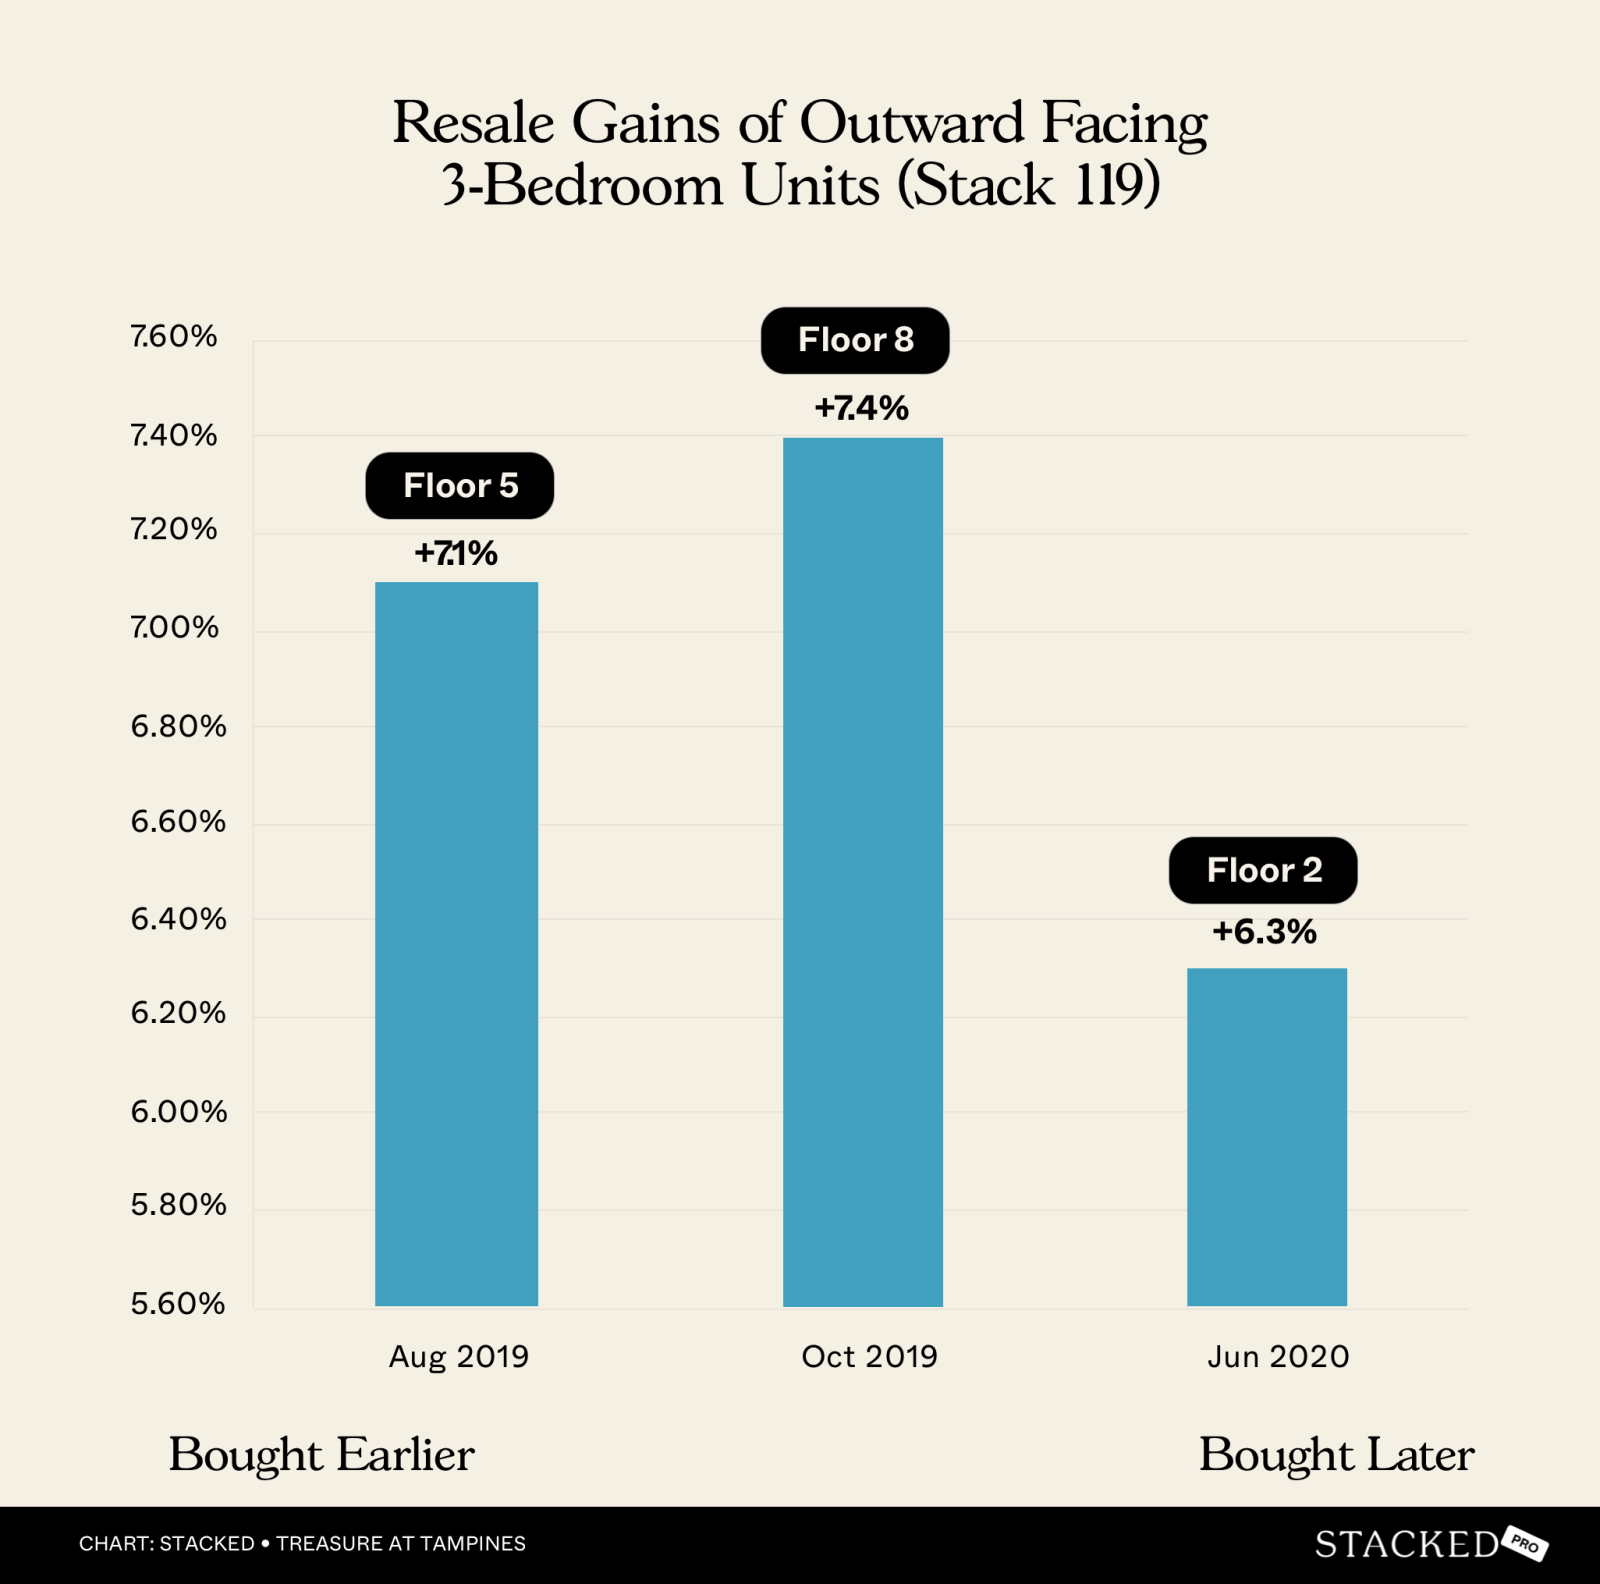
Premium 3-bedders
| Sold on | Address | Size | Bedrooms | Sale PSF | Profit/loss | Purchase PSF | Purchase date | Days | Years | Annualised (%) |
| 23 May 2023 | 37 Tampines Lane #05-119 | 1,033 | 3 | 1,626 | 381,000 | 1,257 | 15 Aug 2019 | 1,377 | 3.8 | 7.1 |
| 18 Aug 2023 | 37 Tampines Lane #08-119 | 1,033 | 3 | 1,694 | 418,000 | 1,289 | 17 Oct 2019 | 1,401 | 3.8 | 7.4 |
| 13 Sep 2024 | 37 Tampines Lane #02-119 | 1,033 | 3 | 1,626 | 386,000 | 1,252 | 1 Jun 2020 | 1,565 | 4.3 | 6.3 |
As with many previous batches, buying early brought an edge. #05-119 and #02-119 had a similar price upon resale, but #05-119 achieved a higher total profit due to its lower purchase price. This difference was just $5 less psf at purchase, but resulted in an annualised gain of 0.8 per cent higher.
Also note that #08-119, which was bought two months after #05-119, sold for 2.55 per cent higher, averaging an increase of about 0.85 per cent per floor. But #02-119, which was sold 10 months after #05-119, saw a price difference of 0.4 per cent higher, despite being three floors lower.
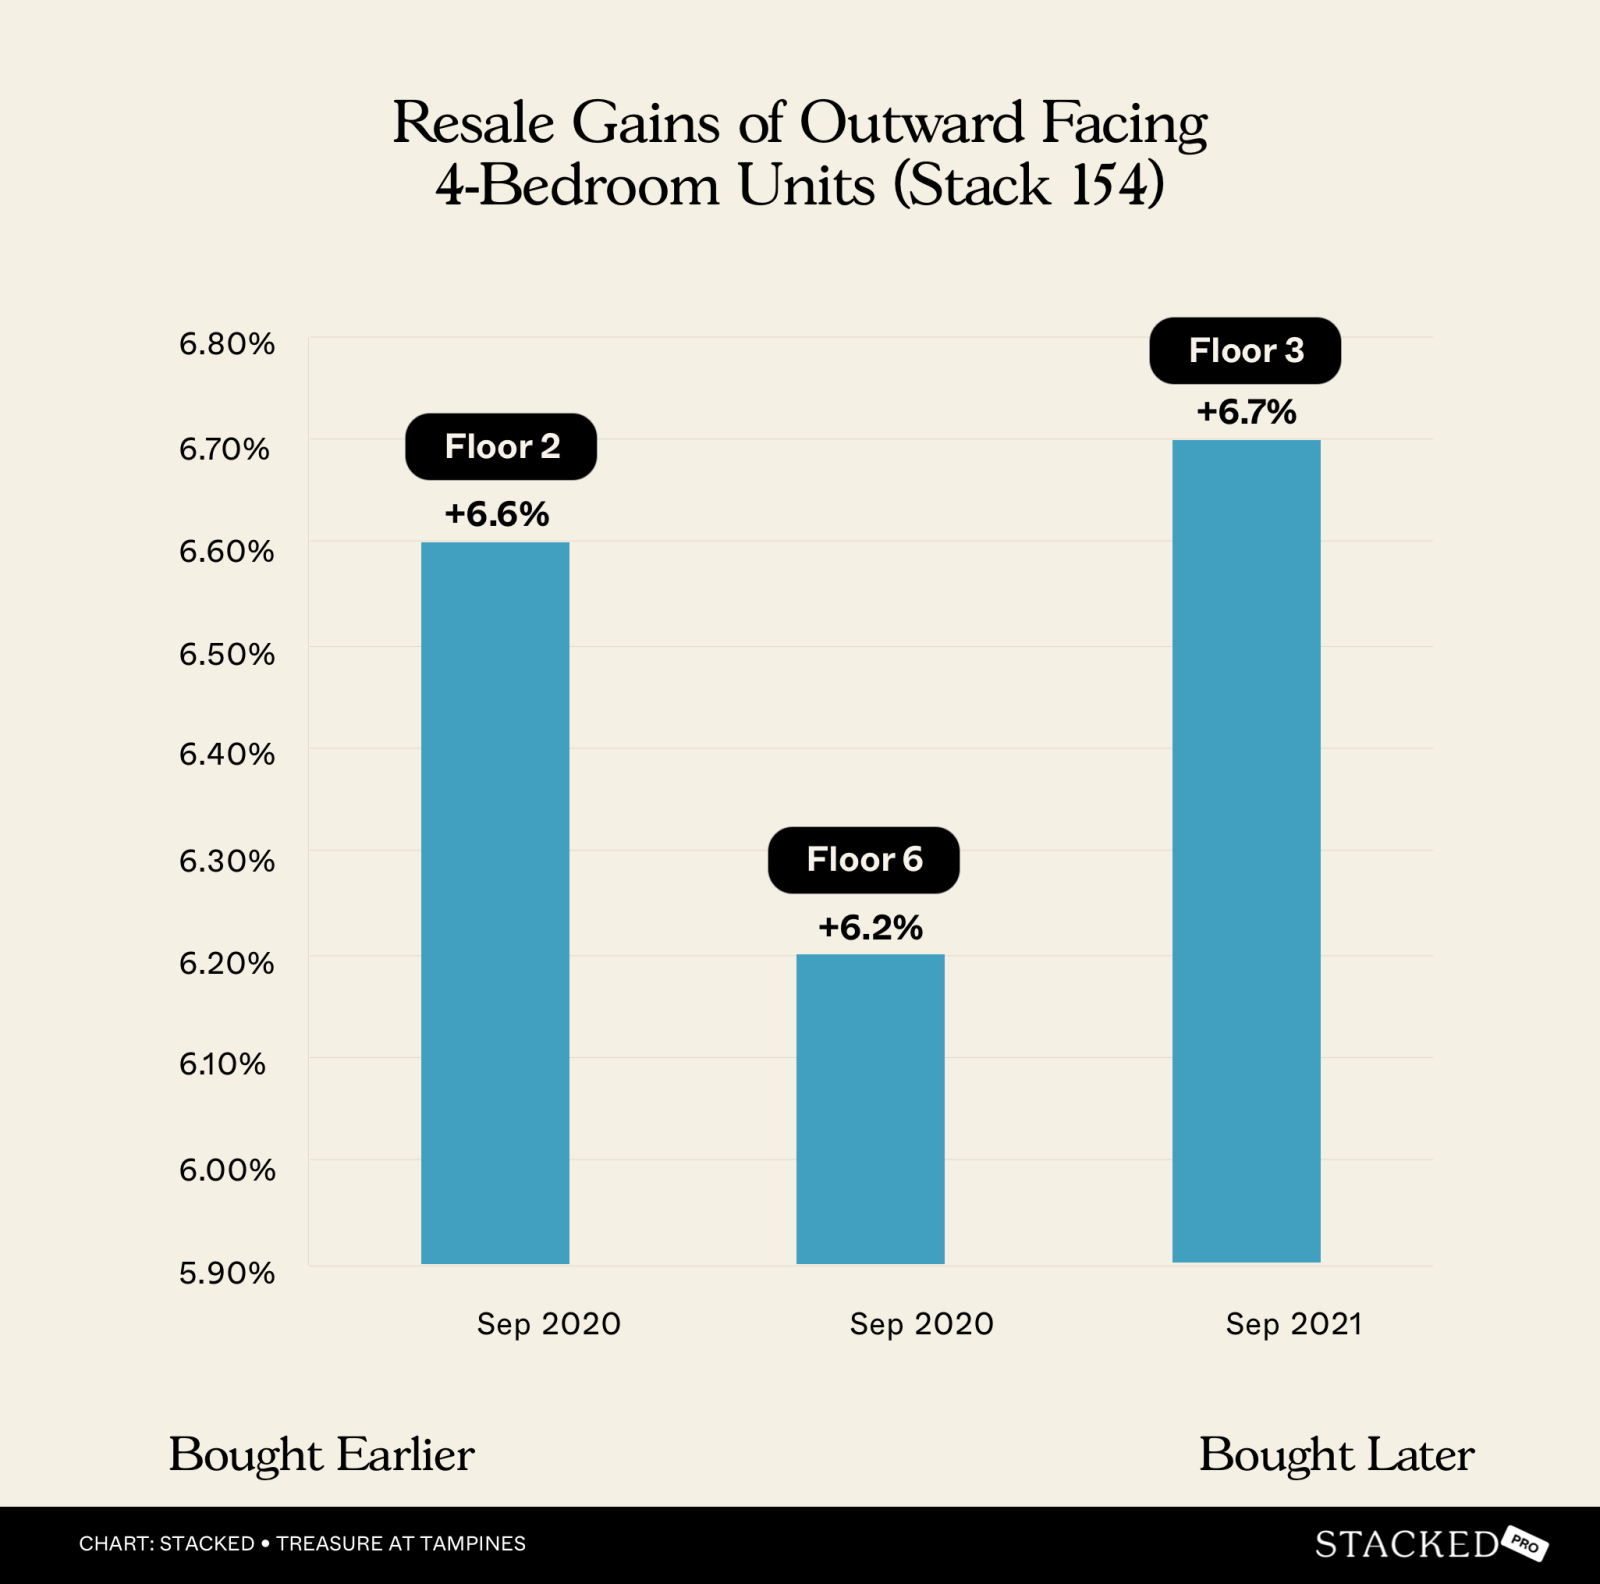
4-bedder units
| Sold on | Address | Size | Bedrooms | Sale PSF | Profit/loss | Purchase PSF | Purchase date | Days | Years | Annualised (%) |
| 9 Sep 2024 | 45 Tampines Lane #02-154 | 1,238 | 4 | 1,656 | 466,000 | 1,280 | 5 Sep 2020 | 1,465 | 4.0 | 6.6 |
| 20 Dec 2024 | 45 Tampines Lane #06-154 | 1,238 | 4 | 1,684 | 473,000 | 1,302 | 20 Sep 2020 | 1,552 | 4.3 | 6.2 |
| 9 Oct 2024 | 45 Tampines Lane #03-154 | 1,238 | 4 | 1,616 | 363,000 | 1,322 | 1 Sep 2021 | 1,134 | 3.1 | 6.7 |
#02-154, with the lowest purchase price of $1,280 psf, achieved the highest total profit. This shows that buying early, at a lower price, can lead to better overall returns, even if the annualised return isn’t the highest.
On the flip side, notice that #03-15, which was bought the latest, had the highest annualised return; this was on account of a much shorter holding period compared to #02-15 and #06-15. However, its absolute profit is lower than its counterparts by around $100,000, despite the higher annualised gains.
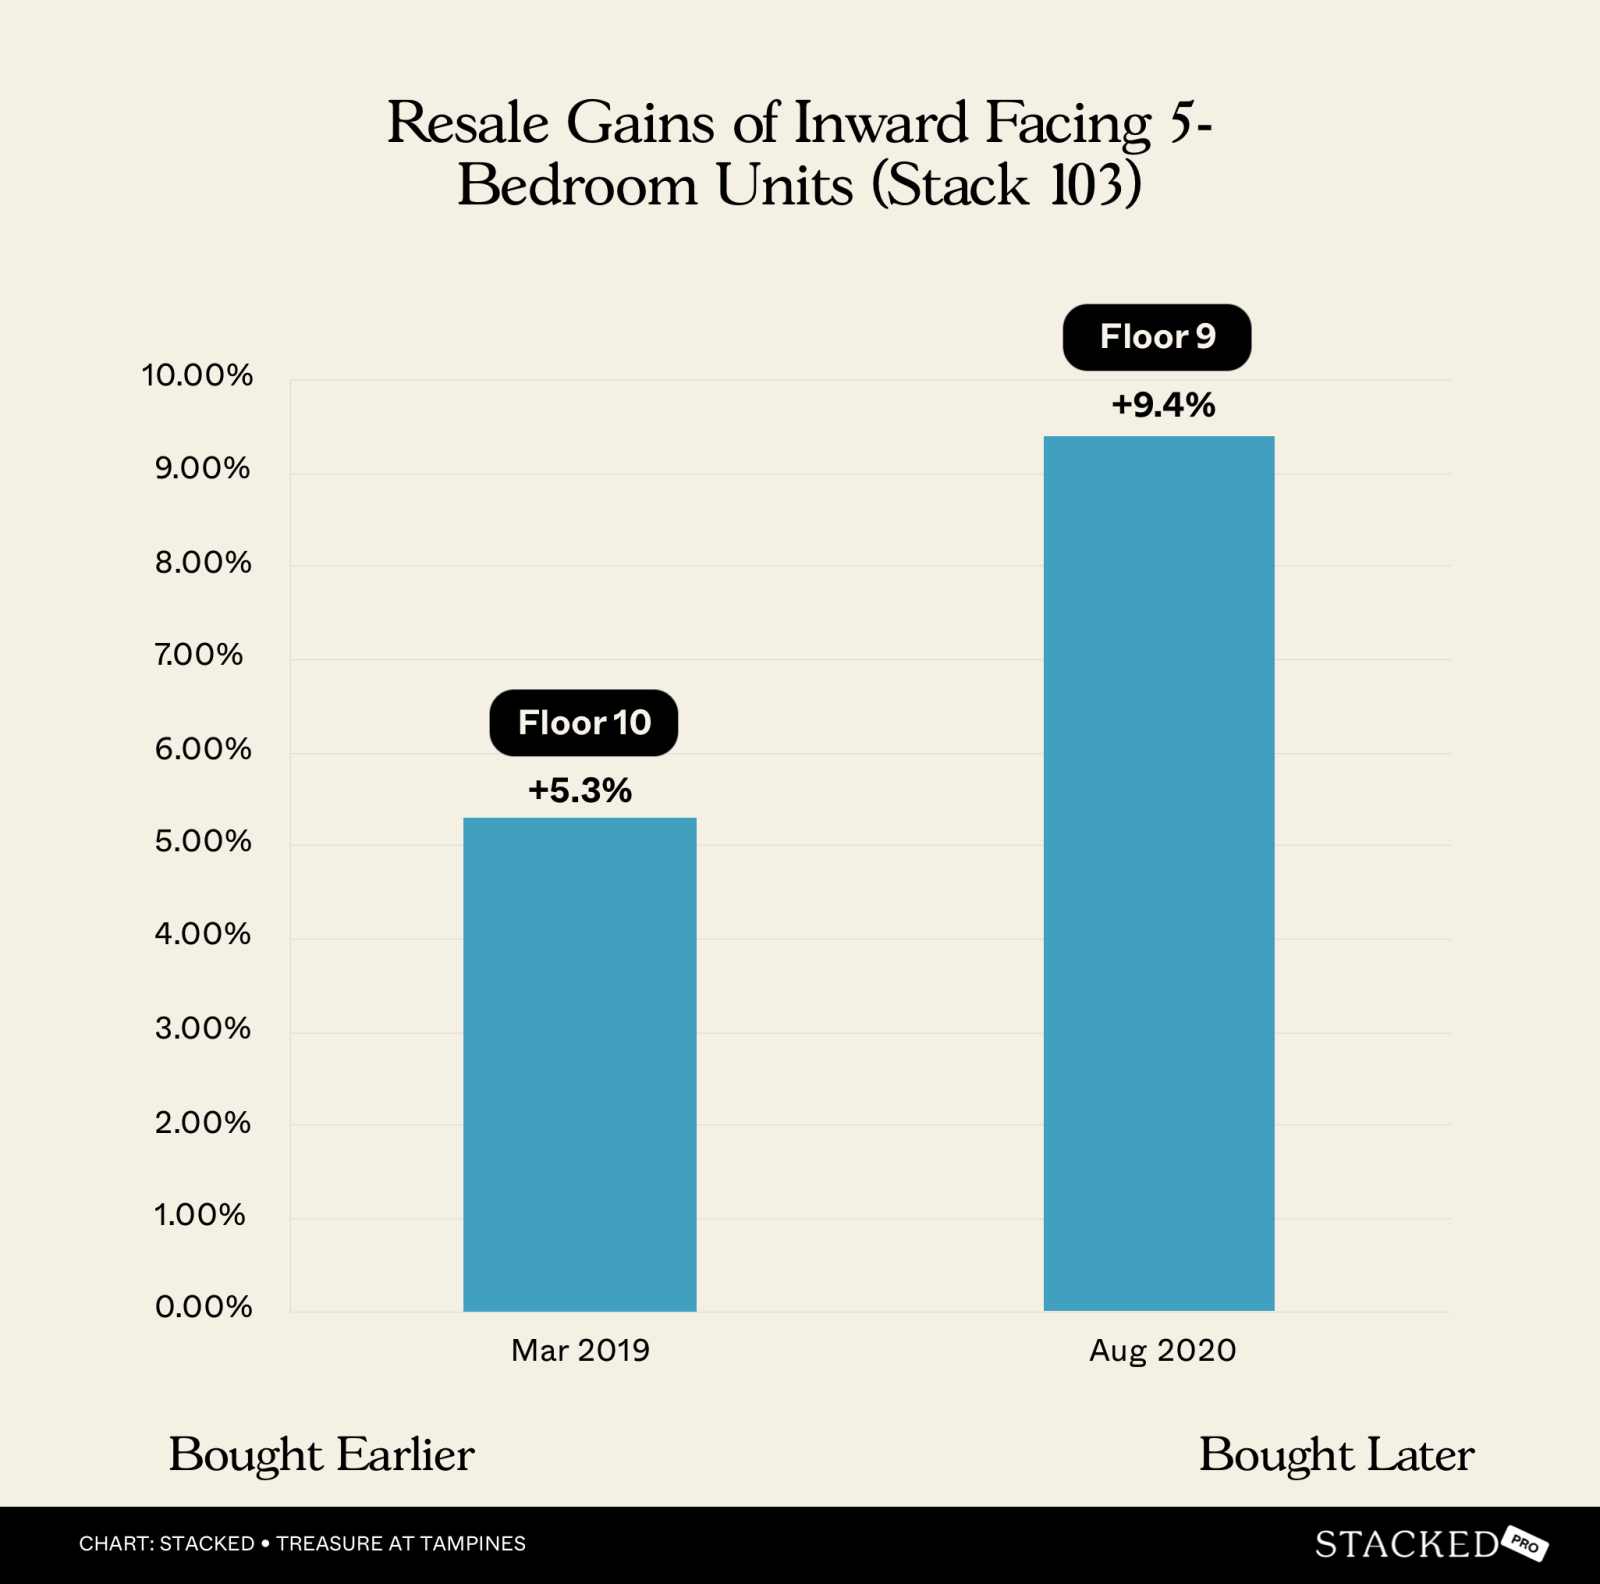
5-bedder units
| Sold on | Address | Size | Bedrooms | Sale PSF | Profit/loss | Purchase PSF | Purchase date | Days | Years | Annualised (%) |
| 31 Jan 2023 | 31 Tampines Lane #10-103 | 1,722 | 5 | 1,481 | 461,000 | 1,213 | 23 Mar 2019 | 1,410 | 3.9 | 5.3 |
| 19 Sep 2023 | 31 Tampines Lane #09-103 | 1,722 | 5 | 1,619 | 673,888 | 1,228 | 23 Aug 2020 | 1,122 | 3.1 | 9.4 |
These two units work against the notion of buying earlier. #10-10 was purchased almost 1.5 years before #09-10, and its purchase price reflects that: #10-10 was bought at a much lower $1,228 psf.
In spite of that, #09-10 managed to fetch a higher absolute profit and a higher annualised return. We doubt this is an issue of floor level, as one floor shouldn’t make so much of a difference. It could be more about the resale timing: the market may have been further along its upswing in September of 2023, versus earlier in the year.
General conclusions:
Among larger 4 and 5-bedder units, there were fewer observable advantages in buying earlier. This may be due to the units taking much longer to sell (because of their high quantum) versus the smaller units. This resulted in less substantial price hikes as the launch progressed.
Note: When units are hot and selling fast, developers tend to raise the prices to maximise their gains. But for units that are not moving, developers tend to raise the price much more slowly, or even not at all.
We can also see more restrained price adjustments within the first year of the launch. This is likely due to Treasure at Tampines not only being a mega-launch, but one of the largest condos ever by unit count. The developer had a five-year window to sell all the units, so they probably wanted to keep up their sales volumes and not ramp up prices too soon.
(Once price has been raised, it’s very hard for the developer to drop it again in future, without angering early bird buyers and sustaining reputational damage)
While the general trend seemed to favour buyers who stepped in early, we do notice that some units that were bought later could achieve better gains; and sometimes with shorter holding periods as well. This is possibly due to the strong upward price momentum in the post-COVID (2021 to 2023) period, and shows that the point of selling (and market conditions at the time) are just as important as the point of purchase.
For more deep dives into the Singapore property market, or for questions about your real estate needs, follow us on Stacked. If you’d like to get in touch for a more in-depth consultation, you can do so here.


