In our previous piece, we saw how one/two-bedders in District 10 fared. This time, we’ll turn to the larger three- and four-bedders, which cater to a different segment of the market altogether. In D10, these bigger units are less about investors and more about families who want to settle in prime locations like Tanglin, Holland, and Bukit Timah. Space and privacy tend to weigh more heavily here, sometimes eclipsing concerns like resale gains; many of these homes are seen as long-term residences rather than investment assets.
The key question is whether, for these larger unit types, do newer launches in D10 justify their higher psf, or if older developments (many of which were luxury projects in their day) offer better value once we account for age, lease decay, and rental performance. This article focuses specifically on these larger units to assess how newer and older condos stack up against each other in today’s market.
As before, we’ll use 20 years as the cut-off between “newer” and “older” projects. We’ll also focus on 99-year leasehold condos, where lease decay is a major concern.
Let’s start by looking at the overall performance of three- and four-bedders in D10
3-bedroom units
Average $PSF
| Year | New | Old | Difference |
| 2014 | $1,361 | $1,313 | $49 |
| 2015 | $1,281 | $1,364 | -$83 |
| 2016 | $1,479 | $1,206 | $273 |
| 2017 | $1,670 | $1,308 | $362 |
| 2018 | $1,536 | $1,390 | $146 |
| 2019 | $1,533 | $1,501 | $32 |
| 2020 | $1,550 | $1,248 | $302 |
| 2021 | $1,616 | $1,546 | $70 |
| 2022 | $1,770 | $1,676 | $94 |
| 2023 | $1,882 | $1,675 | $207 |
| 2024 | $1,953 | $1,822 | $131 |
| Annualised | 3.67% | 3.34% |
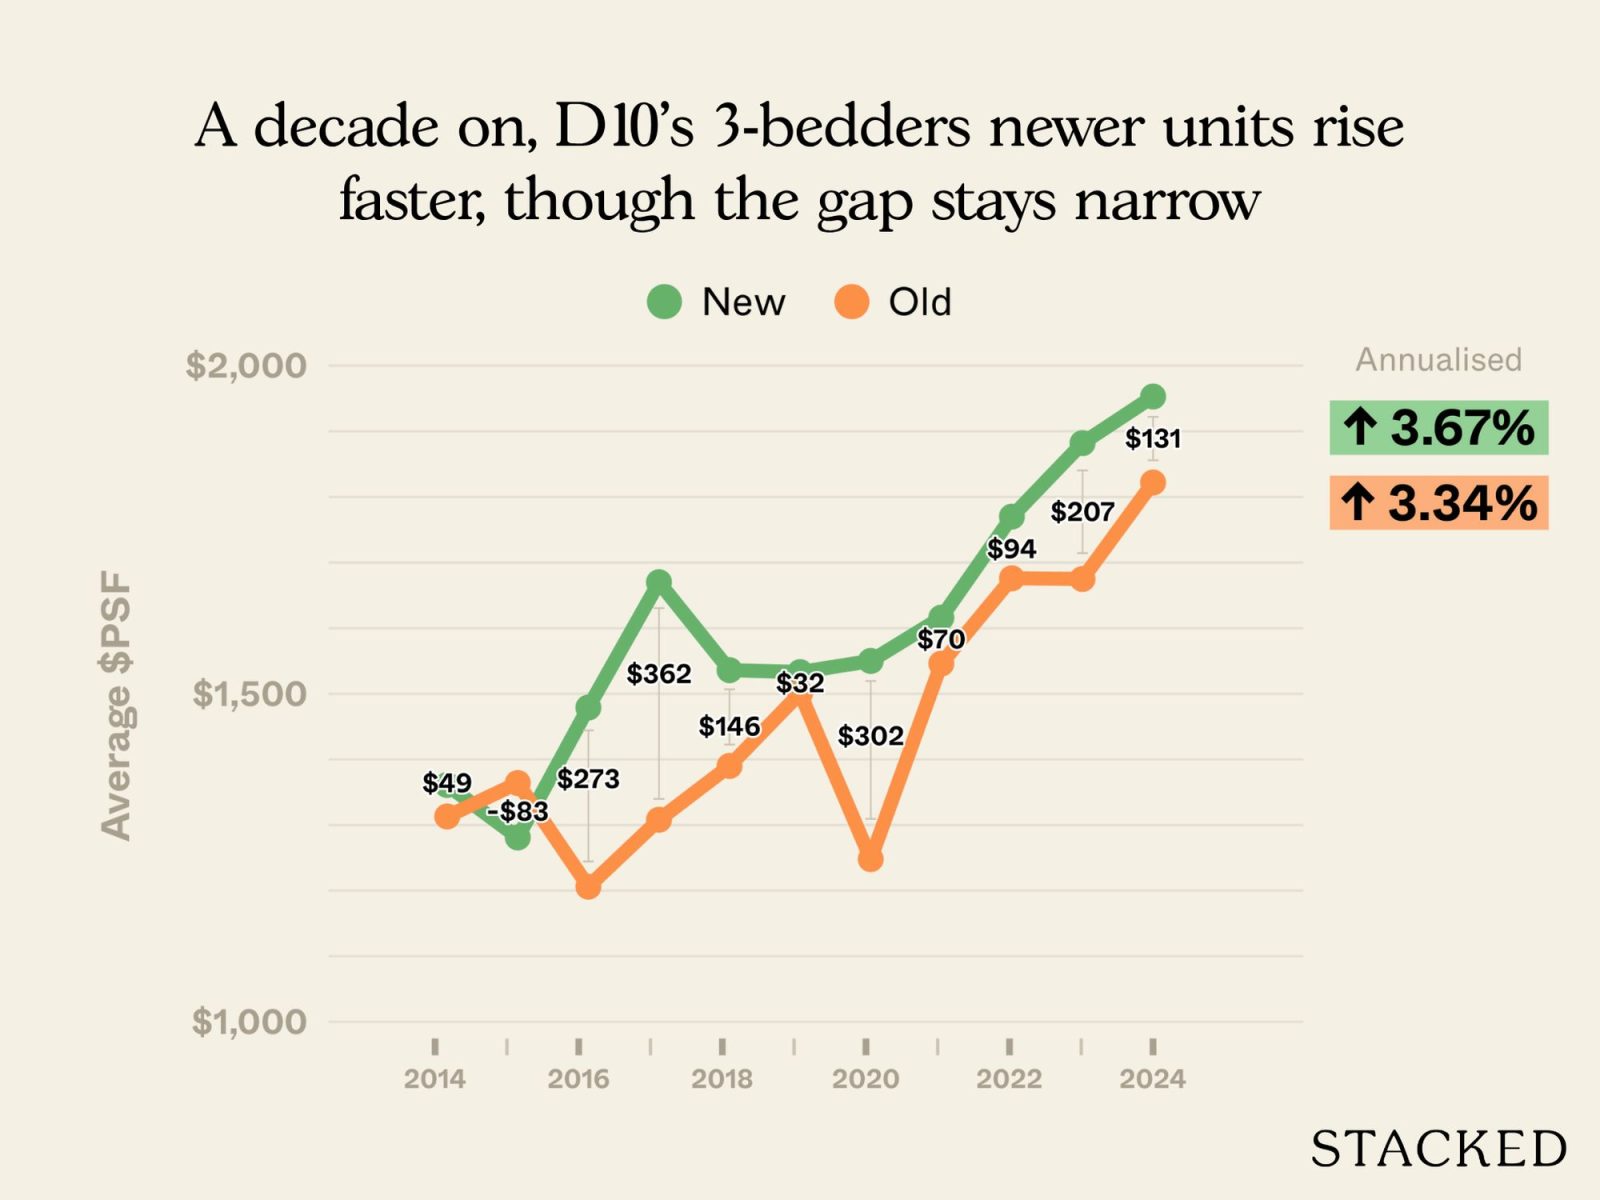
The difference between newer and older three-bedders is almost negligible in terms of percentage gains. Newer units appreciated at an annualised rate of 3.67 per cent, compared to 3.34 per cent for older units.
There are some fluctuations along the way – in 2015, for example, older three-bedders were pricier on a $PSF basis; but by 2016, newer units had pulled ahead, and the (very slim) gap has stayed in their favour since.
The question is whether this advantage also extends to overall quantum, given that older units are often much larger. Let’s take a look at their average prices.
Average price
| Year | New | Old | Difference |
| 2014 | $1,727,375 | $1,950,000 | -$222,625 |
| 2015 | $1,671,602 | $1,911,429 | -$239,826 |
| 2016 | $2,101,092 | $1,725,750 | $375,342 |
| 2017 | $2,351,950 | $1,893,636 | $458,313 |
| 2018 | $2,265,674 | $1,996,296 | $269,378 |
| 2019 | $2,357,607 | $2,113,167 | $244,441 |
| 2020 | $2,247,241 | $2,298,333 | -$51,092 |
| 2021 | $2,285,414 | $2,201,754 | $83,660 |
| 2022 | $2,482,288 | $2,375,625 | $106,663 |
| 2023 | $2,616,675 | $2,496,917 | $119,758 |
| 2024 | $2,739,553 | $2,613,636 | $125,917 |
| % increase from 2014 to 2024 | 58.60% | 34.03% |
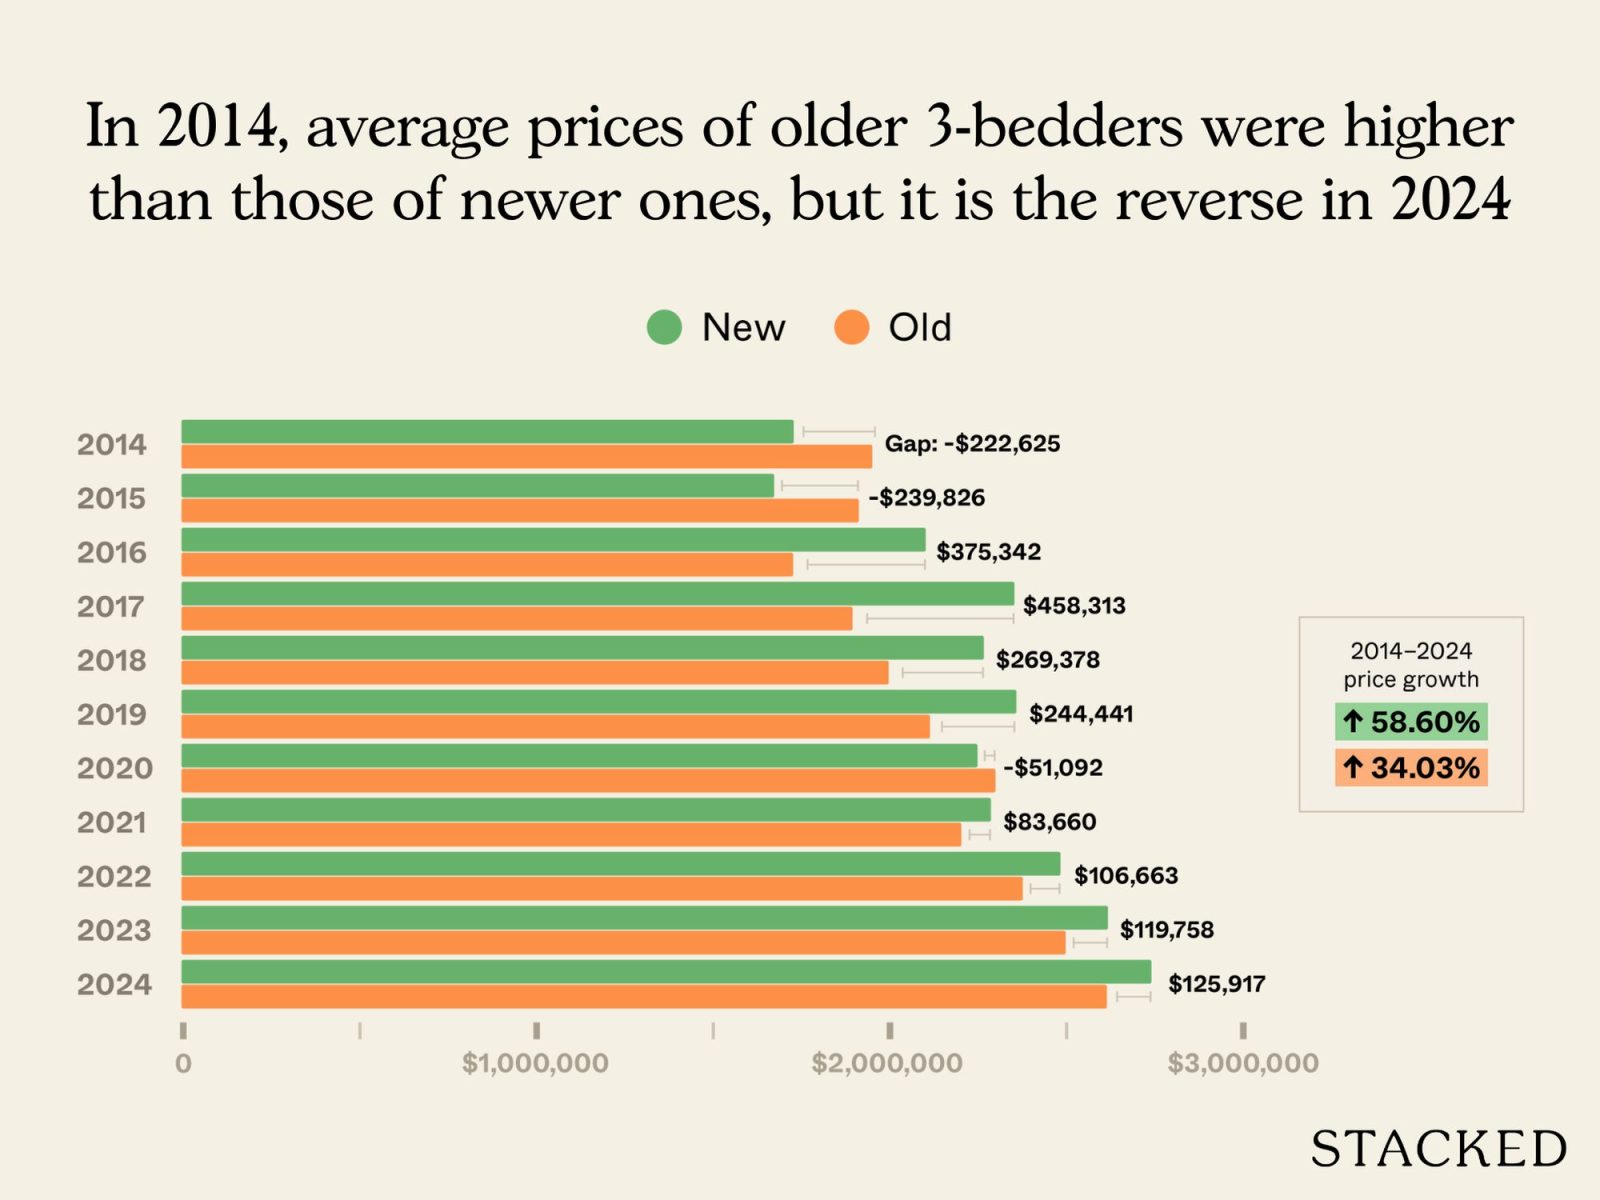
In 2014, older three-bedders actually had higher average prices than newer ones; but by 2024, the prices had largely converged. Newer three-bedders now average about $2.74 million, just a bit higher than $2.61 million for older projects.
The growth rates highlight this divergence: newer three-bedders saw average prices climb by almost 59 per cent from 2014 to 2024, while older ones rose by just 34 per cent. In short, while older three-bedders remain competitive in absolute pricing, newer projects have decisively pulled ahead in terms of appreciation.
Let’s see if this is a matter of size:
Average size (based on units transacted)
| Year | New | Old |
| 2014 | 1273 | 1507 |
| 2015 | 1311 | 1410 |
| 2016 | 1421 | 1448 |
| 2017 | 1420 | 1467 |
| 2018 | 1476 | 1457 |
| 2019 | 1513 | 1418 |
| 2020 | 1443 | 1802 |
| 2021 | 1417 | 1425 |
| 2022 | 1402 | 1417 |
| 2023 | 1391 | 1493 |
| 2024 | 1402 | 1431 |
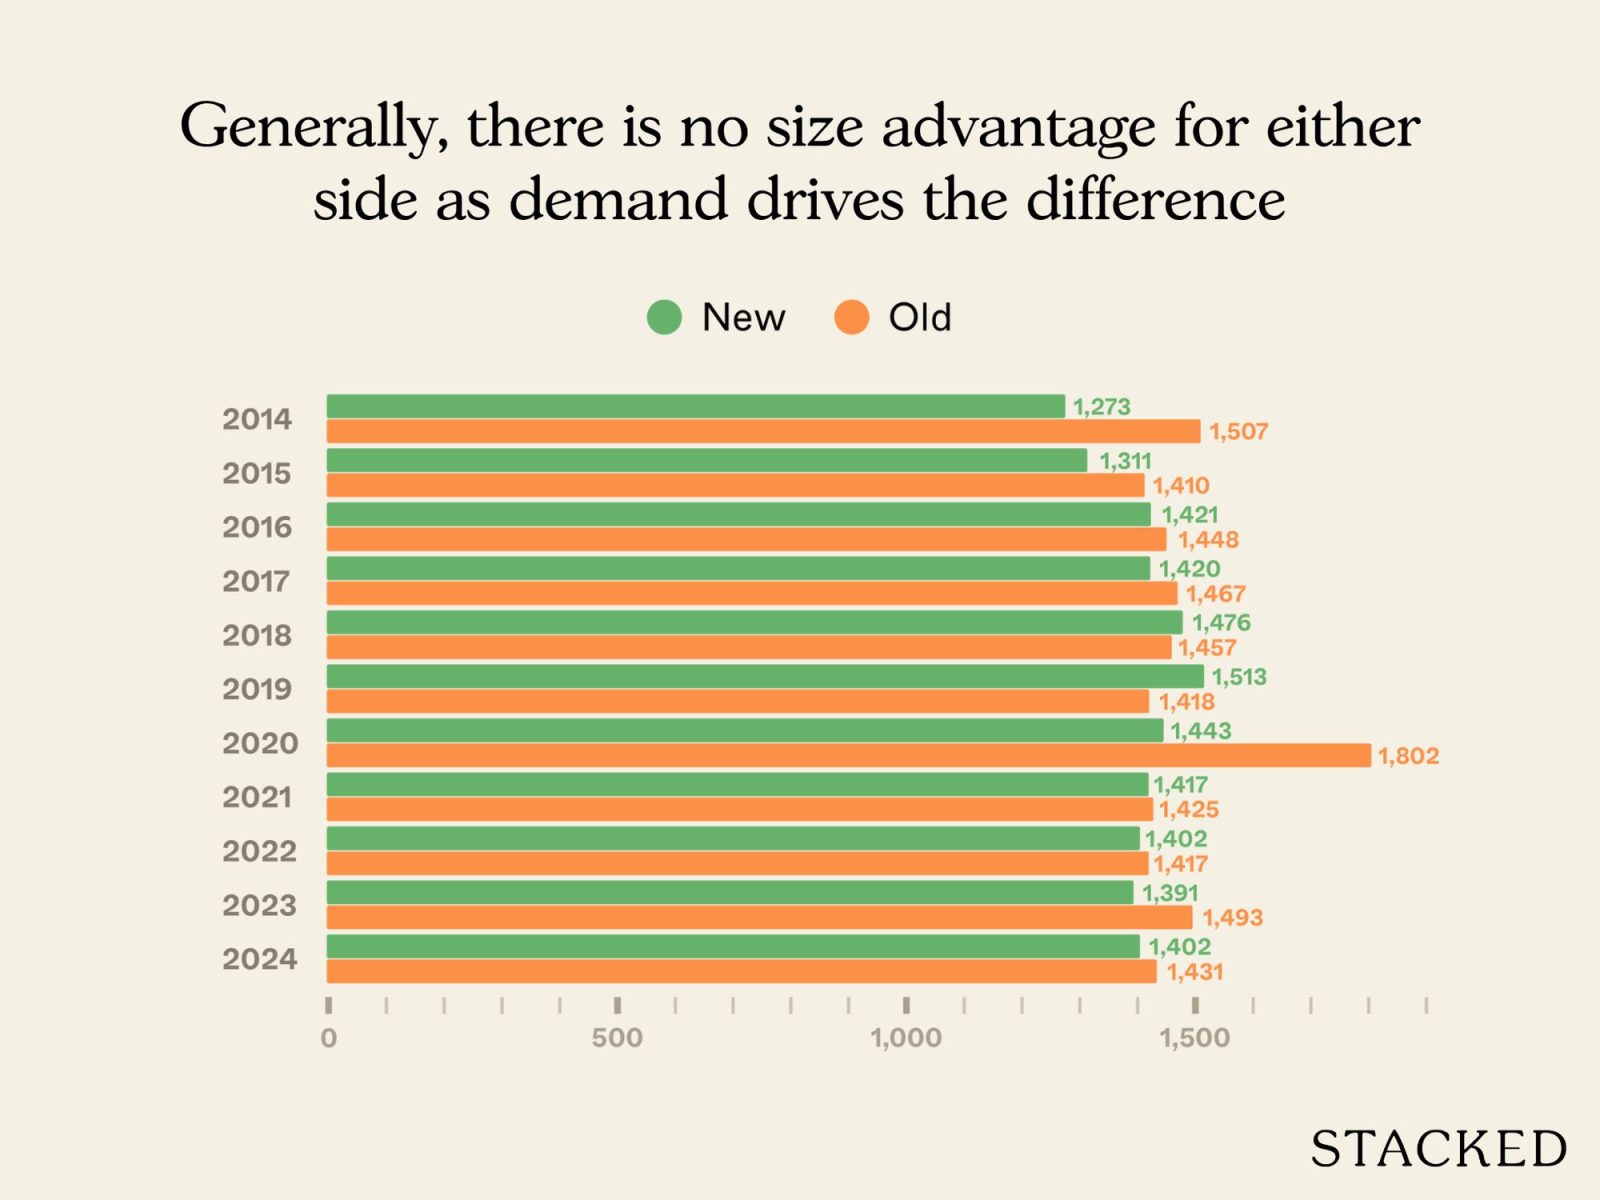
Looking at the data, that doesn’t seem to be the case. The average sizes of new and old three-bedders in D10 were comparable over the decade, typically ranging between 1,300 to 1,500 sq ft. In fact, in some years (such as 2018 and 2019), newer three-bedders were actually larger than their older counterparts.
The main outlier was 2020, when older three-bedders averaged over 1,800 sq ft due to a handful of unusually large transactions. Apart from that, however, size has been fairly consistent across both old and new.
This suggests that the stronger price performance of newer three-bedders isn’t down to size, but to demand factors like updated layouts, facilities, and, of course, longer remaining leases.
This is the number of transactions we examined:
No. of transactions
| Year | New | Old |
| 2014 | 8 | 2 |
| 2015 | 16 | 7 |
| 2016 | 49 | 4 |
| 2017 | 47 | 11 |
| 2018 | 45 | 3 |
| 2019 | 36 | 6 |
| 2020 | 29 | 6 |
| 2021 | 68 | 13 |
| 2022 | 54 | 8 |
| 2023 | 56 | 12 |
| 2024 | 44 | 11 |
Now, let’s look at the specific projects where the transactions took place
New
| Project | Average $PSF | Average price | Average size | No. of units sold | Lease start year |
| TANGLIN REGENCY | $1,741 | $2,035,000 | 1168 | 2 | 1994 |
| POLLEN & BLEU | $1,964 | $2,355,000 | 1199 | 3 | 2012 |
| THE SERENADE @ HOLLAND | $1,646 | $2,480,000 | 1507 | 1 | 2001 |
| DUCHESS CREST | $1,804 | $2,528,472 | 1405 | 4 | 1995 |
| QUINTERRA | $1,648 | $2,768,000 | 1679 | 1 | 2006 |
| MON JERVOIS | $1,871 | $2,800,000 | 1496 | 1 | 2012 |
| D’LEEDON | $1,991 | $2,808,115 | 1411 | 30 | 2010 |
| THE LOFT | $2,229 | $3,500,000 | 1567 | 2 | 1999 |
Old
| Project | Average $PSF | Average price | Average size | No. of units sold | Lease start year |
| SPRING GROVE | $1,784 | $2,588,889 | 1445 | 9 | 1991 |
| THE MERASAGA | $1,994 | $2,725,000 | 1367 | 2 | 1991 |
The average prices of older three-bedders are largely within the same range as newer counterparts. Spring Grove averages about $2.59 million, while The Merasaga comes in higher at $2.73 million; both are comparable to newer projects like Mon Jervois ($2.8 million) and D’Leedon ($2.81 million).
The Merasaga is a notable standout: its average $PSF of $1,994 is equal to or higher than most of the newer projects, despite its age.
Interestingly, four of the newer projects – Tanglin Regency, Pollen & Bleu, The Serenade @ Holland, and Duchess Crest – recorded average prices below Spring Grove, which is an older project. Admittedly, in three of these cases, unit sizes were smaller than Spring Grove’s; but in one case, the unit was larger but transacted at a lower $PSF than Spring Grove.
Overall, this reinforces the resilience of older leasehold three-bedders in D10. They’re still defying gravity and shrugging off lease decay – even outperforming similar-sized new condos on a $PSF basis in some instances.
With that in mind, let’s examine how these projects have performed over the last 10 years, the newer ones in bold for easier comparison.
| Year | TANGLIN REGENCY | POLLEN & BLEU | THE SERENADE @ HOLLAND | DUCHESS CREST | QUINTERRA | MON JERVOIS | D’LEEDON | THE LOFT | SPRING GROVE | THE MERASAGA |
| 2014 | $1,294 | $1,324 | $1,314 | $1,292 | $1,540 | $1,572 | ||||
| 2015 | $1,286 | $1,196 | $1,273 | $1,134 | $1,585 | $1,440 | $1,406 | |||
| 2016 | $1,247 | $1,161 | $1,259 | $1,584 | $1,321 | |||||
| 2017 | $1,263 | $2,078 | $1,250 | $1,132 | $2,160 | $1,521 | $1,426 | $1,361 | $1,557 | |
| 2018 | $1,380 | $1,198 | $1,320 | $1,212 | $2,161 | $1,605 | $1,524 | $1,404 | $1,688 | |
| 2019 | $1,271 | $1,161 | $1,386 | $1,314 | $1,890 | $1,561 | $1,546 | $1,572 | ||
| 2020 | $1,361 | $1,928 | $1,195 | $1,392 | $1,861 | $1,585 | $1,371 | |||
| 2021 | $1,452 | $1,858 | $1,264 | $1,524 | $1,482 | $1,731 | $1,696 | $1,846 | $1,527 | $1,770 |
| 2022 | $1,586 | $1,928 | $1,477 | $1,643 | $1,399 | $1,890 | $1,795 | $2,066 | $1,641 | $1,781 |
| 2023 | $1,695 | $2,095 | $1,546 | $1,732 | $1,638 | $1,931 | $1,899 | $2,165 | $1,731 | |
| 2024 | $1,741 | $1,964 | $1,646 | $1,804 | $1,648 | $1,871 | $1,991 | $2,229 | $1,784 | $1,994 |
| Annualised | 3.01% | 2.20% | 3.22% | 2.46% | 2.60% | 2.41% |
Since there are no transactions in certain years, we’ve focused only on projects with transactions in both 2014 and 2024.
The Merasaga’s annualised growth rate is surprisingly comparable to some of the newer projects, even if it lags behind The Loft or D’Leedon. So once again, we’re seeing better resilience against lease decay.
While rental is rarely the primary goal of larger units, such as three-bedders, let’s examine whether age has impacted them as rental assets.
| Project | Average price in 2024 | Average monthly rent (June 2024 – June 2025) | Rental yield |
| QUINTERRA | $2,768,000 | $6,475 | 2.81% |
| THE LOFT | $3,500,000 | $8,400 | 2.88% |
| THE SERENADE @ HOLLAND | $2,480,000 | $6,144 | 2.97% |
| THE MERASAGA | $2,725,000 | $6,823 | 3.00% |
| POLLEN & BLEU | $2,355,000 | $5,925 | 3.02% |
| SPRING GROVE | $2,588,889 | $6,666 | 3.09% |
| DUCHESS CREST | $2,528,472 | $6,600 | 3.13% |
| D’LEEDON | $2,808,115 | $7,397 | 3.16% |
| TANGLIN REGENCY | $2,035,000 | $5,433 | 3.20% |
| MON JERVOIS | $2,800,000 | $7,607 | 3.26% |
The yields here range from around 2.8 per cent to 3.3 per cent. We see they’re fairly tight across both older and newer projects, so there isn’t much impact from age.
Mon Jervois (3.26 per cent) and Tanglin Regency (3.20 per cent) post the highest yields, but older developments like Spring Grove (3.09 per cent) and The Merasaga (3 per cent) perform almost the same.
As with their smaller two-bedder counterparts in the earlier half of this article, D10 seems to defy the expectation that older units will be cheaper, and hence deliver better gross yields.
For landlords, this means fundamentals like upkeep, layout, and facilities matter more than age.
Now, let’s look at older versus newer four-bedders in D10
Average $PSF
| Year | New | Old | Difference |
| 2014 | $1,455 | ||
| 2015 | $1,319 | $1,387 | -$69 |
| 2016 | $1,362 | $1,088 | $274 |
| 2017 | $1,346 | $904 | $442 |
| 2018 | $1,384 | $1,439 | -$55 |
| 2019 | $1,487 | $735 | $752 |
| 2020 | $1,503 | $1,469 | $34 |
| 2021 | $1,620 | $1,193 | $427 |
| 2022 | $1,762 | $1,528 | $234 |
| 2023 | $1,854 | $1,353 | $502 |
| 2024 | $1,839 | $1,549 | $290 |
| Annualised | 3.76% | 1.23% |
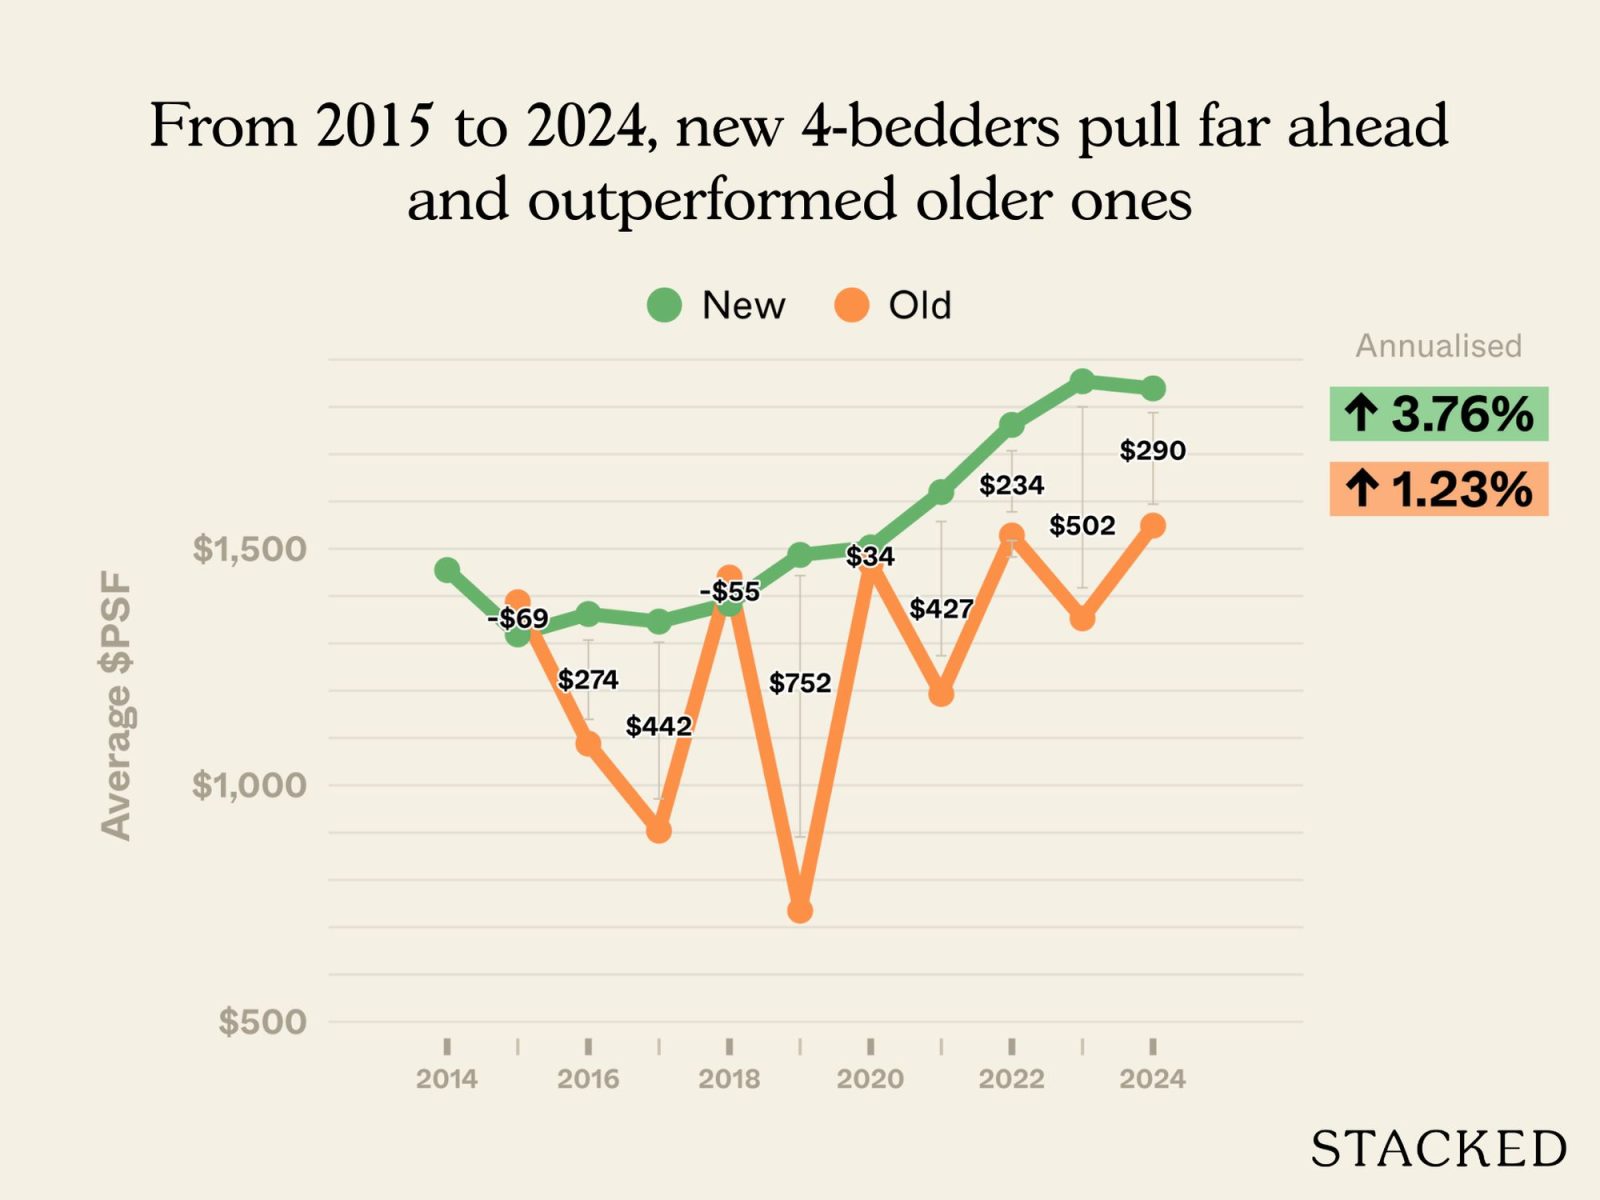
For four-bedders in D10, the gap between newer and older projects is much more pronounced.
Newer four-bedders appreciated at an annualised rate of 3.76 per cent, compared to just 1.23 per cent for older ones. The biggest divergence happened around 2016: while newer projects steadily pushed past the $1,500 psf mark, older four-bedders often remained stuck at much lower benchmarks; in some years, barely breaking $1,000 psf.
Although there were occasional years where older projects caught up (2018 and 2020 being notable examples), the general trend has been widening separation. By 2024, newer four-bedders averaged $1,839 psf, while older ones trailed at $1,549 psf – a difference of nearly $300 psf.
As always though, we need to look at the actual quantum as well:
Average price
| Year | New | Old | Difference |
| 2014 | $3,038,889 | ||
| 2015 | $2,680,833 | $3,113,000 | -$432,167 |
| 2016 | $2,945,971 | $2,660,000 | $285,971 |
| 2017 | $3,581,277 | $2,185,625 | $1,395,652 |
| 2018 | $3,697,370 | $3,481,250 | $216,120 |
| 2019 | $3,335,462 | $1,566,500 | $1,768,962 |
| 2020 | $2,989,446 | $3,615,000 | -$625,554 |
| 2021 | $3,385,285 | $2,274,925 | $1,110,360 |
| 2022 | $3,911,111 | $2,729,722 | $1,181,389 |
| 2023 | $3,970,826 | $2,925,500 | $1,045,326 |
| 2024 | $3,694,381 | $3,435,000 | $259,381 |
| % increase from 2015 to 2024 | 37.81% | 10.34% |
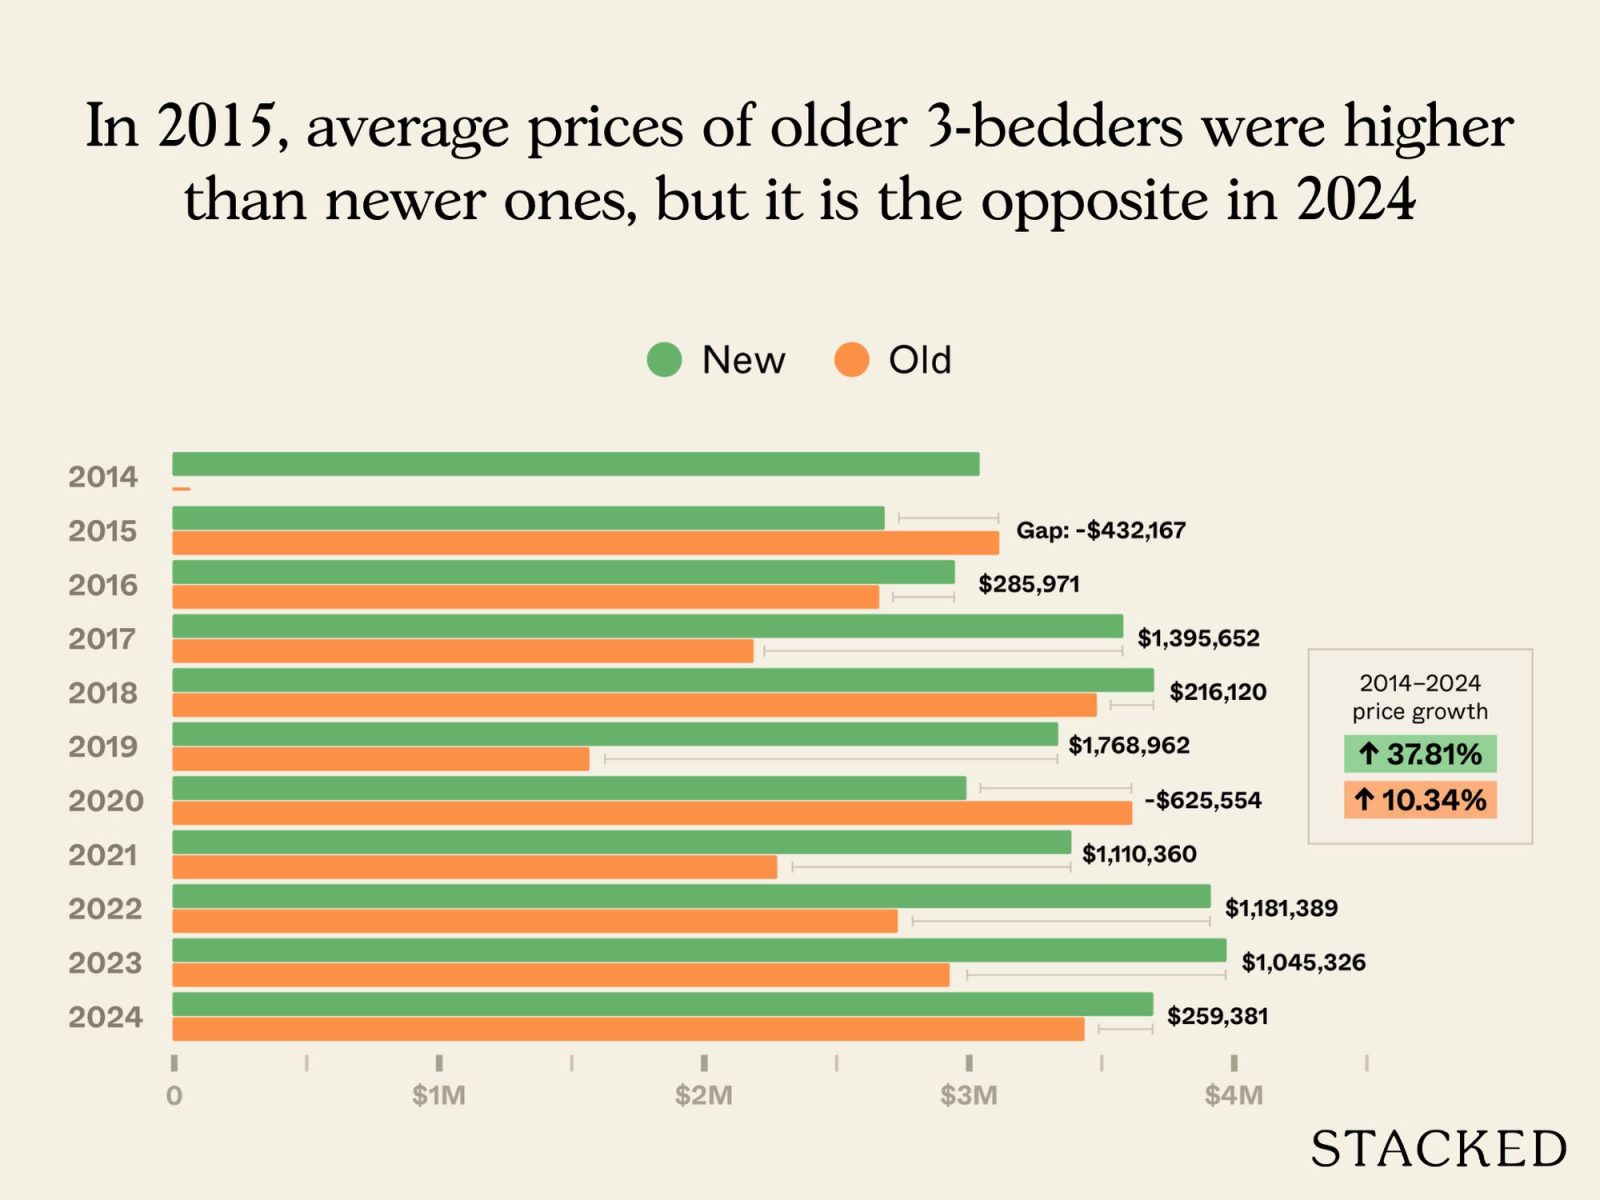
Over the past decade, older four-bedders in D10 have cost less than their newer counterparts in eight of the last ten years. Likewise, older three-bedders were briefly pricier in 2015 on average, although that’s no longer the case by 2024.
Let’s look at the sizes of the units to see if this is a matter of spaciousness:
Average size (based on units transacted)
| Year | New | Old |
| 2014 | 1994 | |
| 2015 | 1977 | 2239 |
| 2016 | 2205 | 2400 |
| 2017 | 2898 | 2354 |
| 2018 | 2698 | 2487 |
| 2019 | 2186 | 2131 |
| 2020 | 1948 | 2519 |
| 2021 | 2063 | 1959 |
| 2022 | 2280 | 1830 |
| 2023 | 2123 | 2174 |
| 2024 | 2040 | 2239 |
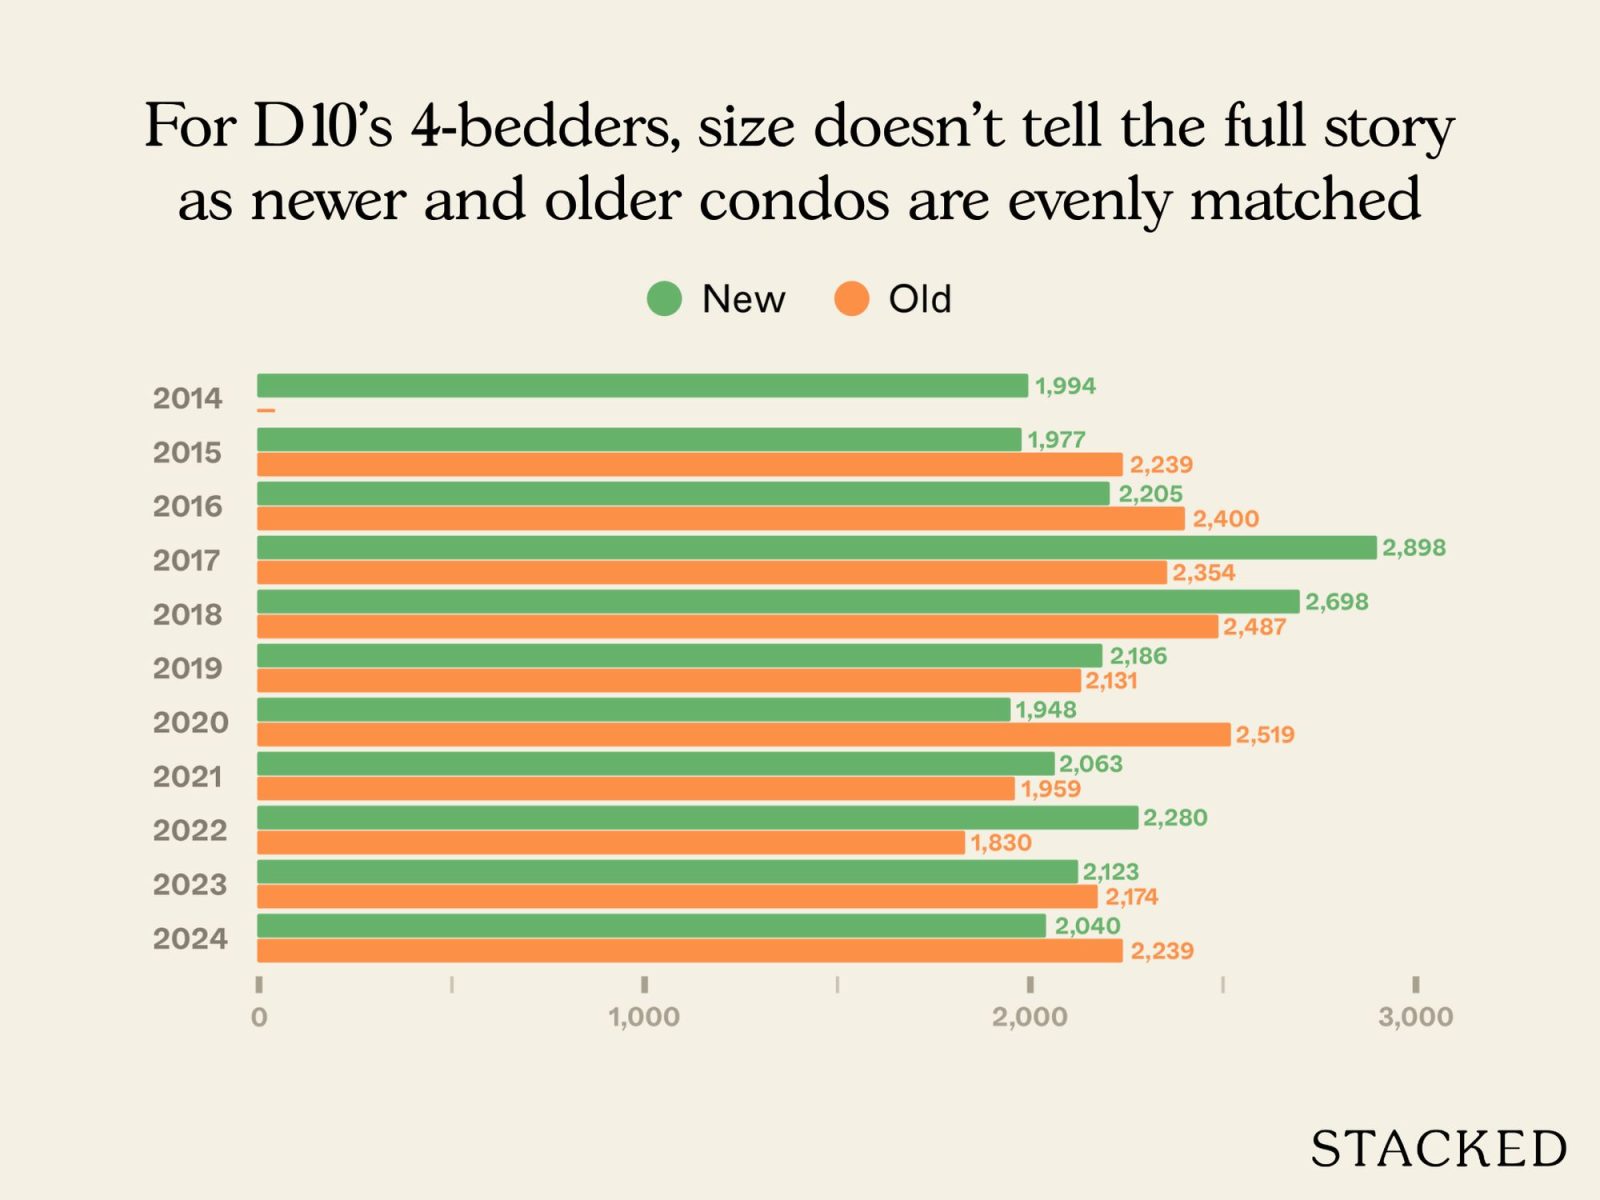
There’s no consistent pattern in unit sizes. In some years, newer four-bedders were larger than older ones (such as 2017 and 2018), while in others the reverse was true (like 2015, 2016, and 2020). By 2024, the averages were still quite close; around 2,040 sq ft for newer projects versus 2,239 sq ft for older ones.
This suggests that the price gap isn’t simply a matter of spaciousness. This is shaping up to look like buyers really do prefer newer four-bedders in D10; and that may be partly due to the buyer demographic in this district (i.e., generally more affluent buyers who are less sensitive about higher new launch pricing).
This is the number of transactions we looked at:
No. of transactions
| Year | New | Old |
| 2014 | 9 | |
| 2015 | 6 | 3 |
| 2016 | 69 | 5 |
| 2017 | 54 | 8 |
| 2018 | 29 | 4 |
| 2019 | 13 | 2 |
| 2020 | 15 | 2 |
| 2021 | 40 | 2 |
| 2022 | 27 | 4 |
| 2023 | 19 | 6 |
| 2024 | 22 | 4 |
Let’s look further into the specific projects involved
New
| Project | Average $PSF | Average price | Average size | No. of units sold | Completion year |
| THE SERENADE @ HOLLAND | $1,509 | $2,875,000 | 1905 | 2 | 2001 |
| POLLEN & BLEU | $1,917 | $2,897,500 | 1513 | 2 | 2012 |
| DUCHESS CREST | $1,703 | $3,149,500 | 1849 | 4 | 1995 |
| QUINTERRA | $1,763 | $3,150,000 | 1787 | 1 | 2006 |
| D’LEEDON | $1,905 | $3,975,282 | 2163 | 12 | 2010 |
| DRAYCOTT EIGHT | $2,169 | $6,280,000 | 2896 | 1 | 1997 |
Old
| Project | Average $PSF | Average price | Average size | No. of units sold | Completion year |
| HOLLANDSWOOD COURT | $962 | $2,050,000 | 2131 | 1 | 1975 |
| SPRING GROVE | $1,816 | $3,245,000 | 1787 | 2 | 1991 |
| ORCHARD BEL AIR | $1,600 | $5,200,000 | 3251 | 1 | 1980 |
It doesn’t appear that older four-bedders are uniformly disadvantaged.
With the exception of Hollandswood Court – which averaged just under $1,000 psf – the older projects like Spring Grove and Orchard Bel Air are still close to the prices of newer condos.
Spring Grove’s average of $3.25 million is comparable to Duchess Crest and Quinterra, for example. Orchard Bel Air reaches much higher at $5.2 million, but that’s really just due to it being a large unit (3,251 sq ft.) But again, as we pointed out above, average size differences are not large, outside of Orchard Bel Air.
This suggests that for four-bedders in D10, age alone hasn’t created a sharp divide in average price ranges. Rather, the key differentiator lies in individual project details, like layouts and facilities.
With that in mind, let’s examine how these four-bedders have actually performed over the past 10 years, highlighting the newer developments for easier comparison.
| Year | THE SERENADE @ HOLLAND | POLLEN & BLEU | DUCHESS CREST | QUINTERRA | D’LEEDON | DRAYCOTT EIGHT | HOLLANDSWOOD COURT | SPRING GROVE | ORCHARD BEL AIR |
| 2014 | $1,231 | $1,338 | $1,240 | $2,017 | |||||
| 2015 | $1,220 | $1,287 | $1,746 | $1,346 | $1,404 | ||||
| 2016 | $1,133 | $1,203 | $1,388 | $1,796 | $751 | $1,347 | $1,246 | ||
| 2017 | $2,130 | $1,209 | $1,287 | $1,118 | $1,762 | $705 | $1,321 | $1,193 | |
| 2018 | $1,219 | $1,300 | $1,324 | $1,409 | $2,061 | $1,573 | $1,306 | ||
| 2019 | $1,226 | $1,338 | $1,416 | $1,520 | $1,975 | $735 | |||
| 2020 | $1,357 | $1,363 | $1,572 | $1,917 | $1,584 | $1,354 | |||
| 2021 | $1,328 | $1,802 | $1,474 | $1,427 | $1,666 | $2,050 | $835 | $1,550 | |
| 2022 | $1,447 | $1,883 | $1,648 | $1,626 | $1,767 | $2,251 | $868 | $1,757 | |
| 2023 | $1,872 | $1,655 | $1,696 | $1,924 | $2,162 | $1,046 | $1,500 | $1,548 | |
| 2024 | $1,509 | $1,917 | $1,703 | $1,763 | $1,905 | $2,169 | $962 | $1,816 | $1,600 |
| Annualised | 3.78% | 3.56% | 2.44% | 3.38% | 1.46% |
Since there are gaps in the transaction record, we’ll look only at the 2015 to 2024 time period.
Overall, the newer projects tended to see stronger appreciation. Developments like Duchess Crest (3.78 per cent) and Pollen & Bleu (3.56 per cent) outperformed older peers such as Hollandswood Court (1.46 per cent) or Orchard Bel Air (2.44 per cent). Even D’Leedon, one of the more frequently traded projects, managed a healthy 3.38 per cent annualised gain.
That said, Spring Grove continued to show 3.38 per cent despite its age. This shows that certain older projects can still deliver competitive results in D10.
That said, the general trend leans toward newer four-bedders, which have overall better performance.
While four-bedders are rarely bought to be rented out, let’s look at available yield data for completeness:
| Project | Average price in 2024 | Average monthly rent (June 2024 – June 2025) | Rental yield |
| THE SERENADE @ HOLLAND | $2,875,000 | $6,500 | 2.71% |
| QUINTERRA | $3,150,000 | $7,800 | 2.97% |
| POLLEN & BLEU | $2,897,500 | $7,360 | 3.05% |
| DUCHESS CREST | $3,149,500 | $8,643 | 3.29% |
| DRAYCOTT EIGHT | $6,280,000 | $18,019 | 3.44% |
| SPRING GROVE | $3,245,000 | $9,459 | 3.50% |
| D’LEEDON | $3,975,282 | $12,558 | 3.79% |
| HOLLANDSWOOD COURT | $2,050,000 | $6,567 | 3.84% |
Older four-bedders in D10 edge out their newer counterparts on rental yield, which is an unsurprising result. Hollandswood Court achieved the highest yield of the group at 3.84 per cent, and is the oldest project in the set. Likewise, Spring Grove (3.50 per cent) outperformed most newer projects, including high-profile names like Quinterra and Pollen & Bleu.
Where prices between new and old four-bedders are comparable, the older units often command higher monthly rents. However, most landlords wouldn’t consider it to be a truly decisive difference.
Conclusion
For three- and four-bedders in D10, older units have generally cost less than newer ones over the past decade, with a few exceptions such as 2015 and 2020.
Newer projects are posting higher annualised growth rates in both $PSF and overall price percentage increases. That said, project-level comparisons show plenty of overlap: some older developments are still transacting at prices comparable to their newer peers, and in certain cases even outpacing them. The Merasaga stands out as a prime example, recording the highest average $PSF for two-bedders in 2024, and the second-highest for three-bedders.
Transaction volume also shows sustained buyer interest in older condos, despite their age and lower supply. This resilience suggests that lease decay is less of a stigma in D10, where location, branding, and prestige can mitigate some of the age effects.
So whilst the general picture leans in favour of newer projects, older condos in D10 are far from out of the picture. And overall, buyers in this prime district will find that leasehold status may not be as big a drawback as is often assumed.
As always though, averages only tell part of the story. For buyers and investors, meaningful comparisons need to be made project by project; and in D10, where most buyers have the purchasing power to be picky, details like layout and facilities can be even more.
For more on the Singapore property market, follow us on Stacked. If you’d like to get in touch for a more in-depth consultation, you can do so here.


