
Yanni Angelakos, Head of Investment Insights, Nasdaq Capital Access Platforms
Mike Cho, Senior Research Analyst, Nasdaq Capital Access Platforms
Tony Kristic, Senior Research Analyst, Nasdaq Capital Access Platforms
Looking to the market for signals
- A volatile cross-asset end to January underscores notable global YTD moves
- U.S. dollar hovering near 4-year lows can be helpful for risk-taking & U.S. earnings, as long as it is not signaling something more dire
- Record semiconductor vs. software relative performance wedge as Q4 2025 earnings progress
Summary
When market cross-currents and volatility ratchet up, it is important for investors to look to the markets for signals and insights that can inform the longer-term view. Investors’ attention is diverted between U.S. equity markets still hovering near their highs as Q4 earnings season picks up steam and attempting to garner signals from what have been volatile cross-asset price swings.
Attempting to parse what are fundamental drivers of price moves versus what is more speculative-driven can be very challenging. Thinking through the why in terms of moves such as the U.S. dollar’s weakness can be useful in deciphering what the markets may be telling investors, who are the beneficiaries, and how to position portfolios accordingly.
Biweekly Charts in Focus: Global cross-asset returns YTD (USDs)

Source: Bloomberg. Notes: as of February 4, 2026. Uses Goldman Sachs U.S. Cyclicals (long) vs. U.S. Defensives (short) ex-commodities.
Details
Analyzing extreme price swings are useful for historical context…but look to the basics
At their respective peaks on January 29th, gold was up 25% year-to-date while silver was higher by 63%. Following the nomination of Kevin Warsh as the new Federal Reserve Chair—who, given his past opposition to using Quantitative Easing as a regular policy tool and prior calls for a smaller Fed balance sheet, is viewed as a more moderate choice—gold had its largest one-day percentage decline since 1983 and silver had its largest daily drop on record going back to 1968. However, even after these massive sell-offs, per the Biweekly chart above, these precious metals still have solid year-to-date returns which pushed the PHLX Gold/Silver™ Index (XAU™) to an 11.7% gain in January.
Within equities, it is the ongoing outperformance of international equities, and the more cyclical / economically-sensitive and value-oriented parts of the U.S. market which continues to stand out. Global growth is expected to be moderate but remain steady (Figure 2)—aided by global fiscal stimulus, expectations of increased productivity fueled by AI, and a shifting global construct which is compelling economies to fundamentally reexamine their priorities. As a byproduct, consensus bottoms up EPS estimates are expected to broaden globally in 2026 (Figure 3). This is similar to the expected broadening of 2026 U.S. sector EPS growth estimates which we flagged in our January 9th report.
Figure 2: Slow but steady global real GDP growth expected in 2026 (%)

Source: Bloomberg consensus real GDP growth forecasts
Figure 3: A broadening of global EPS growth rates

Source: FactSet, Goldman Sachs Investment Group Research
Not to be overlooked, per Bloomberg as of February 4th, the Nasdaq-100 Index® (NDX®) forward price-to-earnings ratio is 24.2 which is now just 6% above its 10-year average and at similar levels as in early May 2025. The S&P 500’s forward price-to-earnings ratio is 21.6, 14% above the 10-year average and at similar levels as in June 2025.
The software sell-off (we touch on this more later) of the past few months accelerated this week on concerns that the latest AI tools will threaten the business models of a variety of companies. The new dynamic is that this sell-off permeated across industries impacting broader U.S. equities. Despite this near-term impact to the “P” in P/E ratios, stepping back, the “E” has continued to grow into the “P”, leaving U.S. equity market valuations within recent ranges and flat for much of the past year.
Deciphering the USD sell-off & its implications
At the center of the cross-asset moves has been the U.S. dollar (USD) as it recently approached 4-year lows. The nomination of Kevin Warsh may have put a near-term floor on the USD as while the Trump administration has called for a weaker USD, a precipitous drop could feed into inflation over time and reduce U.S. consumer purchasing power by making imported products and global commodities more expensive.
For investors, the question is why the USD is weakening. If it is on account of global investors selling USDs in pursuit of higher yields elsewhere given the divergence in global central bank rate forecasts (Figure 4), that can be favorable for risk assets. The Fed is forecast to cut up to two more times in 2026 while the markets are pricing in for other major central banks to broadly maintain their policy rates.
Figure 4: Fed is one of the few major central banks expected to cut rates in 2026

Source: Nasdaq Economic Research, FactSet, Federal Reserve. Notes: as of February 2, 2026.
Of course, USD weakness can also be a reflection of the all-too-well-known concerns of U.S. fiscal deficits, government debt levels, foreign policies, and Fed independence. Time will tell whether these bigger picture themes adversely impact the U.S. growth outlook and reverse a key tenet of the constructive fundamental outlook for U.S. equities.
If turning to market indicators for signals, Figure 5 shows that Treasury 2-year yields have drifted lower in an orderly fashion since mid-May 2025 as the markets priced in a more aggressive Fed rate cutting cycle. If there was something more nefarious at play—e.g., expectations of a drastically slowing U.S. economy—one would expect 2-year yields to move notably lower, pricing in an even more aggressive Fed rate cut path.
Figure 5: Treasury 2-year yields & the USD have dislocated

Source: Bloomberg
Looking at a real-time proxy of economic momentum, the Atlanta Fed’s GDPNow model estimate for real GDP in Q4 2025 is 4.2% and had reached 5.4% in January 2026—its highest level since September 2023. Additionally, the Citi U.S. Economic Surprise Index just hit a 2-year high. While not a long-term indicator for U.S. business cycles, it can be a dynamic signpost for the trajectory of U.S. economic readings coming in below or above consensus forecasts.
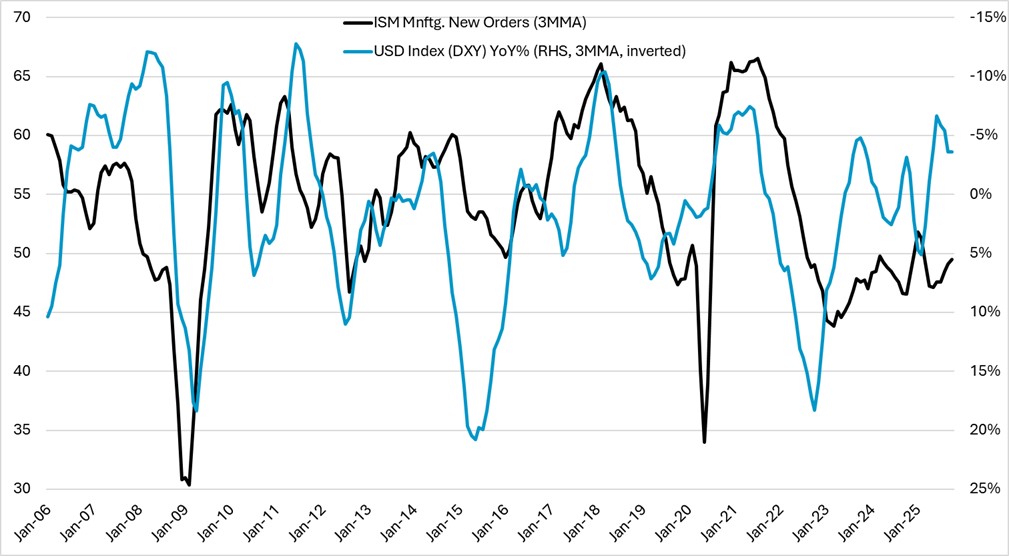
A forward-looking economic indicator, the U.S. Institute for Supply Management (ISM) Manufacturing New Orders component—a measure of new and upcoming orders placed by manufacturers within the broader manufacturer monthly confidence reading—just hit its highest level since February 2022. Figure 6 shows this gauge relative to yearly USD changes (on a three-month moving average basis to smooth out for volatility). A weaker USD coincides with higher ISM New Orders as U.S. manufacturers’ products can be more competitive in international markets.
Admittedly, the broader ISM Manufacturing index had been below 50 for most of the past year until the January 2026 report—a reading over 50 indicates survey respondents believe the industry is expanding. And although one month does not make a trend, the ISM Manufacturing index is a cyclical indicator which bears watching for economic momentum and, as a byproduct, those more economically-sensitive equities.
Figure 6: A weaker USD tends to be synonymous with improved manufacturing new orders
Source: Bloomberg. Note: monthly intervals.
Consequently, we believe that the USD’s weakness is not being solely driven by an outlook of slower U.S. growth. A recipe of resilient U.S. growth coupled with a weaker USD and ongoing accommodative financial conditions tends to be favorable for risk assets. As we’ve discussed before, the USD is an important component for financial conditions whose directionality is key for investors deciding whether to take on risk or not. Figure 7 speaks to the aforementioned outperformance of EM equities given the weaker USD. And while the negative delta for the USD may not accelerate much more given the year-over-year change of around -10% is at extreme levels, as long as the USD remains steady/does not appreciate materially from here, EM equities can still benefit.
Figure 7: A weaker USD has historically benefited EM equities

Source: Bloomberg. Note: weekly intervals.
The case for EM equities as a diversifier is not just a top-down story, though: given their notable exposures to technology industries which are at the heart of the AI ecosystem, key parts of EM are a micro play on the secular AI theme. Looking at estimated AI-related exposures in a couple of ETFs proxies:
- iShares MSCI Taiwan ETF (EWT)
- Semiconductors: ~39% (TSMC is a ~24% weight alone)
- Tech hardware and electronic equipment: ~18%
- iShares MSCI South Korea ETF (EWY)
- Tech hardware & electronic equipment: ~28%
- Semiconductors: ~24%
Not surprisingly, these EM ETFs have outperformed broader U.S. equities over the past year: as of February 4th, EWY is up by more than 121%, EWT is higher by nearly 32%, and the S&P 500 is up by 14% (per Bloomberg, in USD terms).
Micro equity trends amidst Q4 2025 earnings
From a micro perspective, a weaker USD tends to lead U.S. equity earnings revisions breadth higher (Figure 8)—i.e., an increase in the ratio of upward to downward earnings revisions. Again, a weaker USD may help those more internationally-focused companies from an earnings perspective. Technology and communication services have a combined weight of around 44% in the S&P 500 and an aggregate of 53% of the S&P 500’s 2026 estimated earnings growth (per Citi Wealth) are expected to come from these two sectors. Therefore, technology deriving 56% and communications services 49% from international markets (Figure 9) can be a key factor in this expectation of a higher earnings revisions breadth for U.S. equities.
Figure 8: A weaker USD tends to lead U.S. earnings revisions breadth
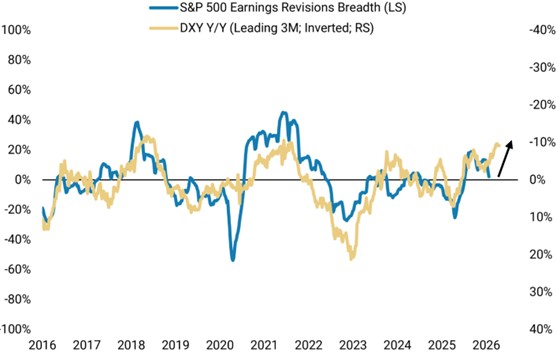
Source: Morgan Stanley. Notes: Earnings revisions breadth is the number of upward earnings revisions less the number of downward earnings revisions divided by the total number of earnings revisions.
Figure 9: % of U.S. S&P 500 sector & broader index revenues coming from outside the U.S.

Source: FactSet. Nasdaq Index Research, Franklin Templeton
Drilling down within the tech stack, investors are also closely monitoring for further signals in earnings reports amidst the massive bifurcation between semiconductor and software index price returns. Per Figure 10, the rolling 6-month return of the PHLX Semiconductor™ Index (SOX™) versus the S&P 500 Software GICS Level 3 Index hit 63.5%—outperforming by nearly +4.5 standard deviations relative to its 25-year average.
Figure 10: U.S. semis outperforming vs. U.S. software by 63.5% over last 6-months

Source: Bloomberg. Notes: as of January 30, 2026.
To wit, from our Nasdaq Index Insights colleagues regarding January 2026 Nasdaq Index performance: “Semiconductor companies continue to be the beneficiaries of AI related capital expenditures with the best performing index in the group being the Nasdaq US Smart Semiconductor™ Index (NQSSSE™) gaining 17.8%. The SOX was also strong, up by 12.9%. By contrast, software companies including cloud and cybersecurity companies are increasingly facing competition from AI products that threaten to make software as a service (SaaS) more commoditized. The BVP Nasdaq Emerging Cloud™ Index (EMCLOUD™) was the worst performer, posting a loss of 13.9% and the ICE CTA Cloud Computing™ Index (CPQ™) was down 8.4%. The Nasdaq CTA Cybersecurity™ Index (NQCYBR™) lost 3.3% for the month.” Based purely on relative performance, the markets may have hit peak optimism in terms of hardware versus software exposures as SOX has never previously outperformed the software gauge after outperforming by at least +2 standard deviations on a 6-month rolling basis.
Turning to Q4 earnings trends, for the latest Nasdaq-100 Q4 earnings developments, please click here. In terms of S&P 500 Q4 earnings trends, here are the most recent observations per FactSet data as of January 30th:
- 75% of companies are beating EPS estimates vs. the 5-year average of 78%.
- 65% of companies are beating revenue estimates vs. the 5-year average of 70%.
- Despite the proportion of companies beating EPS estimates being slightly above the 5-year average, the aggregate average earnings beats are +9.1% above expectations. This is now above the 1-year average of +7.4% and the 5-year average of +7.7%.
- Regardless, the markets are not rewarding EPS upward surprises by as much: companies beating EPS estimates are experiencing an average price increase of +0.6% from the two days prior to the two days after their earnings release, slightly below the 5-year average of +0.9%.
Disclaimer:
Nasdaq®, Nasdaq-100®, and Nasdaq Stock Market® are registered trademarks of Nasdaq, Inc. The information contained above is provided for informational and educational purposes only, and nothing contained herein should be construed as investment advice, either on behalf of a particular security or an overall investment strategy. Neither Nasdaq, Inc. nor any of its affiliates makes any recommendation to buy or sell any security or any representation about the financial condition of any company. Statements regarding Nasdaq-listed companies or Nasdaq proprietary indexes are not guarantees of future performance. Actual results may differ materially from those expressed or implied. Past performance is not indicative of future results. Investors should undertake their own due diligence and carefully evaluate companies before investing. ADVICE FROM A SECURITIES PROFESSIONAL IS STRONGLY ADVISED.
© 2026. Nasdaq, Inc. All Rights Reserved.