
In this Stacked Pro breakdown:
- We analysed how prices moved at nearby condos before and after Sengkang Grand Residences was launched, to test if integrated developments actually benefit surrounding projects
- Two neighbouring condos saw their price gap with Sengkang Grand narrow by over 40% — suggesting proximity may offer an unexpected upside
- But not all condos nearby performed equally, and the data reveals a more nuanced pattern than most assume
Already a subscriber? Log in here.
Singaporeans seem to be of two minds about integrated projects. One half believes a nearby integrated project will raise property values, or at least improve demand. Most people want a mall and an MRT station nearby, right? On the other hand, some homeowners dread the thought of huge crowds and congestion, drawn by said mall. And sometimes, there’s the lingering suspicion that surrounding projects may become less attractive, by way of contrast. Has the new integrated project lifted surrounding condo prices—or made them look outdated? We tried to find a clear conclusion by looking at the price movements:
Why Sengkang Grand Residences is a good way to explore this
It was difficult to find a good point of comparison to test the theory. We needed an example where the integrated project would have had time to show any effects, where there was sufficient transaction volume, and where there were regular condos nearby to compare results.
Sengkang Grand Residences is a 680-unit leasehold integrated project, completed in 2023. Its commercial component is Sengkang Grand Mall, a three-storey retail space that also includes a hawker centre, childcare facilities, a community club, and more.
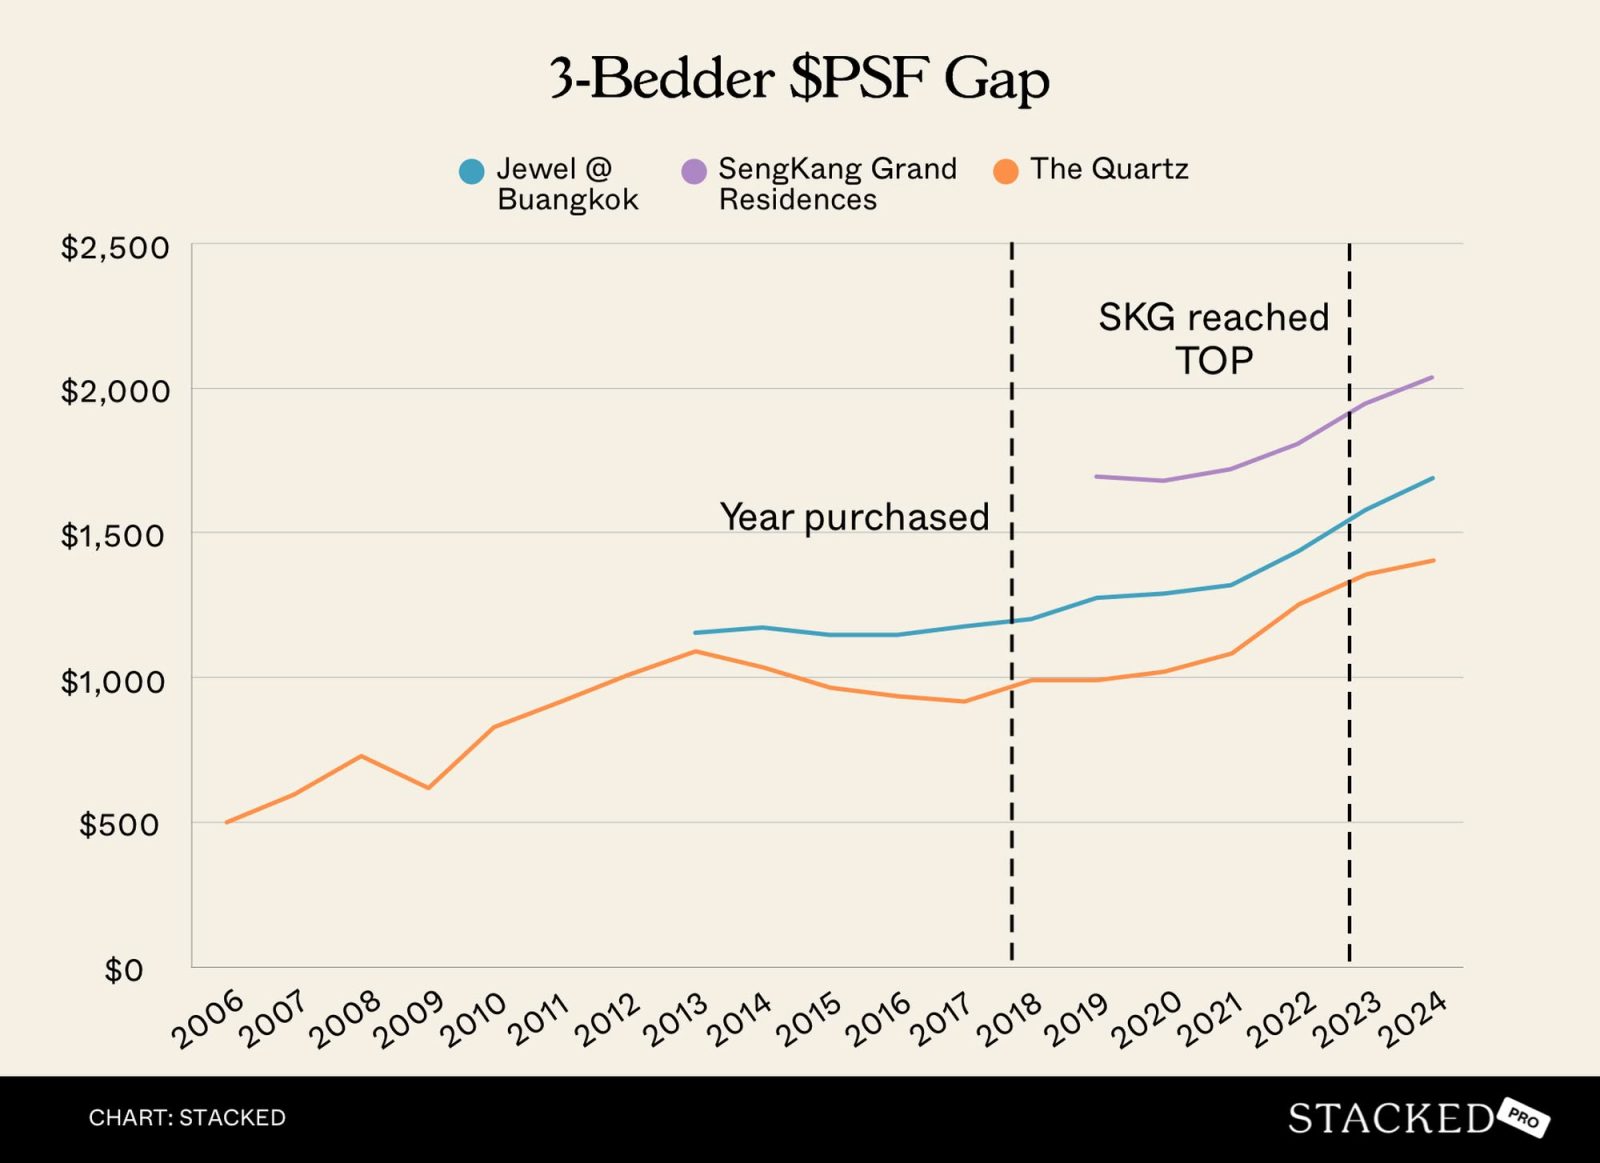
To see if it had a positive effect on nearby condos, we examined two of Sengkang Grand’s neighbours: the first is The Quartz, a leasehold 625-unit condo built in 2009. The second is Jewel @ Buangkok, a leasehold 616-unit condo built more recently in 2016.
We’ve focused specifically on three-bedroom units. This avoids distortions from one- and two-bedroom units that are often bought for investment or rental yield strategies. Plus, The Quartz doesn’t have units smaller than three-bedders, so this comparison approach makes more sense.
Now let’s compare the price trends of Sengkang Grand with its two neighbouring condos.
Here’s a look at the average price per square foot (PSF) over the years, including new sales, subsales, and resales:
| Year | JEWEL @ BUANGKOK | SENGKANG GRAND RESIDENCES | THE QUARTZ | |
| 2006 | $501 | |||
| 2007 | $594 | |||
| 2008 | $727 | |||
| 2009 | $618 | |||
| 2010 | $827 | |||
| 2011 | $917 | |||
| 2012 | $1,009 | |||
| 2013 | $1,152 | $1,090 | ||
| 2014 | $1,168 | $1,034 | ||
| 2015 | $1,143 | $963 | ||
| 2016 | $1,143 | $935 | ||
| 2017 | $1,175 | $916 | ||
| 2018 | $1,200 | $991 | Year Plot Was Purchased | |
| 2019 | $1,273 | $1,695 | $988 | |
| 2020 | $1,289 | $1,679 | $1,018 | |
| 2021 | $1,319 | $1,719 | $1,081 | |
| 2022 | $1,436 | $1,808 | $1,252 | |
| 2023 | $1,580 | $1,946 | $1,353 | Year Sengkang Grand TOP |
| 2024 | $1,690 | $2,038 | $1,402 |
Prices did go up after Sengkang Grand’s launch, but that alone isn’t conclusive. Instead, there are three points of interest here:
- 2017 to 2019 (when the plot for Sengkang Grand was purchased)
- 2019 to 2024 (from construction to completion of Sengkang Grand)
- 2017 to 2024 (price movements compared to the overall market, to gauge the effect of Sengkang Grand)
A quick explainer for those unfamiliar with why we start looking at prices before Sengkang Grand was even built: property prices can start rising before the completion of a nearby project or amenity. Sellers may have anticipated Sengkang Grand’s mall, for example, and adjusted their asking prices accordingly.
But it leaves the question of how much prices rose in anticipation of the project versus after its completion. The same principle applies when an MRT station or other amenity is announced.
So here’s a look at all three periods:
| Period | Jewel @ Buangkok | Sengkang Grand residences | The Quartz | Property Price Index |
| 2017 – 2019 | 8.3% | NA | 7.9% | 11.15% |
| 2019 – 2024 | 32.7% | 20.3% | 41.9% | 32.44% |
| 2017 – 2024 | 43.8% | NA | 53.1% | 47.20% |
Interestingly, Sengkang Grand Residences saw the least appreciation from 2019 to 2024. During this period, its three-bedder prices rose by about 20%, underperforming the overall property market.
This is likely because, as a new launch, Sengkang Grand started at a higher price point than The Quartz and Jewel @ Buangkok, leaving less room for rapid appreciation.

Meanwhile, Jewel @ Buangkok and The Quartz saw appreciation broadly in line with the wider market. The Quartz, in particular, may have gained an edge due to its larger three-bedroom units, which exceeded 1,200 sq. ft. — a sought-after size during the Covid period.
Let’s see how the premium gap between Sengkang Grand and its neighbours evolved. This is based on the percentage difference in PSF prices for three-bedder units.
(This is based on the percentage difference in price psf, and on the three-bedder units between the projects)
| Year | JEWEL @ BUANGKOK | THE QUARTZ |
| 2019 | 33.16% | 71.5% |
| 2020 | 30.24% | 64.9% |
| 2021 | 30.34% | 59.0% |
| 2022 | 25.95% | 44.5% |
| 2023 | 23.13% | 43.8% |
| 2024 | 20.64% | 45.3% |
| % Change | 62% | 63% |
The higher the percentage, the bigger the price gap with Sengkang Grand, and vice versa:

By 2024, the gap had narrowed significantly, suggesting that Jewel @ Buangkok and The Quartz may have benefited from the amenities of Sengkang Grand Residences. The consistent pattern of narrowing also implies that this is more than just a short-term fluctuation.
But this isn’t a guarantee that integrated projects help surrounding condos
The problem is that The Quartz and Jewel @ Buangkok also increased in price, alongside the PPI. While there are some fluctuations, we can’t guarantee it’s related to Sengkang Grand (it may just be issues specific to those two condos, which aren’t clearly visible).
This does raise the possibility that, maybe, The Quartz and Jewel @ Buangkok could have seen the same appreciation, even if Sengkang Grand hadn’t arrived to add a mall next door.
But to see if the uplift is truly linked to proximity and not just general market movement, we compared two other condos located further from Sengkang Grand Residences.
If an integrated development really does nothing to help its surrounding condos, then we should see these examples go up in price just as well as The Quartz and Jewel @ Buangkok, even though they’re too far to enjoy Sengkang Grand Mall and its amenities.
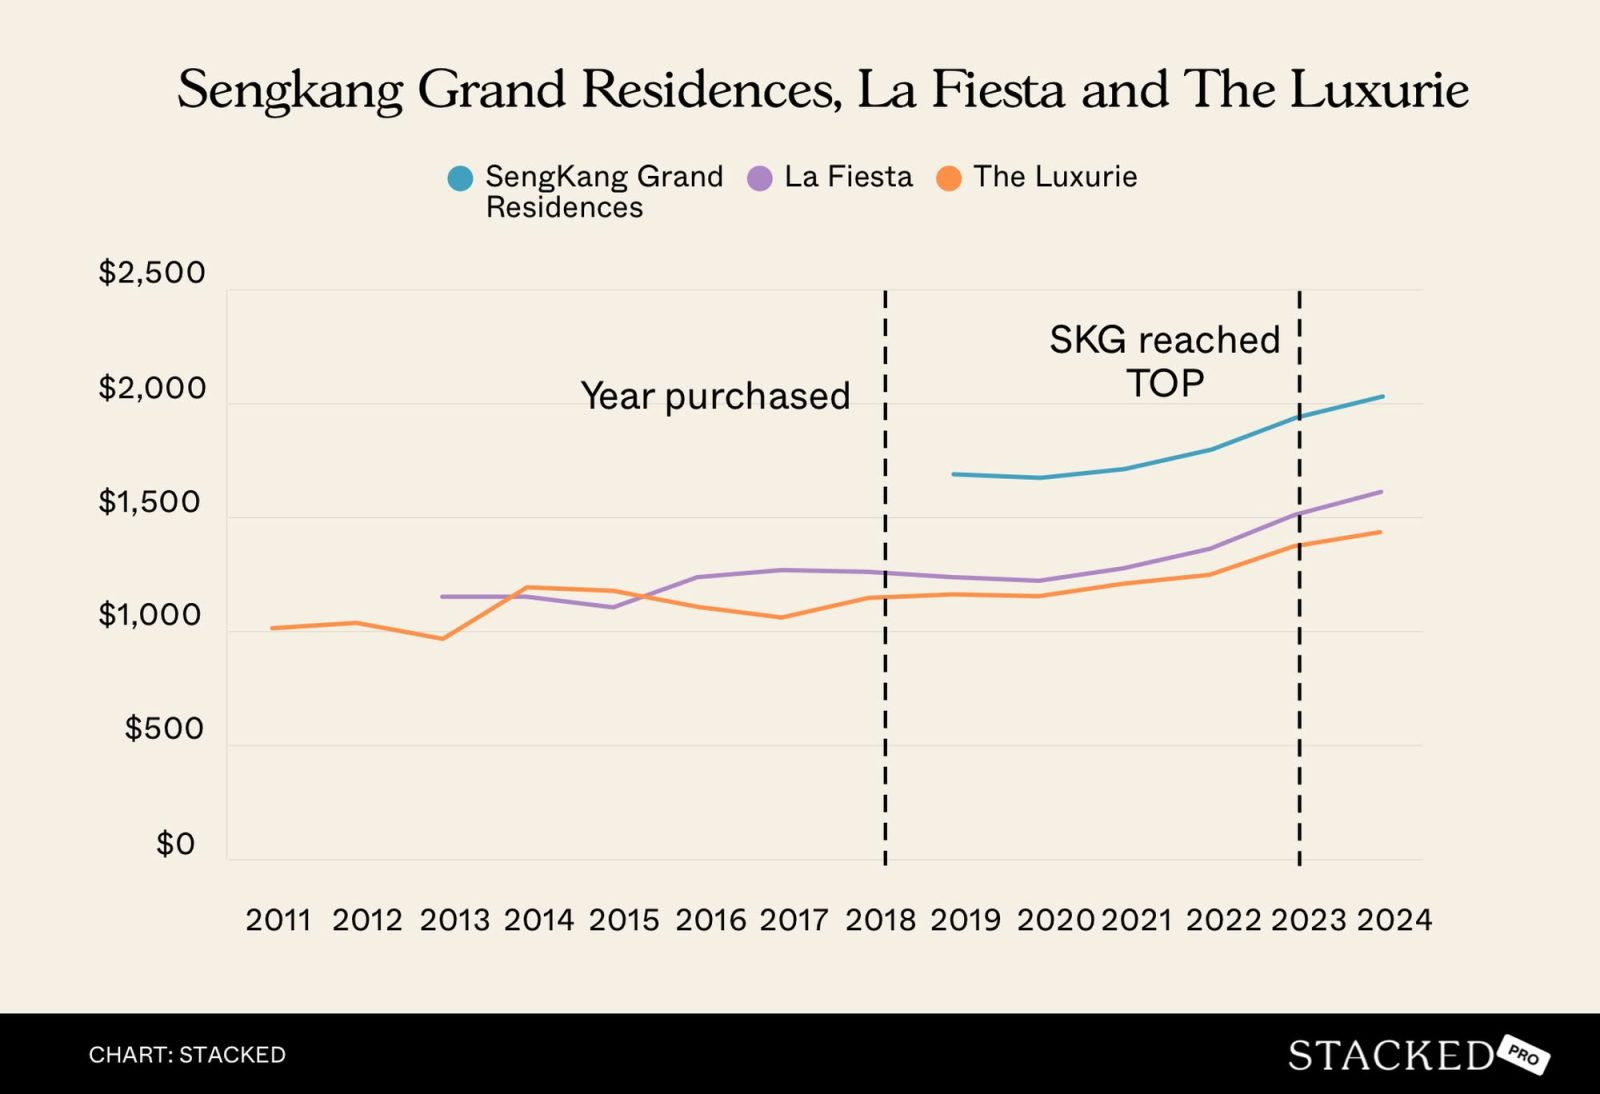
For this, we’ll use two examples:
The first is La Fiesta. This is a leasehold 810-unit condo, built in 2016. The second is The Luxurie, a leasehold 622-unit condo built in 2015. Both of these condos are also in Sengkang, but they’re a decent distance away from Sengkang Grand (further than a 10-minute walk), which makes them appropriate for our comparison. La Fiesta and The Luxurie are also close to Sengkang MRT and the Compass One mall, which may help to mute the effect of having an integrated mall more than 10 minutes away.
As before, we compared the family-sized three-bedder units (but we excluded units above 1,300 sq. ft., as these are usually considered larger than three-bedders and the much lower price PSF would skew the data).
| Year | SENGKANG GRAND RESIDENCES | LA FIESTA | THE LUXURIE | |
| 2011 | $1,010 | |||
| 2012 | $1,032 | |||
| 2013 | $1,146 | $966 | ||
| 2014 | $1,144 | $1,189 | ||
| 2015 | $1,098 | $1,178 | ||
| 2016 | $1,232 | $1,101 | ||
| 2017 | $1,264 | $1,060 | ||
| 2018 | $1,256 | $1,140 | Year Plot Was Purchased | |
| 2019 | $1,695 | $1,233 | $1,156 | |
| 2020 | $1,679 | $1,214 | $1,152 | |
| 2021 | $1,719 | $1,269 | $1,207 | |
| 2022 | $1,808 | $1,356 | $1,241 | |
| 2023 | $1,946 | $1,501 | $1,370 | Year Sengkang Grand TOP |
| 2024 | $2,038 | $1,606 | $1,434 |
| Period | Sengkang Grand residences | La Fiesta | The Luxurie | Property Price Index |
| 2017 – 2019 | NA | -2.4% | 9.1% | 11.15% |
| 2019 – 2024 | 20.3% | 30.3% | 24.0% | 32.44% |
| 2017 – 2024 | NA | 27.1% | 35.3% | 47.20% |
Again, due to the higher price point of Sengkang Grand, it has seen slower appreciation than La Fiesta and The Luxurie. However, note that Jewel @ Buangkok and The Quartz, which are closer to Sengkang Grand, saw better appreciation than The Luxurie and La Fiesta. To some degree this can be expected: higher launch prices leave less room for gains.
The key question is the impact that Sengkang Grand had on the surrounding condos. To explore this, we compared its performance against four nearby condos:Jewel @ Buangko, The Quartz, La Fiesta, and The Luxurie.
| Here’s a look at their $PSF gap | ||
| Year | La Fiesta | The Luxurie |
| 2019 | 37.45% | 46.6% |
| 2020 | 38.34% | 45.7% |
| 2021 | 35.50% | 42.5% |
| 2022 | 33.37% | 45.7% |
| 2023 | 29.62% | 42.1% |
| 2024 | 26.89% | 42.1% |
The price gap did narrow for both of them, but The Luxurie saw a relatively small movement. It was La Fiesta that better narrowed the gap with Sengkang Grand:

This does mean that our two examples closer to Sengkang Grand performed better. The premium gap for Jewel and The Quartz narrowed by about 40 per cent, while it only narrowed by 30 per cent for La Fiesta, and 10 per cent for The Luxurie.
So going by this comparison, it does seem that Sengkang Grand brought some advantage to its closer counterparts. This is due to a halo effect, where a new, high-end development (like Sengkang Grand) heightens buyer impressions of an area, and elevates the value of surrounding properties; even if those properties were broadly unchanged.
While we did find a correlation in this case, it’s not an across-the-board guarantee
While there’s a correlation in this case, it’s hard to isolate Sengkang Grand’s influence entirely. Condo prices can shift based on factors like supply, age, and external infrastructure improvements.
For instance, some speculate that Sceneca Residence in Tanah Merah may have a stronger positive impact than Woodleigh Residences. The logic is that Tanah Merah currently lacks malls and eateries, making Sceneca’s retail component more impactful. Woodleigh, on the other hand, is near NEX Megamall, which might diminish its added value.
Ultimately, it seems that integrated developments can lift surrounding condo values, as seen with Sengkang Grand. However, the extent of this influence varies with location and existing amenities.
One thing is certain, though: having a mall, supermarket, and food court next door is always a strong selling point. While it may not guarantee a price premium, it definitely makes your listing more attractive.
When Proximity Pays Off (And When It Doesn’t)
Integrated developments have long been viewed as catalysts for price growth — and in some cases, that holds true. Our analysis of Sengkang Grand Residences and its surrounding condos suggests that proximity to a major integrated project can lead to meaningful price movement, particularly when it adds amenities that weren’t previously available.
But the data also shows it’s not a guaranteed outcome. Some nearby condos saw a narrowing of the price gap, while others further away appreciated just as much — or more — due to factors like unit size, buyer demand during specific market cycles, and their own proximity to MRT stations or malls.
This highlights a key truth about property in Singapore: the impact of a new launch or development isn’t universal — it’s contextual. And relying on general assumptions without understanding what truly drives value can lead to costly missteps, whether you’re buying or selling.
At Stacked, we combine transaction-backed insight with detailed on-the-ground research to help you filter through the noise. We’ve worked with over 300 clients to uncover undervalued opportunities, assess neighbourhood potential, and time their moves with confidence.
If you’re planning to make a property decision in the coming months and want a clearer picture of how surrounding developments might affect your options, let’s have a chat.


