It is hard to get excited after looking at Chemed’s (NYSE:CHE) recent performance, when its stock has declined 2.8% over the past three months. However, stock prices are usually driven by a company’s financials over the long term, which in this case look pretty respectable. In this article, we decided to focus on Chemed’s ROE.
ROE or return on equity is a useful tool to assess how effectively a company can generate returns on the investment it received from its shareholders. In other words, it is a profitability ratio which measures the rate of return on the capital provided by the company’s shareholders.
How To Calculate Return On Equity?
Return on equity can be calculated by using the formula:
Return on Equity = Net Profit (from continuing operations) ÷ Shareholders’ Equity
So, based on the above formula, the ROE for Chemed is:
26% = US$309m ÷ US$1.2b (Based on the trailing twelve months to March 2025).
The ‘return’ refers to a company’s earnings over the last year. That means that for every $1 worth of shareholders’ equity, the company generated $0.26 in profit.
Check out our latest analysis for Chemed
Why Is ROE Important For Earnings Growth?
So far, we’ve learned that ROE is a measure of a company’s profitability. We now need to evaluate how much profit the company reinvests or “retains” for future growth which then gives us an idea about the growth potential of the company. Assuming all else is equal, companies that have both a higher return on equity and higher profit retention are usually the ones that have a higher growth rate when compared to companies that don’t have the same features.
A Side By Side comparison of Chemed’s Earnings Growth And 26% ROE
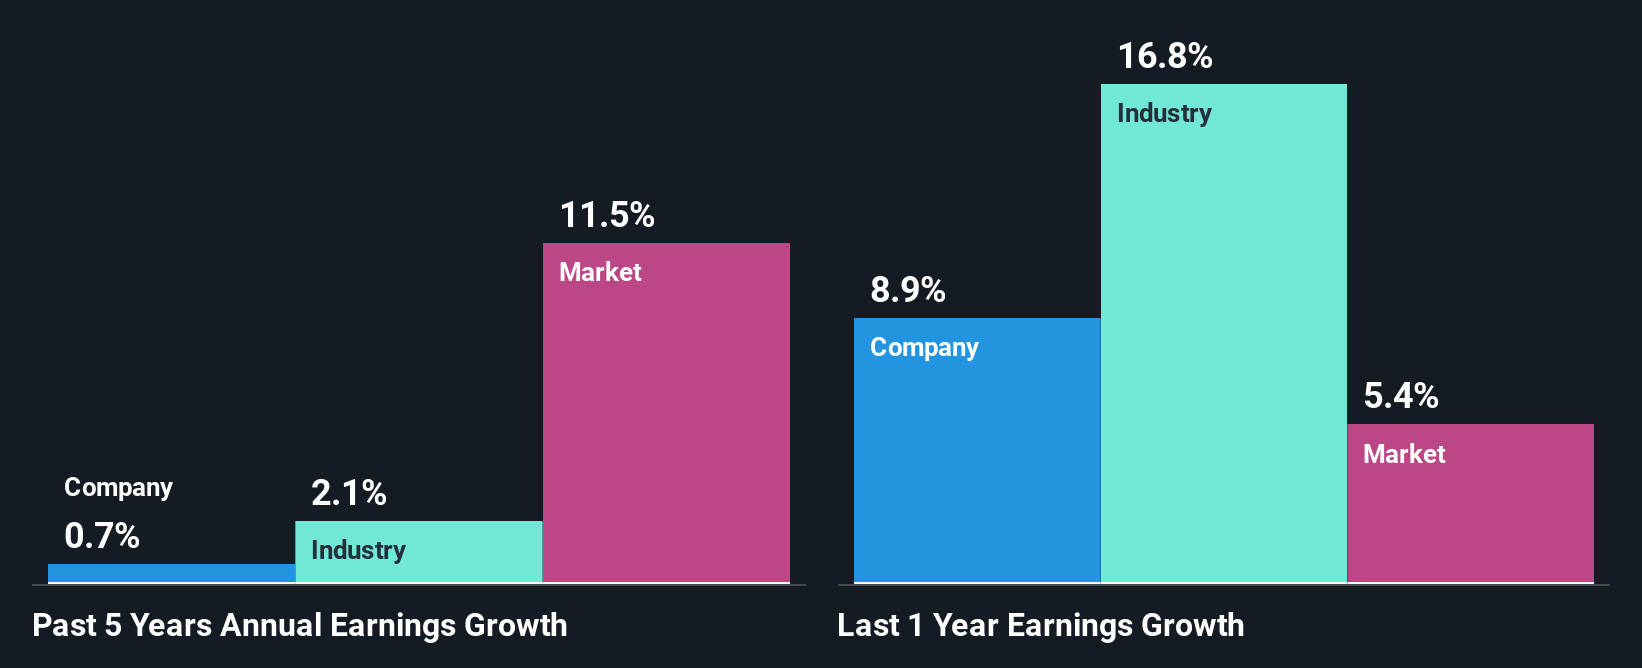
Firstly, we acknowledge that Chemed has a significantly high ROE. Additionally, the company’s ROE is higher compared to the industry average of 12% which is quite remarkable. Despite this, Chemed’s five year net income growth was quite flat over the past five years. So, there could be some other aspects that could potentially be preventing the company from growing. Such as, the company pays out a huge portion of its earnings as dividends, or is faced with competitive pressures.
Next, on comparing with the industry net income growth, we found that Chemed’s reported growth was lower than the industry growth of 2.1% over the last few years, which is not something we like to see.
The basis for attaching value to a company is, to a great extent, tied to its earnings growth. It’s important for an investor to know whether the market has priced in the company’s expected earnings growth (or decline). This then helps them determine if the stock is placed for a bright or bleak future. Has the market priced in the future outlook for CHE? You can find out in our latest intrinsic value infographic research report.
Is Chemed Making Efficient Use Of Its Profits?
Chemed’s low three-year median payout ratio of 8.6%, (meaning the company retains91% of profits) should mean that the company is retaining most of its earnings and consequently, should see higher growth than it has reported.
Moreover, Chemed has been paying dividends for at least ten years or more suggesting that management must have perceived that the shareholders prefer dividends over earnings growth.

Conclusion
In total, it does look like Chemed has some positive aspects to its business. However, given the high ROE and high profit retention, we would expect the company to be delivering strong earnings growth, but that isn’t the case here. This suggests that there might be some external threat to the business, that’s hampering its growth. Having said that, looking at the current analyst estimates, we found that the company’s earnings are expected to gain momentum. To know more about the company’s future earnings growth forecasts take a look at this free report on analyst forecasts for the company to find out more.
New: AI Stock Screener & Alerts
Our new AI Stock Screener scans the market every day to uncover opportunities.
• Dividend Powerhouses (3%+ Yield)
• Undervalued Small Caps with Insider Buying
• High growth Tech and AI Companies
Or build your own from over 50 metrics.
Have feedback on this article? Concerned about the content? Get in touch with us directly. Alternatively, email editorial-team (at) simplywallst.com.
This article by Simply Wall St is general in nature. We provide commentary based on historical data and analyst forecasts only using an unbiased methodology and our articles are not intended to be financial advice. It does not constitute a recommendation to buy or sell any stock, and does not take account of your objectives, or your financial situation. We aim to bring you long-term focused analysis driven by fundamental data. Note that our analysis may not factor in the latest price-sensitive company announcements or qualitative material. Simply Wall St has no position in any stocks mentioned.