District 15 has always been a favourite for families. From Meyer Road’s ultra-exclusive offerings to the lifestyle hub of Katong, you’ll find some of Singapore’s most in-demand private condos, and some built at a time when a three-bedder could rival a four or even five-bedder in size today.
Older projects often come with sprawling layouts, full-sized yards, and sizeable bedrooms – features that developers have shaved down in modern condos to keep the overall quantum palatable. At the same time, newer three- and four-bedders bring greater efficiency, updated facilities, and the assurance of a longer lease.
So, for buyers planning to live in District 15, does it make sense to buy new or stick with the resale options? Let’s have a look:
We’ll begin with the general price trend for D15
(If you’ve previously read our article on the new launch/resale price gap for one and two-bedders in D15, this information on the overall district is similar.)
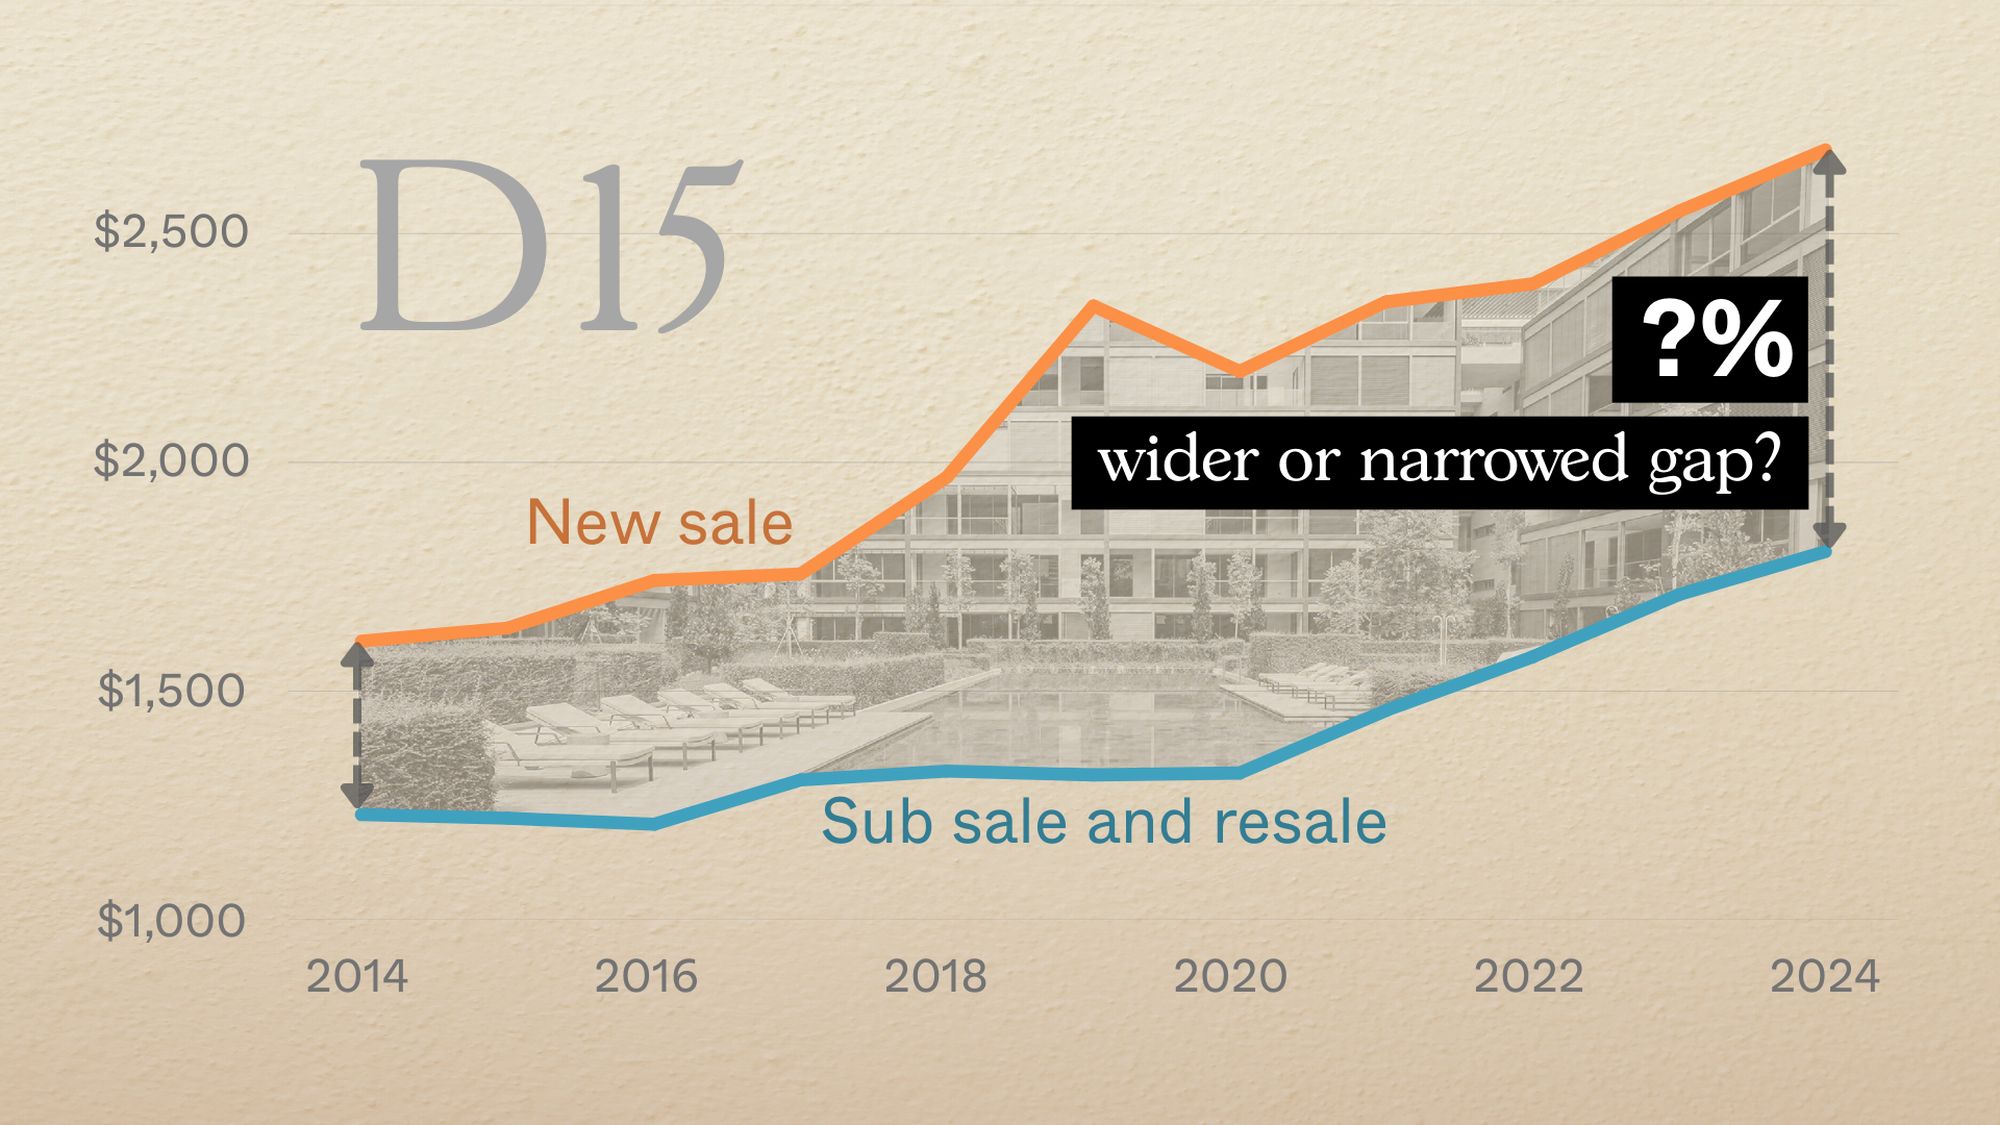
| Year | New Sale | Sub sale and resale | % difference |
| 2014 | $1,609 | $1,230 | 30.73% |
| 2015 | $1,638 | $1,222 | 34.11% |
| 2016 | $1,742 | $1,209 | 44.07% |
| 2017 | $1,756 | $1,306 | 34.50% |
| 2018 | $1,968 | $1,325 | 48.54% |
| 2019 | $2,342 | $1,317 | 77.78% |
| 2020 | $2,199 | $1,321 | 66.42% |
| 2021 | $2,351 | $1,458 | 61.26% |
| 2022 | $2,390 | $1,575 | 51.69% |
| 2023 | $2,549 | $1,711 | 48.99% |
| 2024 | $2,683 | $1,805 | 48.66% |
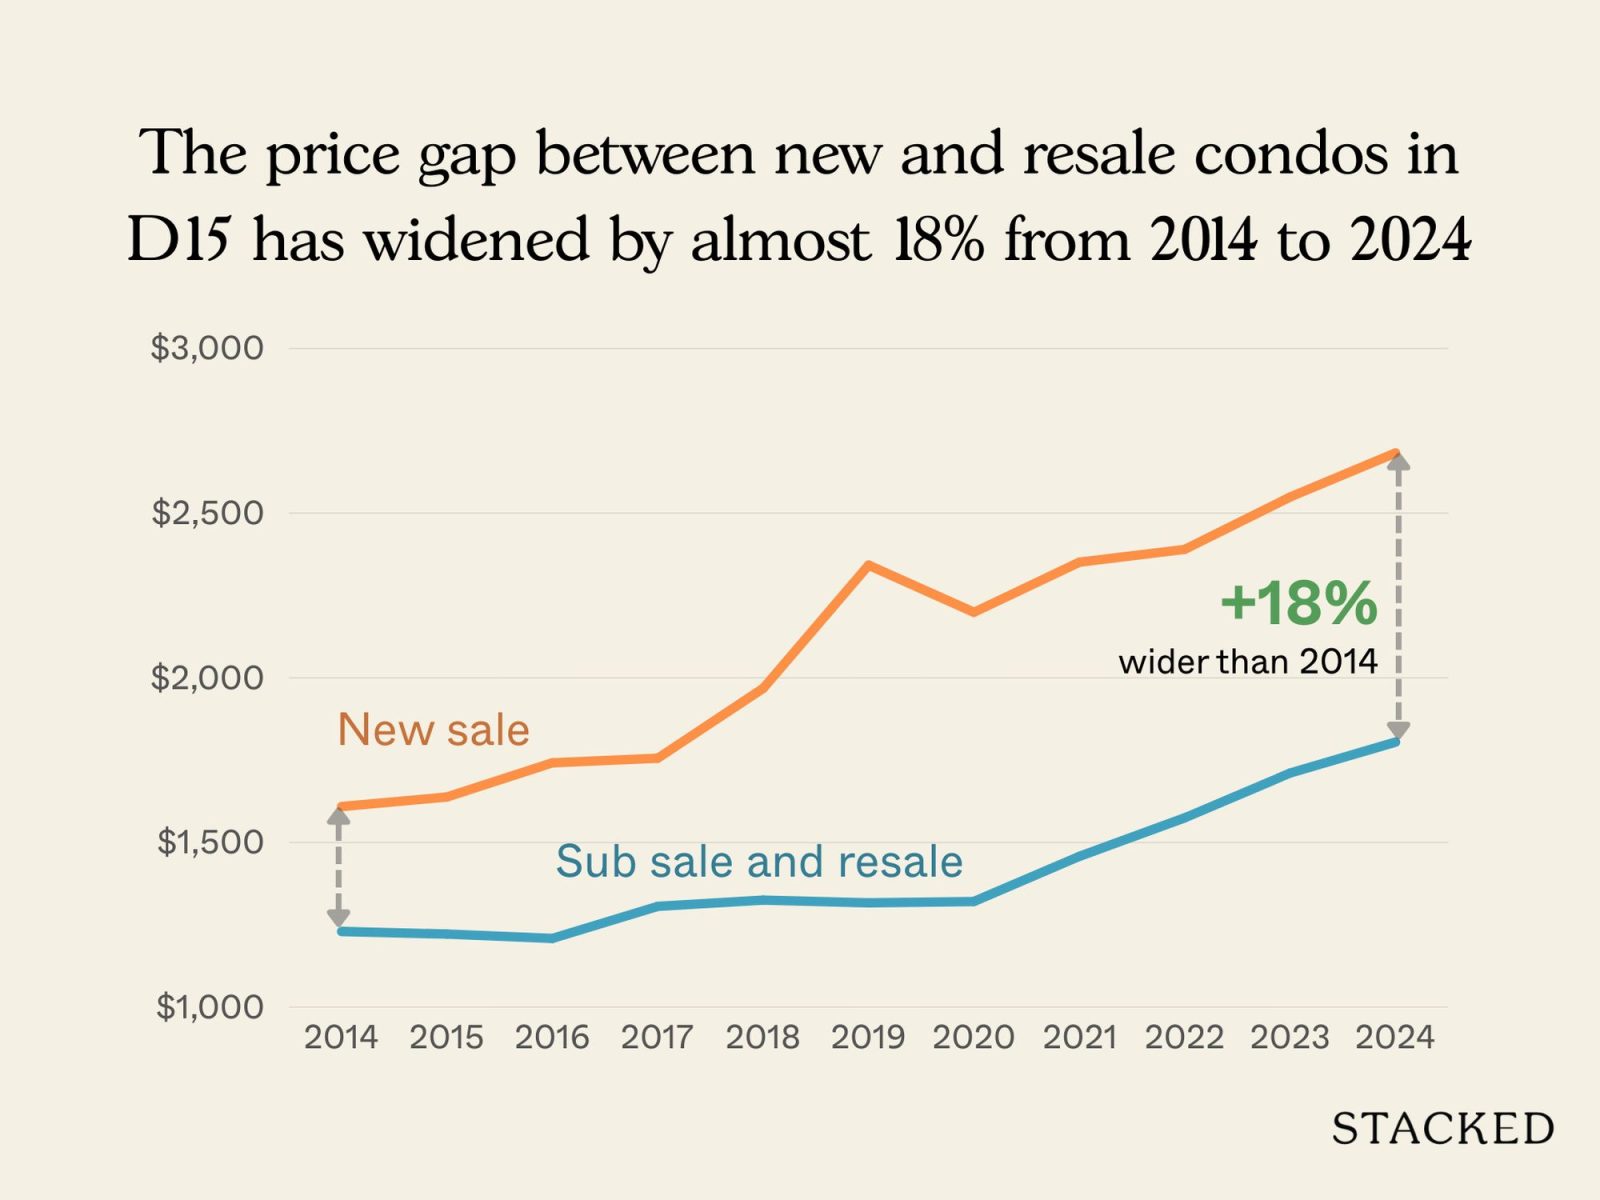
Overall, the price gap between new launches and resale units has widened by almost 18 per cent from 2014 to 2024. The biggest gap came in 2019, when new projects were about 78 per cent higher. This was largely due to the launches of Seaside Residences and Amber Park, which were high-priced launches that drove up the gap that year.
There was then a brief struggle when the COVID pandemic struck in 2020, but its aftermath drove up housing prices across the market, not just in D15.
With this broad trend in mind, let’s break the numbers down by bedroom type:
3-bedroom units
| Year | New Sale | Sub sale and resale | % difference |
| 2014 | $1,596 | $1,166 | 36.93% |
| 2015 | $1,561 | $1,164 | 34.09% |
| 2016 | $1,617 | $1,150 | 40.61% |
| 2017 | $1,686 | $1,200 | 40.55% |
| 2018 | $1,809 | $1,259 | 43.65% |
| 2019 | $2,149 | $1,277 | 68.31% |
| 2020 | $2,015 | $1,272 | 58.42% |
| 2021 | $2,325 | $1,426 | 63.08% |
| 2022 | $2,356 | $1,532 | 53.83% |
| 2023 | $2,510 | $1,651 | 52.02% |
| 2024 | $2,630 | $1,733 | 51.77% |
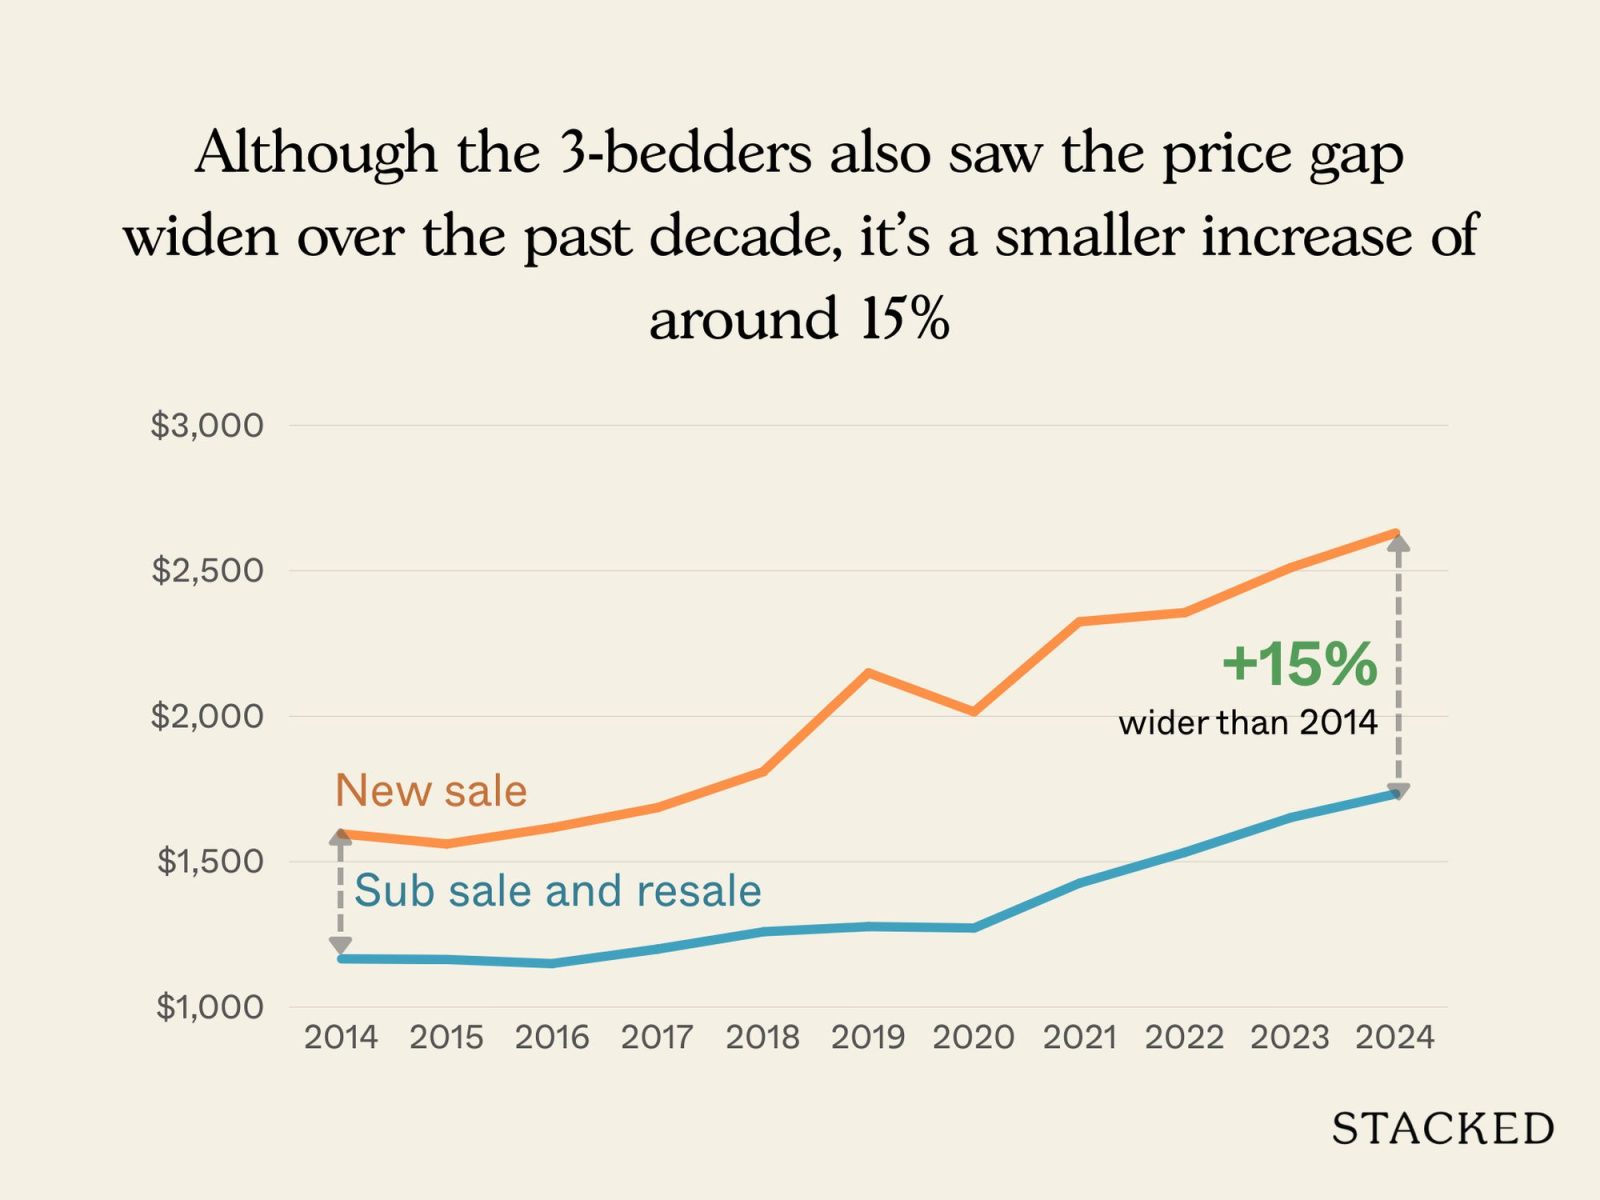
The price gap for three-bedders started at around 37 per cent in 2014 and reached just above 51 per cent by 2024. As is the usual pattern, the gap peaked in 2019, for the aforementioned reasons.
The gap narrowed somewhat in the following years, but it has never dropped below a 50 per cent gap since 2020.
4-bedroom units
| Year | New Sale | Sub sale and resale | % difference |
| 2014 | $1,520 | $1,310 | 16.01% |
| 2015 | $1,373 | $1,301 | 5.55% |
| 2016 | $1,603 | $1,252 | 27.96% |
| 2017 | $1,722 | $1,330 | 29.53% |
| 2018 | $2,145 | $1,425 | 50.56% |
| 2019 | $2,332 | $1,414 | 64.92% |
| 2020 | $2,318 | $1,378 | 68.18% |
| 2021 | $2,192 | $1,609 | 36.28% |
| 2022 | $2,376 | $1,740 | 36.55% |
| 2023 | $2,453 | $1,831 | 33.94% |
| 2024 | $2,568 | $1,965 | 30.73% |
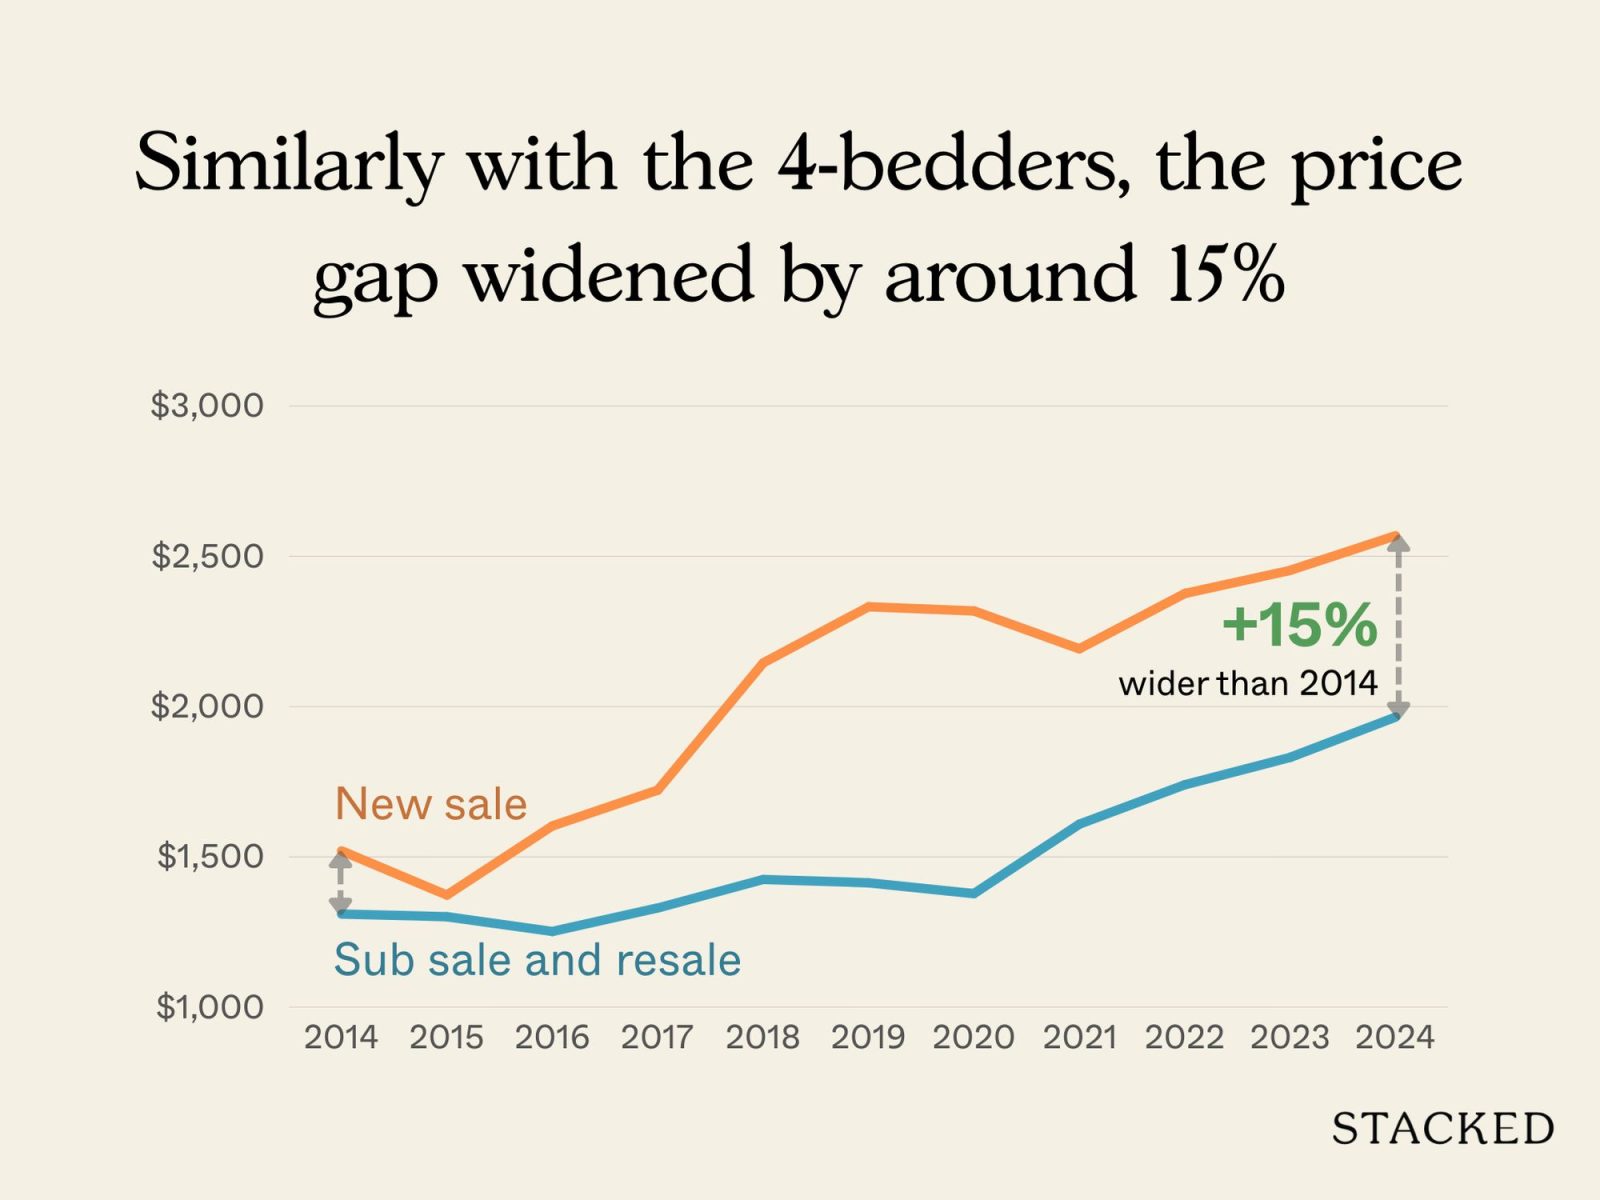
Because four-bedders are high quantum units with fewer transactions, we naturally see more volatility.
In 2014, the premium for new launches was just 16 per cent, before narrowing to as little as 5.5 per cent in 2015. From there, however, the gap widened sharply, climbing past 50 per cent in 2018 and peaking in 2020 at over 68 per cent.
After that, the gap fell again, to about 31 per cent by 2024.
5-bedroom units
| Year | New Sale | Sub sale and resale | % difference |
| 2014 | $1,180 | $1,405 | -16.01% |
| 2015 | $1,307 | $1,131 | 15.56% |
| 2016 | $1,680 | $1,100 | 52.76% |
| 2017 | $1,669 | $1,191 | 40.17% |
| 2018 | $1,453 | $1,397 | 4.03% |
| 2019 | $2,384 | $1,059 | 125.15% |
| 2020 | $2,488 | $1,117 | 122.74% |
| 2021 | $2,509 | $1,575 | 59.29% |
| 2022 | $2,356 | $1,974 | 19.34% |
| 2023 | $2,489 | $1,777 | 40.07% |
| 2024 | $2,689 | $1,931 | 39.24% |
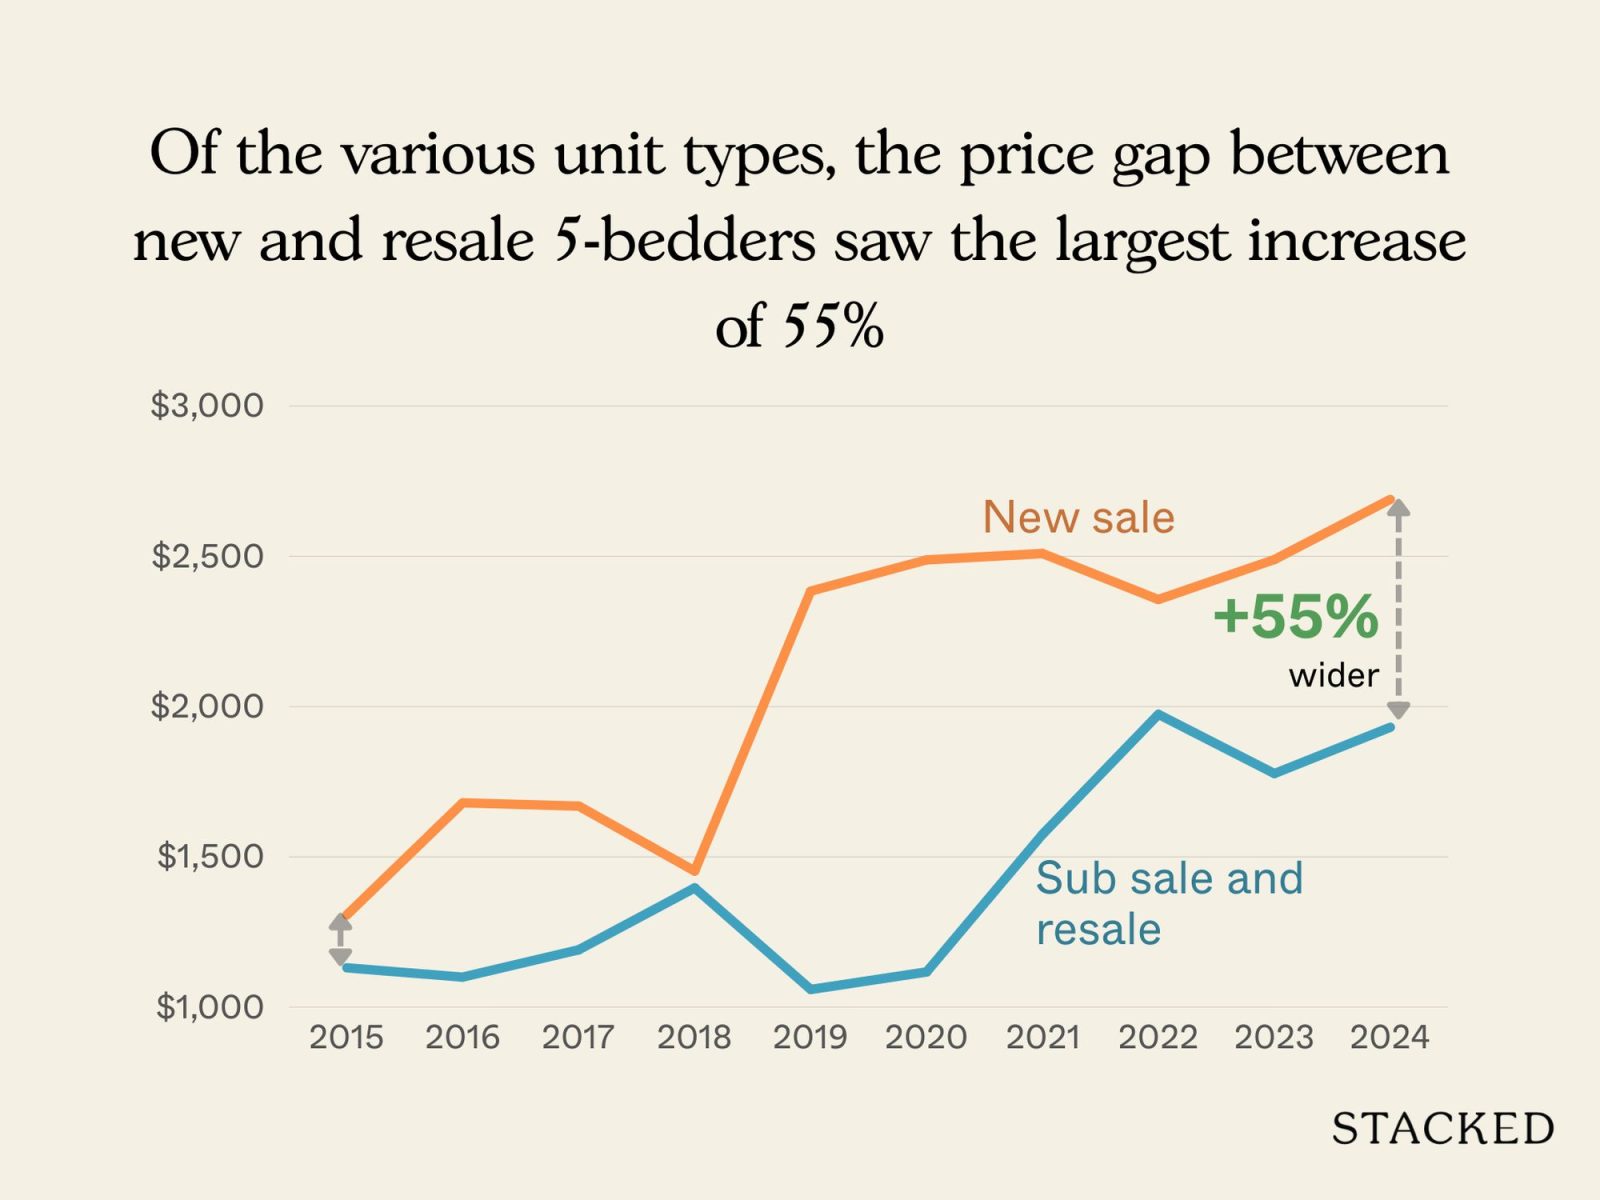
We still see a consistent pattern across all bedroom types: the price gap between new launches and resale condos widened from 2014 to 2024, generally ranging between 12 and 55 per cent.
Among them, five-bedders recorded the steepest increase, with the gap expanding by around 55 per cent over the decade.
For most unit types, the largest divergence came in 2019, when new launch prices surged ahead of resale. The exception was four-bedders, where the peak gap occurred a year later.
However, the real issue to consider is total cost (quantum), as a lower $PSF alone doesn’t always mean a unit is affordable.
Let’s take a look at the quantum of these three-bedders and larger units:
3-bedroom units
| Year | New Sale | Sub sale and resale | Price difference | % difference |
| 2014 | $1,855,777 | $1,688,608 | $167,170 | 9.90% |
| 2015 | $1,892,396 | $1,674,174 | $218,221 | 13.03% |
| 2016 | $1,998,444 | $1,638,990 | $359,455 | 21.93% |
| 2017 | $1,995,634 | $1,735,537 | $260,097 | 14.99% |
| 2018 | $2,072,098 | $1,721,132 | $350,967 | 20.39% |
| 2019 | $2,436,513 | $1,821,490 | $615,024 | 33.76% |
| 2020 | $2,328,720 | $1,817,321 | $511,399 | 28.14% |
| 2021 | $2,635,936 | $2,024,867 | $611,069 | 30.18% |
| 2022 | $2,829,339 | $2,198,934 | $630,405 | 28.67% |
| 2023 | $2,646,636 | $2,306,076 | $340,560 | 14.77% |
| 2024 | $2,702,053 | $2,481,204 | $220,849 | 8.90% |
| % increase from 2014 to 2024 | 45.60% | 46.94% |
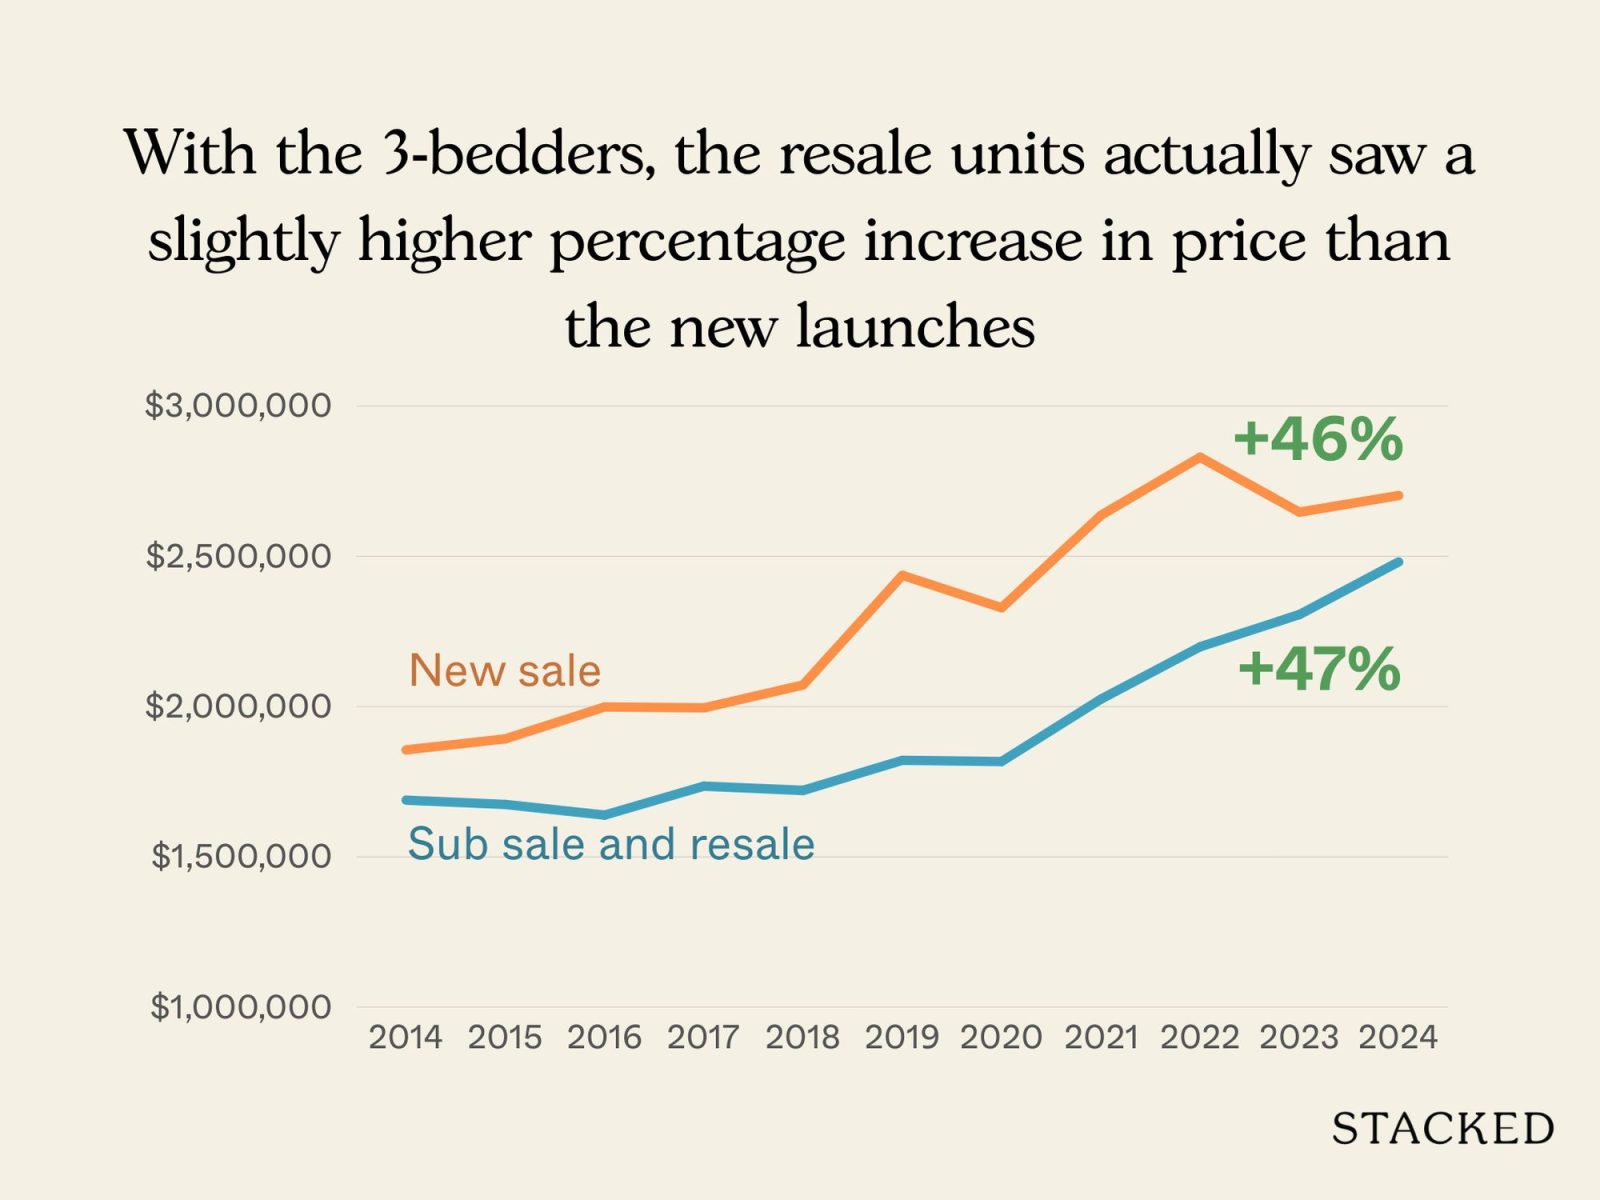
For three-bedders, resale units slightly outpaced new launches in terms of percentage growth. The resale units were up 46.94 per cent from 2014 to 2024, compared to 45.60 per cent for new units.
That said, there were years when the gap between the two was still substantial. In 2022, for instance, new three-bedders were priced over $630,000 higher than their resale counterparts. But for half of the past decade, the price difference has stayed below 20 per cent, showing the premium for new launches isn’t consistent in this category.
4-bedroom units
| Year | New Sale | Sub sale and resale | Price difference | % difference |
| 2014 | $2,742,204 | $2,693,442 | $48,762 | 1.81% |
| 2015 | $2,923,000 | $2,743,742 | $179,258 | 6.53% |
| 2016 | $2,960,500 | $2,648,526 | $311,974 | 11.78% |
| 2017 | $3,073,928 | $2,714,490 | $359,438 | 13.24% |
| 2018 | $3,297,360 | $2,830,238 | $467,122 | 16.50% |
| 2019 | $3,993,756 | $2,999,970 | $993,786 | 33.13% |
| 2020 | $4,361,553 | $2,871,062 | $1,490,491 | 51.91% |
| 2021 | $3,983,282 | $3,337,560 | $645,722 | 19.35% |
| 2022 | $3,927,077 | $3,927,417 | -$340 | -0.01% |
| 2023 | $3,469,354 | $3,725,641 | -$256,287 | -6.88% |
| 2024 | $3,420,598 | $3,959,689 | -$539,091 | -13.61% |
| % increase from 2014 to 2024 | 24.74% | 47.01% |
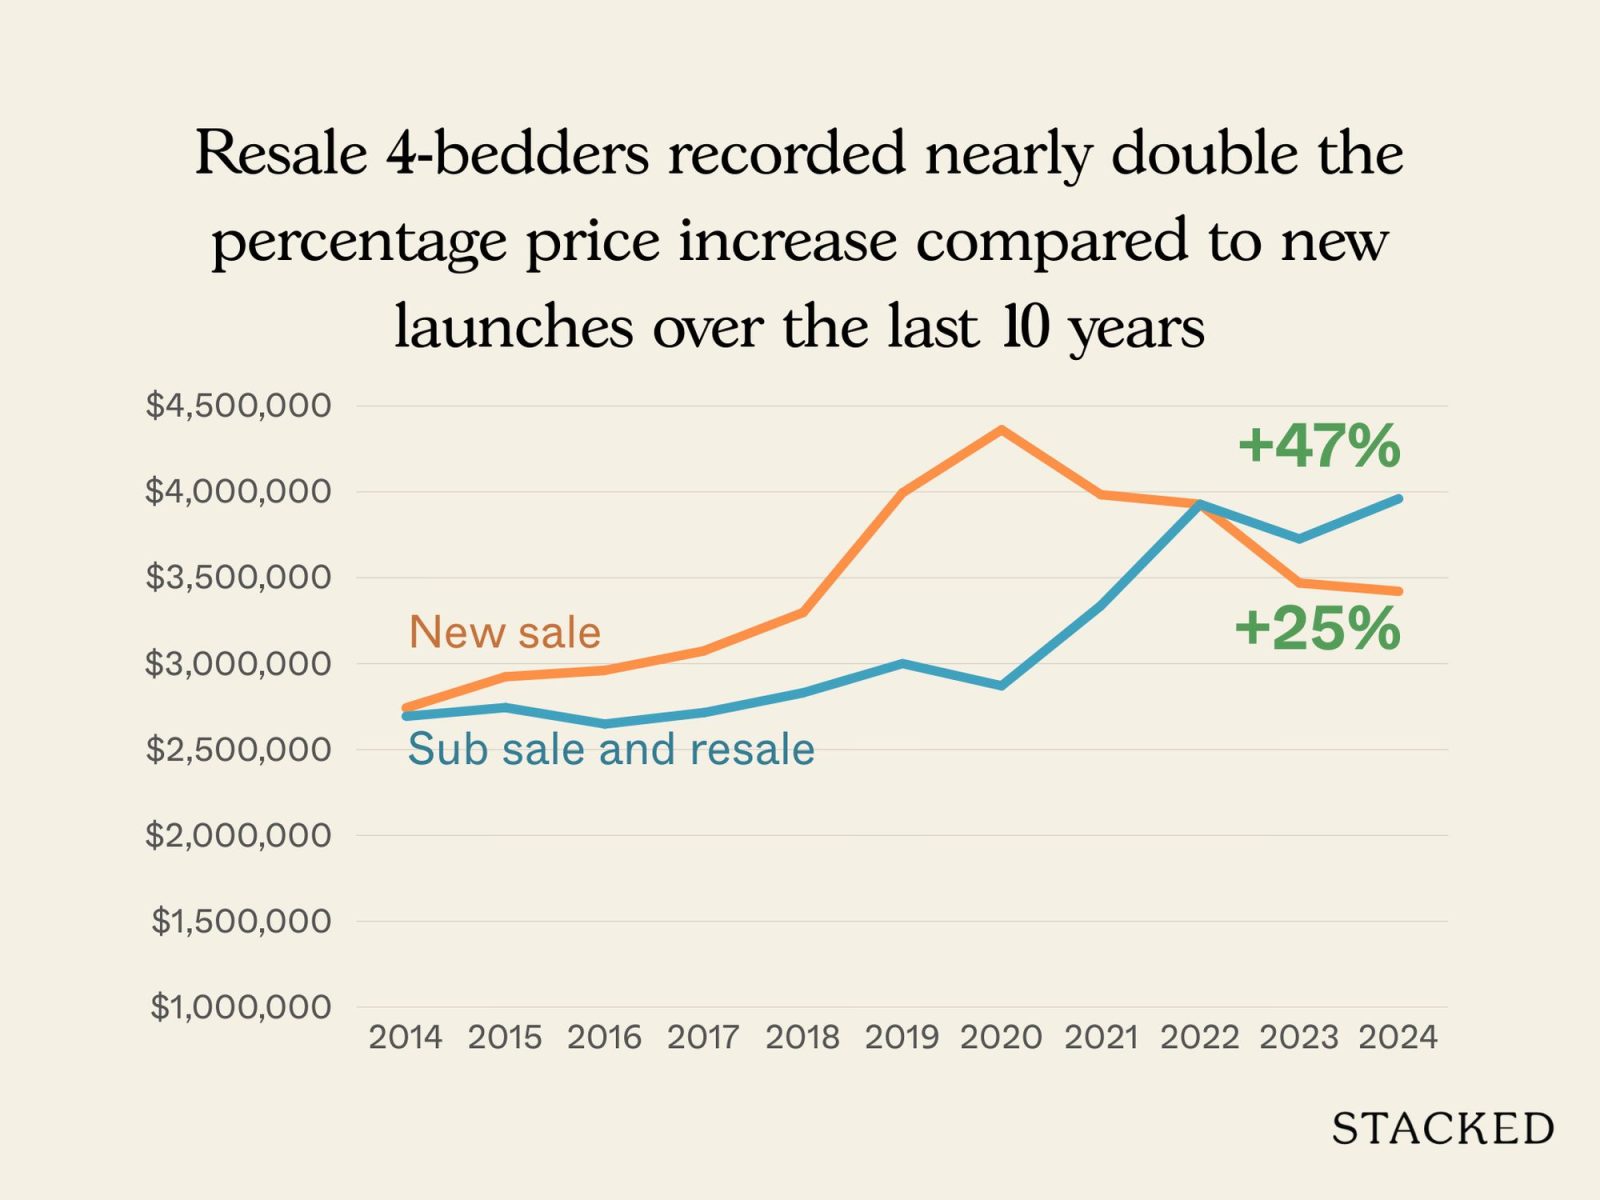
Resale four-bedders have significantly outpaced new launches in terms of price growth, rising by 47.01 per cent compared to just 24.74 per cent for new units.
From 2022 onwards, resale four-bedders have actually been priced higher than new launches, despite their lower average $PSF.
This reversal is likely linked to unit sizes: many resale four-bedders in District 15 are substantially larger, which drives up overall quantum even if their PSF is lower.
We’ll touch on this later, but to briefly explain: in the recent Emerald of Katong, the four-bedders ranged from just 1,152 sq ft to 1,313 sq ft. In contrast, older projects in D15, like The Makena and Mandarin Gardens, can have units that span from 1,600 sq ft to even over 2,000 sq ft.
Even so, the disparity has swung widely at times. In 2020, new launch four-bedders were almost $1.5 million more expensive than resale, while just a few years later, the trend flipped back in favour of resale. This is not entirely uncommon when dealing with larger high quantum units though, as transaction volumes tend to be lower and hence a bit more volatile and dependent on the timing of the new launches.
5-bedroom units
| Year | New Sale | Sub sale and resale | Price difference | % difference |
| 2014 | $1,735,167 | $7,350,000 | -$5,614,833 | -76.39% |
| 2015 | $1,590,000 | $2,794,444 | -$1,204,444 | -43.10% |
| 2016 | $2,363,667 | $2,818,688 | -$455,021 | -16.14% |
| 2017 | $2,371,000 | $4,177,667 | -$1,806,667 | -43.25% |
| 2018 | $2,393,000 | $4,433,167 | -$2,040,167 | -46.02% |
| 2019 | $5,587,656 | $2,325,250 | $3,262,406 | 140.30% |
| 2020 | $5,562,660 | $3,136,444 | $2,426,216 | 77.36% |
| 2021 | $5,555,000 | $4,998,889 | $556,111 | 11.12% |
| 2022 | $4,953,474 | $5,100,000 | -$146,526 | -2.87% |
| 2023 | $4,997,839 | $6,020,000 | -$1,022,161 | -16.98% |
| 2024 | $4,566,264 | $4,256,000 | $310,264 | 7.29% |
| % increase from 2014 to 2024 | 163.16% | -42.10% |
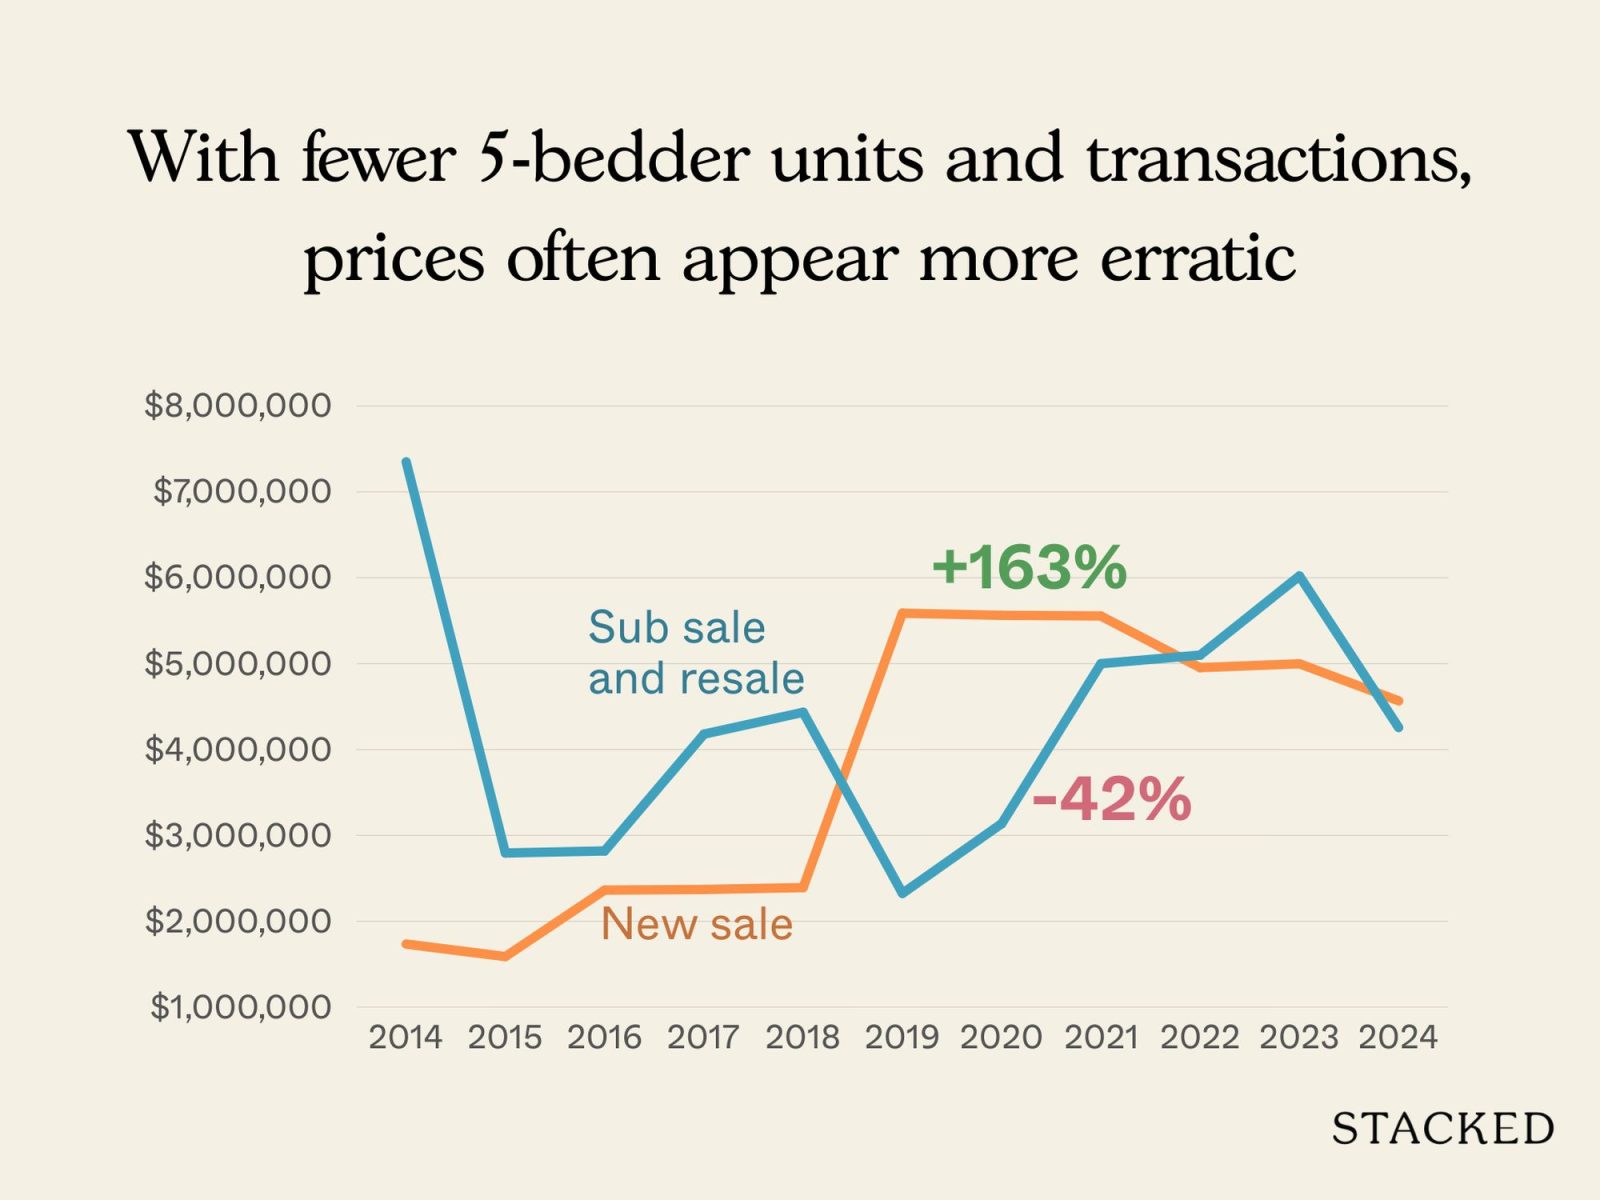
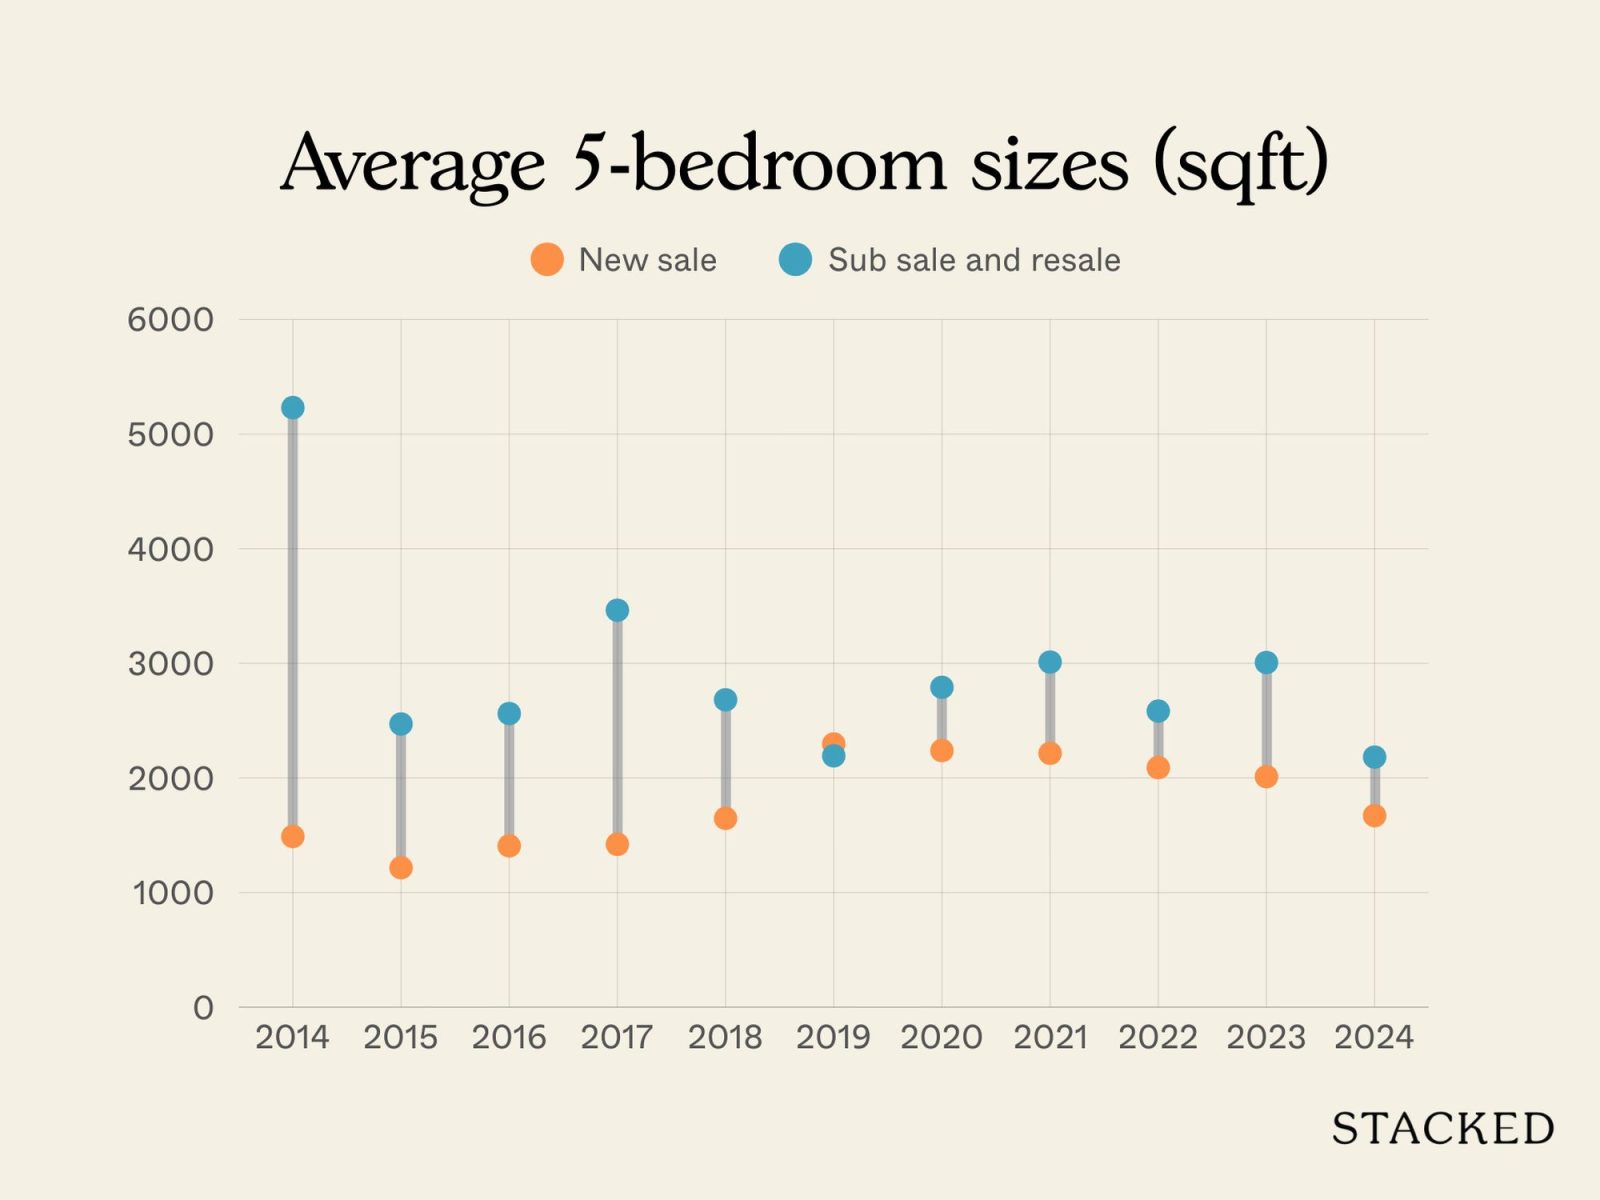
Again, we see greater volatility because these big-ticket transactions are rarer. In many years between 2014 and 2017, there was only a single resale transaction recorded.
For example, in 2014, the lone resale five-bedder sold was a massive 5,231 sq ft unit at Peach Garden, naturally pushing the overall resale quantum far higher than typical new launches.
We can say that from 2014 to 2024, new launch prices jumped by over 163 per cent, while resale values actually fell by 42.1 per cent; but unfortunately, these numbers are less representative than the others, due to the low transaction volumes.
But how large are these units, and what’s the size difference between new and resale?
Here are the size differences from known transactions:
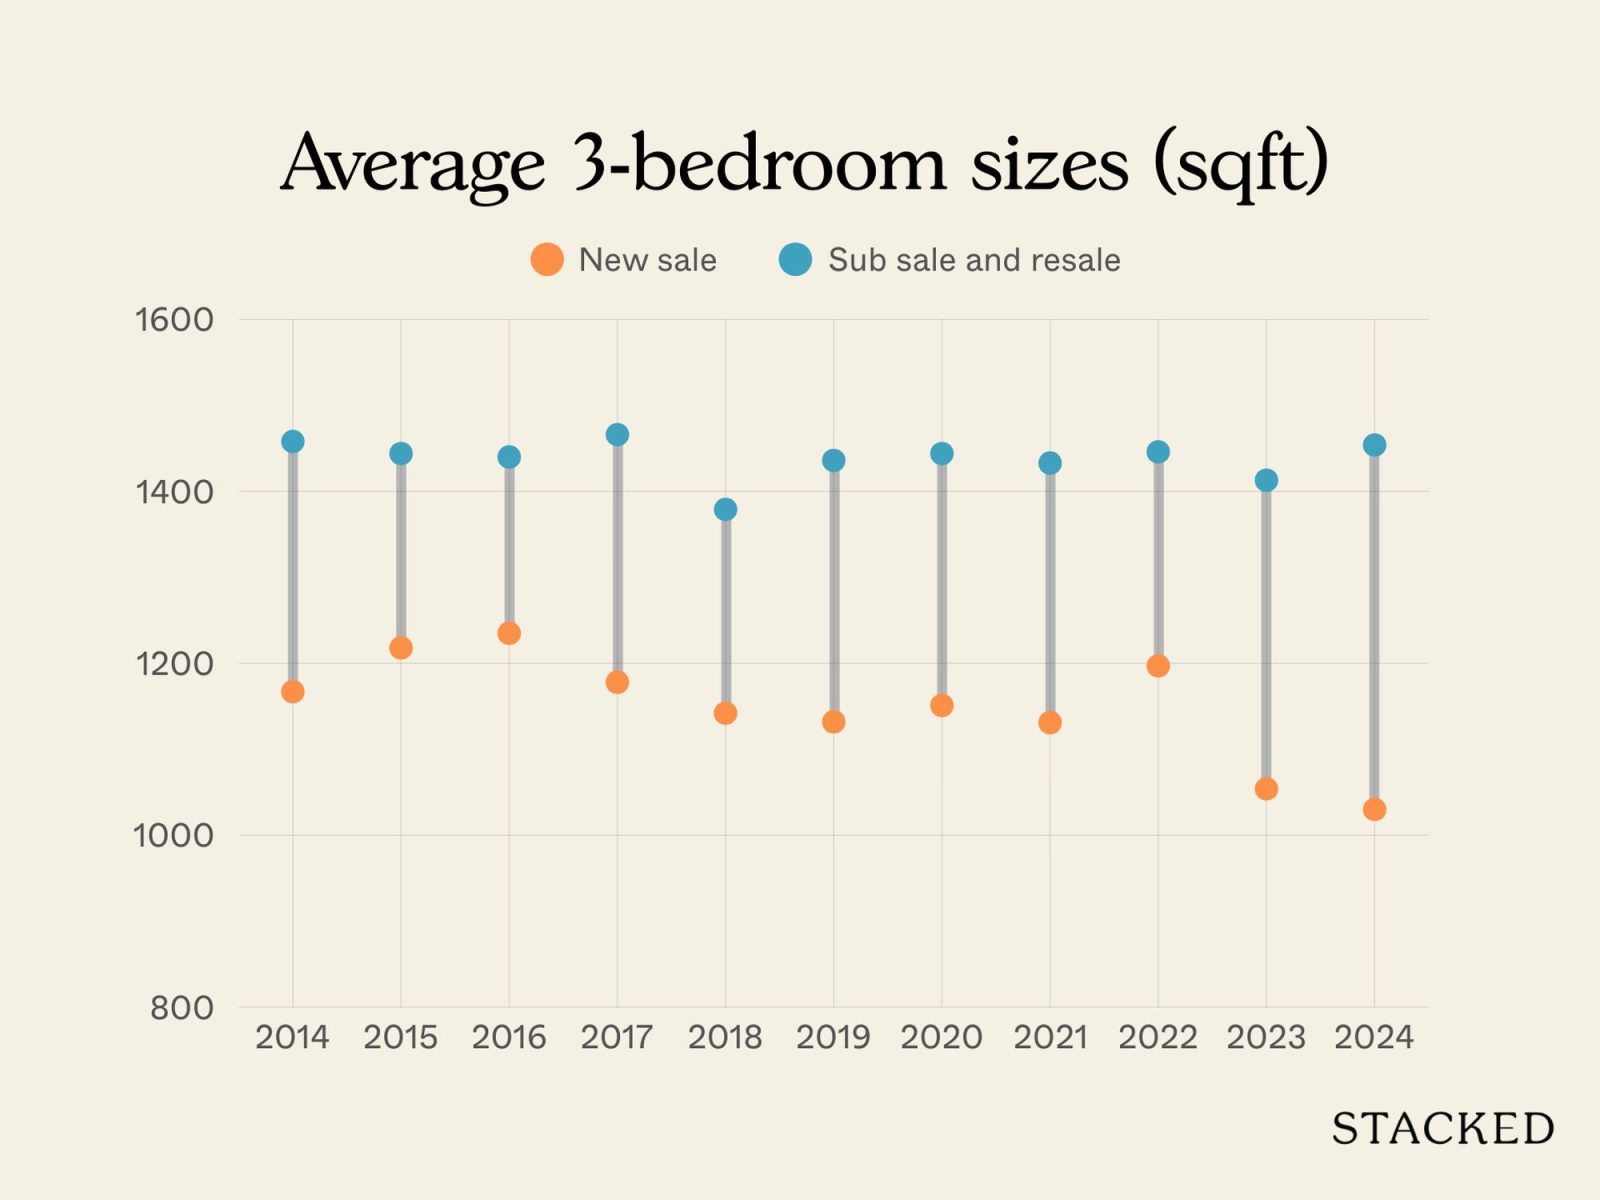
3-bedroom units
| Year | New Sale | Sub sale and resale | Difference |
| 2014 | 1167 | 1458 | -290 |
| 2015 | 1218 | 1444 | -225 |
| 2016 | 1235 | 1440 | -205 |
| 2017 | 1178 | 1466 | -288 |
| 2018 | 1142 | 1379 | -237 |
| 2019 | 1132 | 1436 | -305 |
| 2020 | 1151 | 1444 | -293 |
| 2021 | 1131 | 1433 | -302 |
| 2022 | 1197 | 1446 | -249 |
| 2023 | 1054 | 1413 | -359 |
| 2024 | 1030 | 1454 | -425 |
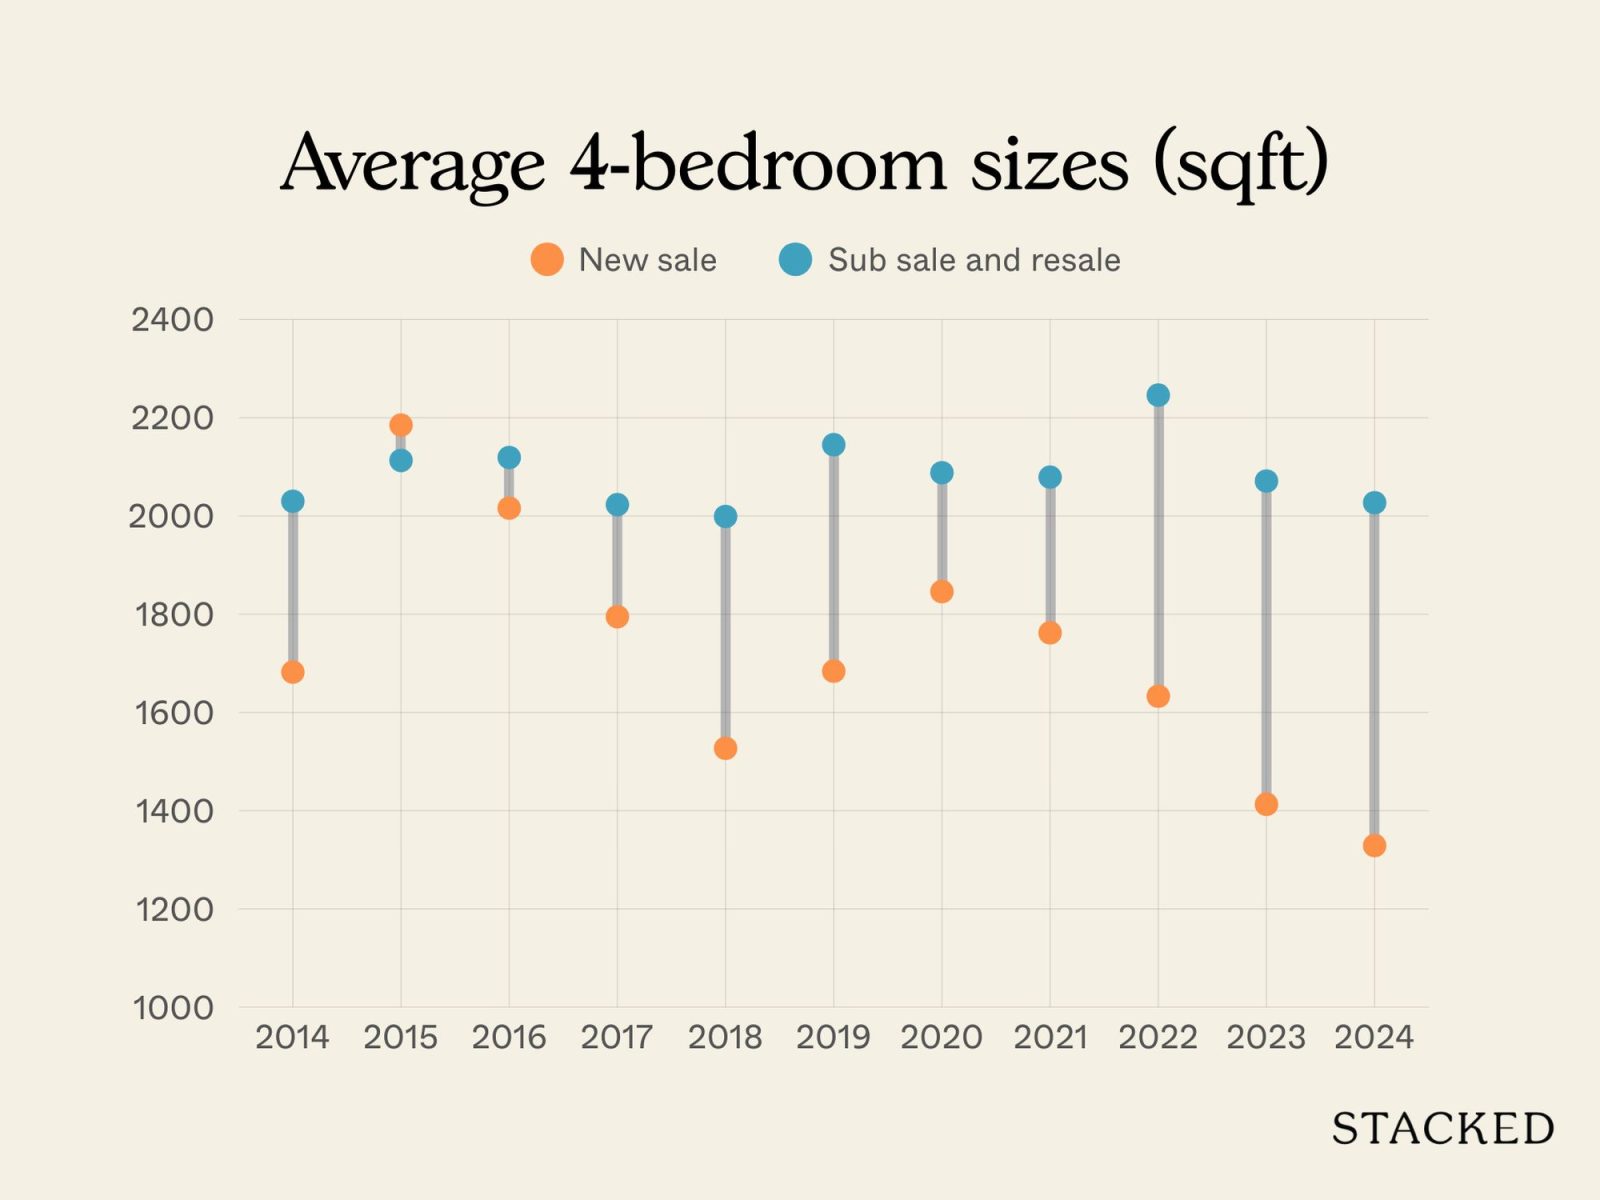
4-bedroom units
| Year | New Sale | Sub sale and resale | Difference |
| 2014 | 1682 | 2030 | -349 |
| 2015 | 2185 | 2113 | 73 |
| 2016 | 2016 | 2119 | -103 |
| 2017 | 1795 | 2023 | -227 |
| 2018 | 1527 | 1999 | -473 |
| 2019 | 1684 | 2145 | -460 |
| 2020 | 1846 | 2088 | -243 |
| 2021 | 1762 | 2079 | -317 |
| 2022 | 1633 | 2246 | -613 |
| 2023 | 1413 | 2071 | -658 |
| 2024 | 1329 | 2027 | -698 |
5-bedroom units
| Year | New Sale | Sub sale and resale | Difference |
| 2014 | 1489 | 5231 | -3742 |
| 2015 | 1216 | 2471 | -1255 |
| 2016 | 1407 | 2562 | -1155 |
| 2017 | 1421 | 3463 | -2042 |
| 2018 | 1647 | 2682 | -1035 |
| 2019 | 2296 | 2193 | 103 |
| 2020 | 2239 | 2791 | -552 |
| 2021 | 2215 | 3011 | -797 |
| 2022 | 2090 | 2583 | -493 |
| 2023 | 2011 | 3007 | -996 |
| 2024 | 1671 | 2182 | -511 |
As we’ve mentioned above, new launches tend to have smaller average unit sizes compared to resale counterparts. Apart from GFA harmonisation, developers have had to build smaller, to ensure the overall price (not so much the $PSF) is palatable.
Now we can do a more close-up comparison of new versus resale units, based on specific layouts:
99-year leasehold
| Year | New Sale | Sub sale and resale | Price difference | % difference |
| 2014 | $2,673,000 | $1,619,137 | $1,053,863 | 65.09% |
| 2015 | $1,657,677 | |||
| 2016 | $1,542,515 | |||
| 2017 | $1,896,641 | $1,600,285 | $296,356 | 18.52% |
| 2018 | $1,980,354 | $1,705,983 | $274,371 | 16.08% |
| 2019 | $2,227,559 | $1,738,854 | $488,705 | 28.11% |
| 2020 | $2,111,285 | $1,644,419 | $466,866 | 28.39% |
| 2021 | $2,175,000 | $1,883,502 | $291,498 | 15.48% |
| 2022 | $2,846,224 | $2,064,840 | $781,384 | 37.84% |
| 2023 | $2,600,810 | $2,096,172 | $504,637 | 24.07% |
| 2024 | $2,620,403 | $2,348,369 | $272,035 | 11.58% |
999-year/freehold
| Year | New Sale | Sub sale and resale | Price difference | % difference |
| 2014 | $1,846,163 | $1,720,992 | $125,171 | 7.27% |
| 2015 | $1,892,396 | $1,681,493 | $210,903 | 12.54% |
| 2016 | $1,998,444 | $1,678,652 | $319,792 | 19.05% |
| 2017 | $2,327,147 | $1,805,209 | $521,938 | 28.91% |
| 2018 | $2,169,826 | $1,726,048 | $443,777 | 25.71% |
| 2019 | $2,499,833 | $1,858,236 | $641,597 | 34.53% |
| 2020 | $2,434,040 | $1,903,435 | $530,605 | 27.88% |
| 2021 | $2,641,057 | $2,089,338 | $551,720 | 26.41% |
| 2022 | $2,818,082 | $2,279,830 | $538,252 | 23.61% |
| 2023 | $2,780,498 | $2,419,728 | $360,770 | 14.91% |
| 2024 | $2,913,062 | $2,553,593 | $359,469 | 14.08% |
As we’ve seen, the price gap between new and resale three-bedders was the narrowest in 2024, at just nine per cent. Interestingly, both leasehold and freehold projects showed fairly comparable percentage differences, suggesting that tenure isn’t as much of a factor when it comes to three-bedders.
To understand this dynamic better, let’s take a closer look at the specific three-bedder transactions recorded in 2024.
999-year/freehold
New sale
| Project | Average price | Average $PSF | Average size (sqft) for units transacted | Transaction volume |
| STRAITS AT JOO CHIAT | $2,093,950 | $2,115 | 990 | 4 |
| ROYAL HALLMARK | $2,108,160 | $2,304 | 915 | 1 |
| KOON SENG HOUSE | $2,384,000 | $2,308 | 1033 | 2 |
| ATLASSIA | $2,402,424 | $2,188 | 1098 | 1 |
| ARDOR RESIDENCE | $2,510,653 | $2,430 | 1033 | 6 |
| PARQ BELLA | $2,573,745 | $2,368 | 1087 | 4 |
| CLAYDENCE | $2,624,300 | $2,300 | 1141 | 2 |
| THE CONTINUUM | $2,867,846 | $2,821 | 1018 | 114 |
| MEYER BLUE | $3,386,625 | $3,210 | 1056 | 32 |
Sub sale and resale
| Project | Average price | Average $PSF | Average size (sqft) for units transacted | Transaction volume |
| SYCAMORE TREE | $1,170,000 | $1,587 | 737 | 2 |
| PARC ELEGANCE | $1,388,888 | $1,466 | 947 | 1 |
| EASTERN RESIDENCE | $1,400,000 | $1,327 | 1055 | 1 |
| GARDEN PARK RESIDENCES | $1,470,000 | $1,665 | 883 | 1 |
| EAST GROVE | $1,500,000 | $1,422 | 1055 | 1 |
| ESPIRA SPRING | $1,500,000 | $1,255 | 1195 | 1 |
| THE GERANIUM | $1,528,000 | $1,651 | 926 | 1 |
| SUNNY PALMS | $1,549,629 | $1,386 | 1119 | 3 |
| PROSPERO VILLE | $1,560,000 | $1,510 | 1033 | 1 |
| ISUITES @ MARSHALL | $1,570,000 | $1,430 | 1098 | 1 |
| BERKELEY RESIDENCES | $1,580,000 | $1,649 | 958 | 1 |
| JERSEY LODGE | $1,588,000 | $1,366 | 1163 | 1 |
| TREESCAPE | $1,588,000 | $1,821 | 872 | 1 |
| HERITAGE RESIDENCES | $1,600,000 | $1,443 | 1109 | 1 |
| ROSE VILLE | $1,600,000 | $1,598 | 1001 | 1 |
| SUITES TWENTY-TWO | $1,600,000 | $1,581 | 1012 | 1 |
| SHEBA LODGE | $1,610,000 | $1,411 | 1141 | 1 |
| CASTLE LOFT | $1,675,000 | $1,428 | 1173 | 1 |
| CRESCENDO BUILDING | $1,675,333 | $1,332 | 1259 | 3 |
| EMPRADO SUITES | $1,680,000 | $1,593 | 1055 | 1 |
| THE NCLAVE | $1,693,333 | $1,622 | 1044 | 3 |
| JOO CHIAT VERBENA | $1,700,000 | $1,462 | 1163 | 1 |
| JC COURT | $1,710,000 | $1,194 | 1432 | 1 |
| CANNAVILLE | $1,720,000 | $1,427 | 1206 | 1 |
| LE CONNEY PARK | $1,736,000 | $1,394 | 1245 | 3 |
| PRESTIGE LOFT | $1,788,000 | $1,186 | 1507 | 1 |
| SILAHIS APARTMENTS | $1,790,000 | $1,381 | 1297 | 2 |
| VENTURA VIEW | $1,790,000 | $1,153 | 1583 | 2 |
| CHELSEA LODGE | $1,799,333 | $1,466 | 1227 | 3 |
| STUDIOS@TEMBELING | $1,800,000 | $1,349 | 1335 | 1 |
| LE MERRITT | $1,824,500 | $1,691 | 1082 | 4 |
| AURALIS | $1,850,000 | $1,828 | 1012 | 1 |
| KNOX VIEW | $1,850,000 | $1,615 | 1147 | 2 |
| THE VERTE | $1,858,000 | $1,676 | 1109 | 1 |
| THE BALE | $1,859,000 | $1,397 | 1340 | 4 |
| NATURE MANSIONS | $1,860,000 | $1,557 | 1195 | 1 |
| DAWN VILLE | $1,870,000 | $1,551 | 1206 | 1 |
| FIVENINE | $1,870,000 | $1,773 | 1055 | 1 |
| THE LUSH | $1,875,000 | $1,476 | 1270 | 1 |
| UNITED MANSION | $1,882,667 | $1,460 | 1288 | 3 |
| BUTTERWORTH VIEW | $1,885,000 | $1,550 | 1216 | 2 |
| TAIPAN GRAND | $1,888,888 | $1,526 | 1238 | 1 |
| MOUNTBATTEN SUITES | $1,900,000 | $1,682 | 1131 | 2 |
| TIVOLI GRANDE | $1,916,667 | $1,290 | 1485 | 3 |
| EAST PALM | $1,918,125 | $1,541 | 1258 | 8 |
| BLU CORAL | $1,934,000 | $1,361 | 1469 | 2 |
| THE MEDLEY | $1,940,000 | $1,434 | 1356 | 2 |
| D’SAVILLE | $1,950,000 | $1,677 | 1163 | 1 |
| HAIG ELEVEN | $1,964,000 | $1,698 | 1163 | 2 |
| PALM OASIS | $1,965,000 | $1,342 | 1464 | 1 |
| 8M RESIDENCES | $2,000,000 | $2,239 | 893 | 1 |
| PARADISE PALMS | $2,000,000 | $1,736 | 1152 | 1 |
| TESSA LODGE | $2,000,000 | $1,630 | 1227 | 1 |
| THE BECCAGAYLE | $2,000,000 | $1,475 | 1356 | 1 |
| EASTWIND MANSIONS | $2,000,444 | $1,487 | 1346 | 2 |
| FORTUNE JADE | $2,005,000 | $1,827 | 1098 | 2 |
| GALLERY 8 | $2,010,000 | $1,582 | 1270 | 1 |
| MAYA | $2,016,888 | $1,575 | 1281 | 1 |
| CALLIDORA VILLE | $2,020,000 | $1,564 | 1292 | 1 |
| THE ESPIRA | $2,026,000 | $1,329 | 1636 | 2 |
| SERAYA RESIDENCES | $2,030,000 | $1,824 | 1109 | 2 |
| SUNSHINE REGENCY | $2,040,000 | $1,363 | 1496 | 1 |
| LA MEYER | $2,080,000 | $1,806 | 1152 | 1 |
| STILLZ RESIDENCE | $2,112,000 | $1,137 | 1894 | 3 |
| PALM LOFT | $2,128,000 | $1,267 | 1679 | 1 |
| ESTIQUE | $2,130,000 | $1,511 | 1410 | 1 |
| RITZ REGENCY | $2,130,000 | $1,783 | 1195 | 1 |
| DE CASALLE | $2,150,000 | $1,722 | 1249 | 1 |
| ST PATRICK’S LOFT | $2,160,000 | $1,693 | 1276 | 2 |
| GOLD LEAF MANSIONS | $2,168,888 | $1,471 | 1475 | 1 |
| FLAMINGO VALLEY | $2,169,200 | $1,598 | 1415 | 5 |
| CHAPEL LODGE | $2,174,444 | $1,611 | 1356 | 2 |
| CARPMAEL THIRTY-EIGHT | $2,180,000 | $1,858 | 1173 | 1 |
| EAST VIEW | $2,180,000 | $1,986 | 1098 | 1 |
| VERSILIA ON HAIG | $2,180,000 | $1,929 | 1130 | 2 |
| EASTERN LAGOON | $2,200,000 | $1,597 | 1378 | 1 |
| PALM GALLERIA | $2,200,000 | $1,363 | 1615 | 1 |
| RESIDENCE 66 | $2,200,000 | $1,188 | 1851 | 1 |
| THE CARPMAELINA | $2,200,000 | $1,703 | 1292 | 1 |
| IVORY | $2,218,000 | $1,272 | 1744 | 1 |
| COASTARINA | $2,250,000 | $1,620 | 1389 | 1 |
| MAYFAIR RESIDENCES | $2,278,333 | $1,912 | 1191 | 3 |
| CRESCENDO PARK | $2,288,888 | $1,599 | 1432 | 1 |
| SEA AVENUE MANSIONS | $2,300,000 | $1,908 | 1206 | 1 |
| THE AZZURO | $2,300,000 | $1,257 | 1830 | 1 |
| VERSAILLES | $2,310,000 | $1,544 | 1496 | 1 |
| THE ELEGANCE @ CHANGI | $2,316,500 | $1,169 | 1981 | 2 |
| ROSE MAISON | $2,325,000 | $1,024 | 2271 | 1 |
| MARGATE POINT | $2,330,000 | $1,819 | 1281 | 2 |
| VILLA MARTIA | $2,349,000 | $1,856 | 1265 | 2 |
| MERLOT VILLE | $2,350,000 | $1,348 | 1744 | 1 |
| THE BEACON EDGE | $2,360,000 | $1,533 | 1539 | 1 |
| VERANDA | $2,380,000 | $1,356 | 1820 | 2 |
| EMERY POINT | $2,395,000 | $1,824 | 1313 | 2 |
| D’ECOSIA | $2,410,000 | $1,964 | 1227 | 2 |
| QUESTA @ DUNMAN | $2,410,000 | $1,534 | 1572 | 1 |
| VERDOR RESIDENCES | $2,418,888 | $1,783 | 1356 | 1 |
| HOMEY GARDENS | $2,425,000 | $1,391 | 1744 | 1 |
| RESIDENCE TWENTY-TWO | $2,430,000 | $2,034 | 1195 | 1 |
| PALMERA RESIDENCE | $2,450,000 | $1,316 | 1862 | 1 |
| THE CAPE | $2,464,444 | $2,111 | 1168 | 2 |
| ONE FORT | $2,475,000 | $2,053 | 1206 | 2 |
| THE MEYER PLACE | $2,550,000 | $1,865 | 1367 | 1 |
| IDYLLIC RESIDENCES | $2,565,000 | $1,317 | 1948 | 2 |
| HAIG TEN | $2,579,000 | $1,749 | 1475 | 2 |
| THE SEAWIND | $2,580,000 | $1,844 | 1399 | 1 |
| TIERRA VUE | $2,583,333 | $1,925 | 1349 | 3 |
| FERNWOOD TOWERS | $2,595,574 | $1,624 | 1601 | 12 |
| BUTTERWORTH 8 | $2,628,225 | $1,919 | 1375 | 4 |
| SPRING @ LANGSAT | $2,638,000 | $1,459 | 1808 | 1 |
| SEVENTY SAINT PATRICK’S | $2,647,500 | $2,319 | 1138 | 4 |
| THE SOUND | $2,650,000 | $1,923 | 1378 | 1 |
| FORT GARDENS | $2,659,444 | $1,910 | 1394 | 2 |
| THE LINE @ TANJONG RHU | $2,685,000 | $2,341 | 1146 | 6 |
| PARK EAST | $2,764,000 | $1,586 | 1755 | 7 |
| NYON | $2,868,000 | $2,358 | 1216 | 1 |
| HAIG COURT | $2,894,963 | $2,022 | 1431 | 3 |
| KATONG REGENCY | $2,900,000 | $2,089 | 1389 | 1 |
| ST PATRICK’S RESIDENCES | $2,903,525 | $2,056 | 1414 | 3 |
| THE ARISTO @ AMBER | $2,910,000 | $1,802 | 1615 | 1 |
| AMBER PARK | $2,915,000 | $2,912 | 1001 | 6 |
| SPRING @ KATONG | $2,920,000 | $1,739 | 1679 | 1 |
| PALM VISTA | $2,980,000 | $1,547 | 1927 | 1 |
| GRAND DUCHESS AT ST PATRICK’S | $3,025,000 | $2,196 | 1378 | 2 |
| ONE AMBER | $3,034,955 | $2,191 | 1406 | 11 |
| PARC SEABREEZE | $3,043,333 | $2,318 | 1313 | 3 |
| THE MAKENA | $3,063,892 | $1,976 | 1533 | 12 |
| COASTLINE RESIDENCES | $3,092,667 | $2,770 | 1116 | 3 |
| THE ESTA | $3,109,500 | $2,288 | 1359 | 4 |
| THE BELVEDERE | $3,117,555 | $2,373 | 1314 | 7 |
| AMBER SKYE | $3,150,000 | $2,360 | 1335 | 2 |
| KING’S MANSION | $3,259,167 | $1,955 | 1672 | 6 |
| THE MEYERISE | $3,264,138 | $2,545 | 1283 | 5 |
| PARKSHORE | $3,267,500 | $2,042 | 1604 | 4 |
| ARTHUR MANSIONS | $3,300,000 | $2,044 | 1615 | 1 |
| AMBER 45 | $3,350,000 | $2,829 | 1184 | 1 |
| KATONG GARDENS | $3,350,000 | $1,719 | 1948 | 1 |
| THE ATRIA AT MEYER | $3,385,315 | $2,193 | 1547 | 6 |
| MODA | $3,400,000 | $1,847 | 1841 | 1 |
| THE SEA VIEW | $3,410,500 | $2,534 | 1345 | 6 |
| AMBER POINT | $3,440,000 | $2,036 | 1690 | 2 |
| MEYER MANSION | $3,508,000 | $3,164 | 1109 | 1 |
| AMBER RESIDENCES | $3,680,000 | $2,222 | 1658 | 2 |
| OLA RESIDENCES | $3,684,444 | $1,722 | 2212 | 2 |
| THE SEAFRONT ON MEYER | $3,855,000 | $2,404 | 1604 | 6 |
| HAWAII TOWER | $4,000,000 | $1,787 | 2239 | 1 |
| AALTO | $4,024,722 | $2,655 | 1518 | 4 |
| OCEAN PARK | $4,031,667 | $1,911 | 2110 | 3 |
| THE WATERSIDE | $4,041,760 | $1,887 | 2142 | 5 |
| 11 AMBER ROAD | $4,880,000 | $1,717 | 2842 | 1 |
The average price range was relatively narrow in 2024, for new launches, spanning from about $2.1 million to $3.4 million. In contrast, resale projects showed a much wider spread, from $1.2 million at the lower end to nearly $4.9 million at the top. Price-wise, the new launches end up somewhere in the mid-range of their resale market counterparts.
These figures suggest that buyers shopping in the mid-tier resale bracket could plausibly consider a new launch instead. That said, a key distinction is that the majority of resale projects offer significantly larger unit sizes.
For buyers considering a resale alternative to The Continuum, Park East comes closest on average pricing.
Let’s compare how their three-bedder floor plans measure up:
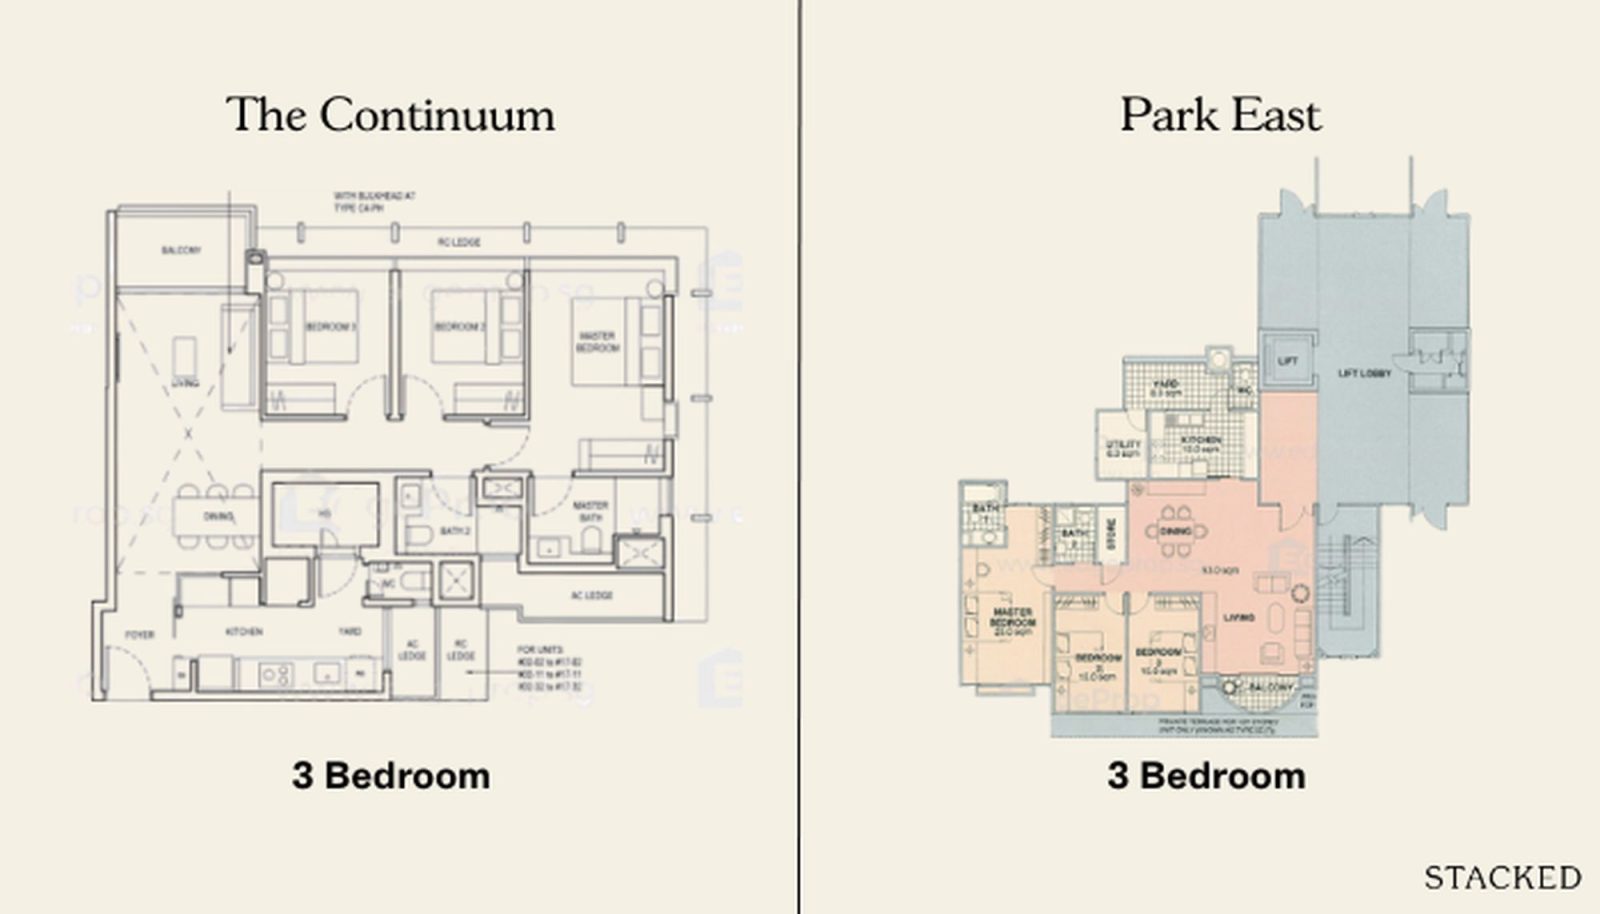
Park East offers a larger three-bedder, as expected from an older property. Both projects segregate the living and dining areas, but The Continuum stacks them front-to-back in a vertical configuration, while Park East adopts an L-shaped layout that gives the dining area a more distinct corner.
Their kitchens also share a similar feature set, with a yard, WC, and utility or home shelter; the main difference is that Park East separates the yard from the kitchen, while The Continuum integrates it as part of the space. In general, Continuum’s layout would be considered more efficient, even though the kitchen is smaller.
Park East has a dated semi-circular design for its balcony, which is generally not favoured today (it’s more awkward to fit any kind of furniture, usually), and The Continuum has a more compact rectangular balcony.
Taken together, Park East will appeal to those who care about raw square footage, while The Continuum makes the case for a newer, more efficient layout.
Let’s also take a look at the new and resale leasehold transactions done in 2024
New sale
| Project | Average price | Average $PSF | Average size (sqft) for units transacted | Transaction volume |
| EMERALD OF KATONG | $2,507,181 | $2,607 | 962 | 281 |
| TEMBUSU GRAND | $2,797,845 | $2,386 | 1173 | 103 |
| GRAND DUNMAN | $2,921,267 | $2,581 | 1132 | 45 |
Sub sale and resale
| Project | Average price | Average $PSF | Average size (sqft) for units transacted | Transaction volume |
| EAST BAY GARDENS | $1,355,000 | $968 | 1399 | 1 |
| NEPTUNE COURT | $1,508,494 | $1,019 | 1473 | 27 |
| TANJONG RIA CONDOMINIUM | $1,862,222 | $1,534 | 1214 | 4 |
| LEGENDA AT JOO CHIAT | $1,879,167 | $1,324 | 1460 | 3 |
| DUNMAN VIEW | $1,891,111 | $1,546 | 1223 | 9 |
| LAGOON VIEW | $1,894,222 | $1,150 | 1647 | 9 |
| LAGUNA PARK | $1,926,167 | $1,182 | 1641 | 18 |
| VILLA MARINA | $1,986,500 | $1,447 | 1400 | 12 |
| SANCTUARY GREEN | $2,061,778 | $1,647 | 1251 | 5 |
| MANDARIN GARDENS | $2,287,050 | $1,298 | 1762 | 20 |
| WATER PLACE | $2,338,000 | $1,817 | 1286 | 11 |
| RIVEREDGE | $2,388,000 | $1,789 | 1335 | 1 |
| COTE D’AZUR | $2,643,111 | $1,986 | 1332 | 9 |
| SEASIDE RESIDENCES | $2,643,434 | $2,357 | 1120 | 11 |
| CASUARINA COVE | $2,680,000 | $1,649 | 1625 | 1 |
| COSTA RHU | $2,927,000 | $1,546 | 1899 | 10 |
| SILVERSEA | $3,482,154 | $2,190 | 1588 | 13 |
| PEBBLE BAY | $3,681,335 | $1,780 | 2076 | 16 |
| CAMELOT BY-THE-WATER | $4,166,000 | $1,530 | 2723 | 1 |
The new launches showed a relatively narrow price range of about $2.5 million to $2.9 million. Resale projects, on the other hand, stretched from around $1.4 million at the lower end to over $4.2 million at the top. This puts most new launch prices in the mid-range of the resale market.
Seven resale projects recorded higher average prices than all three new launches. These units were much larger in size, which explains their higher quantums despite the lower $PSF. While the overall price gap between new and resale leasehold projects was smaller than in the freehold segment, the difference between individual projects could still be wide.
Assuming your budget extends to the mid-range of the resale market, you could plausibly opt for a new launch in the area instead.
For those considering a resale option at a similar price point to Emerald of Katong, Riveredge comes closest in average pricing.
Let’s look at the floor plans:
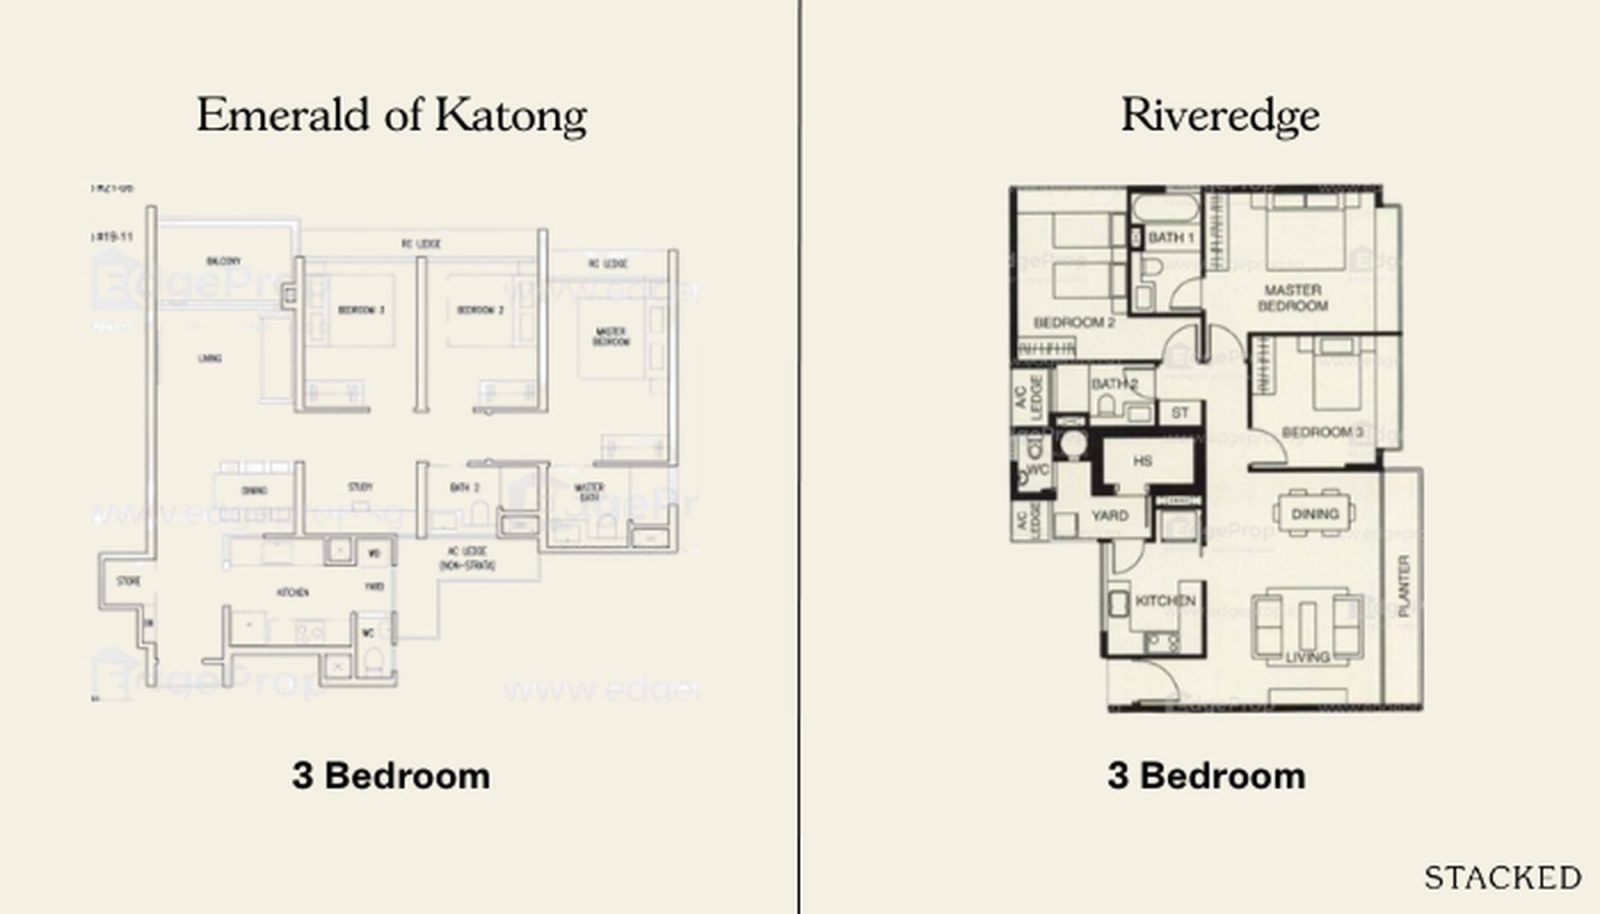
Riveredge keeps it simple with a full-sized three-bedder, while Emerald of Katong squeezes more function in with a three-bedder plus study.
One plus point is that the study at Emerald isn’t just a token nook: it’s roomy enough to be enclosed and turned into a small bedroom.
Emerald of Katong opens up to a balcony off the living area, while Riveredge unfortunately comes with a planter box. Both give you enclosed kitchens with a yard and WC, but Riveredge adds a home shelter. Layout-wise, Emerald splits the living and dining areas for clearer zones, while Riveredge lines them up side by side. Emerald also sneaks in a store across from the kitchen for extra utility.
Along with the planter box issue, Riveredge’s bedrooms come with bay windows, which eat into usable space; this makes some of its larger square footage start to feel wasted. Emerald of Katong, on the other hand, has a more efficient layout, and the versatile study-turned-bedroom gives it the edge, even against Riveredge’s bigger size.
Now, let’s look at the four-bedroom transactions
99-year leasehold
| Year | New Sale | Sub sale and resale | Price difference | % difference |
| 2014 | $11,100,000 | $2,884,236 | $8,215,764 | 284.85% |
| 2015 | $2,956,223 | |||
| 2016 | $2,672,933 | |||
| 2017 | $2,938,533 | $2,727,075 | $211,458 | 7.75% |
| 2018 | $3,286,786 | $2,822,030 | $464,756 | 16.47% |
| 2019 | $3,463,977 | $3,059,840 | $404,137 | 13.21% |
| 2020 | $3,204,520 | |||
| 2021 | $3,408,902 | |||
| 2022 | $3,909,647 | $4,075,223 | -$165,576 | -4.06% |
| 2023 | $3,536,808 | $4,051,696 | -$514,888 | -12.71% |
| 2024 | $3,291,835 | $3,774,683 | -$482,847 | -12.79% |
999-year/freehold
| Year | New Sale | Sub sale and resale | Price difference | % difference |
| 2014 | $2,165,804 | $2,553,153 | -$387,349 | -15.17% |
| 2015 | $2,923,000 | $2,641,190 | $281,810 | 10.67% |
| 2016 | $2,960,500 | $2,611,898 | $348,602 | 13.35% |
| 2017 | $4,743,797 | $2,723,226 | $2,020,571 | 74.20% |
| 2018 | $3,302,368 | $2,869,749 | $432,619 | 15.08% |
| 2019 | $4,056,083 | $2,984,719 | $1,071,364 | 35.89% |
| 2020 | $4,361,553 | $2,734,399 | $1,627,154 | 59.51% |
| 2021 | $3,983,282 | $3,326,894 | $656,388 | 19.73% |
| 2022 | $3,929,486 | $3,905,135 | $24,352 | 0.62% |
| 2023 | $3,312,765 | $3,625,148 | -$312,382 | -8.62% |
| 2024 | $4,166,220 | $4,052,475 | $113,745 | 2.81% |
In 2024, resale four-bedders cost about 14 per cent more than new launches. The data suggests this comes mainly from the 99-year leasehold segment, where resale prices have pushed noticeably higher.
To see why, let’s dig into the specific four-bedder transactions recorded in 2024.
999-year/freehold
New sale
| Project | Average price | Average $PSF | Average size (sqft) for units transacted | Transaction volume |
| STRAITS AT JOO CHIAT | $2,369,080 | $2,084 | 1136 | 2 |
| ATLASSIA | $2,776,437 | $2,236 | 1241 | 3 |
| KOON SENG HOUSE | $3,000,000 | $2,284 | 1313 | 1 |
| PARQ BELLA | $3,120,000 | $2,282 | 1367 | 1 |
| THE CONTINUUM | $3,585,563 | $2,814 | 1274 | 16 |
| MEYER BLUE | $5,129,550 | $3,229 | 1590 | 20 |
Sub sale and resale
| Project | Average price | Average $PSF | Average size (sqft) for units transacted | Transaction volume |
| BERKELEY RESIDENCES | $1,490,900 | $1,690 | 883 | 2 |
| LE CONNEY PARK | $1,741,000 | $1,444 | 1206 | 3 |
| IVORY | $2,000,000 | $1,074 | 1862 | 1 |
| J@63 | $2,200,000 | $1,877 | 1173 | 2 |
| THE RAMFORD | $2,240,000 | $1,875 | 1195 | 2 |
| THE ARIEL | $2,338,888 | $1,468 | 1593 | 1 |
| THE AMBROSIA | $2,450,000 | $1,661 | 1475 | 1 |
| THE AMARELLE | $2,500,000 | $1,733 | 1442 | 1 |
| FINLAND GARDENS | $2,700,000 | $1,568 | 1722 | 1 |
| RADIX | $2,760,000 | $1,386 | 1991 | 1 |
| TEMBELING CENTRE | $3,000,000 | $1,394 | 2153 | 1 |
| HAIG COURT | $3,200,000 | $2,065 | 1550 | 4 |
| PARK EAST | $3,290,000 | $1,671 | 1970 | 2 |
| PARC SEABREEZE | $3,330,000 | $2,090 | 1593 | 2 |
| ONE AMBER | $3,377,500 | $2,065 | 1637 | 2 |
| VERSILIA ON HAIG | $3,400,000 | $1,533 | 2217 | 1 |
| TIERRA VUE | $3,450,000 | $1,801 | 1916 | 1 |
| THE ESTA | $3,636,000 | $2,282 | 1593 | 3 |
| THE HACIENDA | $3,682,500 | $1,707 | 2159 | 2 |
| ST PATRICK’S RESIDENCES | $3,712,667 | $1,549 | 2397 | 3 |
| AMBER 45 | $4,022,500 | $2,744 | 1470 | 2 |
| THE SEA VIEW | $4,035,944 | $2,548 | 1583 | 2 |
| THE VIEW @ MEYER | $4,058,000 | $2,257 | 1798 | 1 |
| FLAMINGO VALLEY | $4,180,000 | $1,625 | 2573 | 1 |
| VERTIS | $4,200,000 | $2,001 | 2099 | 1 |
| EQUATORIAL APARTMENTS | $4,330,000 | $1,734 | 2497 | 1 |
| THE MEYERISE | $4,400,000 | $2,141 | 2056 | 2 |
| GRAND DUCHESS AT ST PATRICK’S | $4,436,667 | $1,753 | 2569 | 3 |
| MEIER SUITES | $4,514,000 | $2,036 | 2218 | 2 |
| AMBER PARK | $4,618,000 | $2,843 | 1625 | 5 |
| KING’S MANSION | $4,780,000 | $1,748 | 2734 | 1 |
| MEYER MANSION | $5,000,000 | $2,832 | 1765 | 1 |
| THE SEAFRONT ON MEYER | $5,035,600 | $2,312 | 2176 | 5 |
| PEACH GARDEN | $5,075,000 | $1,835 | 2766 | 2 |
| AALTO | $5,328,333 | $2,518 | 2120 | 6 |
| OCEAN PARK | $5,640,000 | $1,730 | 3261 | 2 |
| THE SOVEREIGN | $7,800,000 | $2,518 | 3082 | 3 |
| MEYERHOUSE | $9,280,000 | $3,124 | 2971 | 1 |
For new launches, prices in 2024 mostly sat between $2.4 million and $3.6 million, with Meyer Blue as the luxury outlier at over $5.1 million. On the resale side, the spread was far wider, from about $1.5 million at the lower end to $5.6 million at the top. This is excluding premium projects like The Sovereign and Meyerhouse, which pushed well beyond that range.
This positions most new launch four-bedders in the lower to mid range of the resale market. If your budget falls within this segment of the resale market, you already have the budget to buy new. But the key consideration is space: most resale four-bedders are much bigger compared to their new launch counterparts, even when their overall prices are close.
For buyers considering a resale alternative at a similar price point to The Continuum, Tierra Vue comes closest in terms of average pricing.
Let’s look at how their layouts compare:
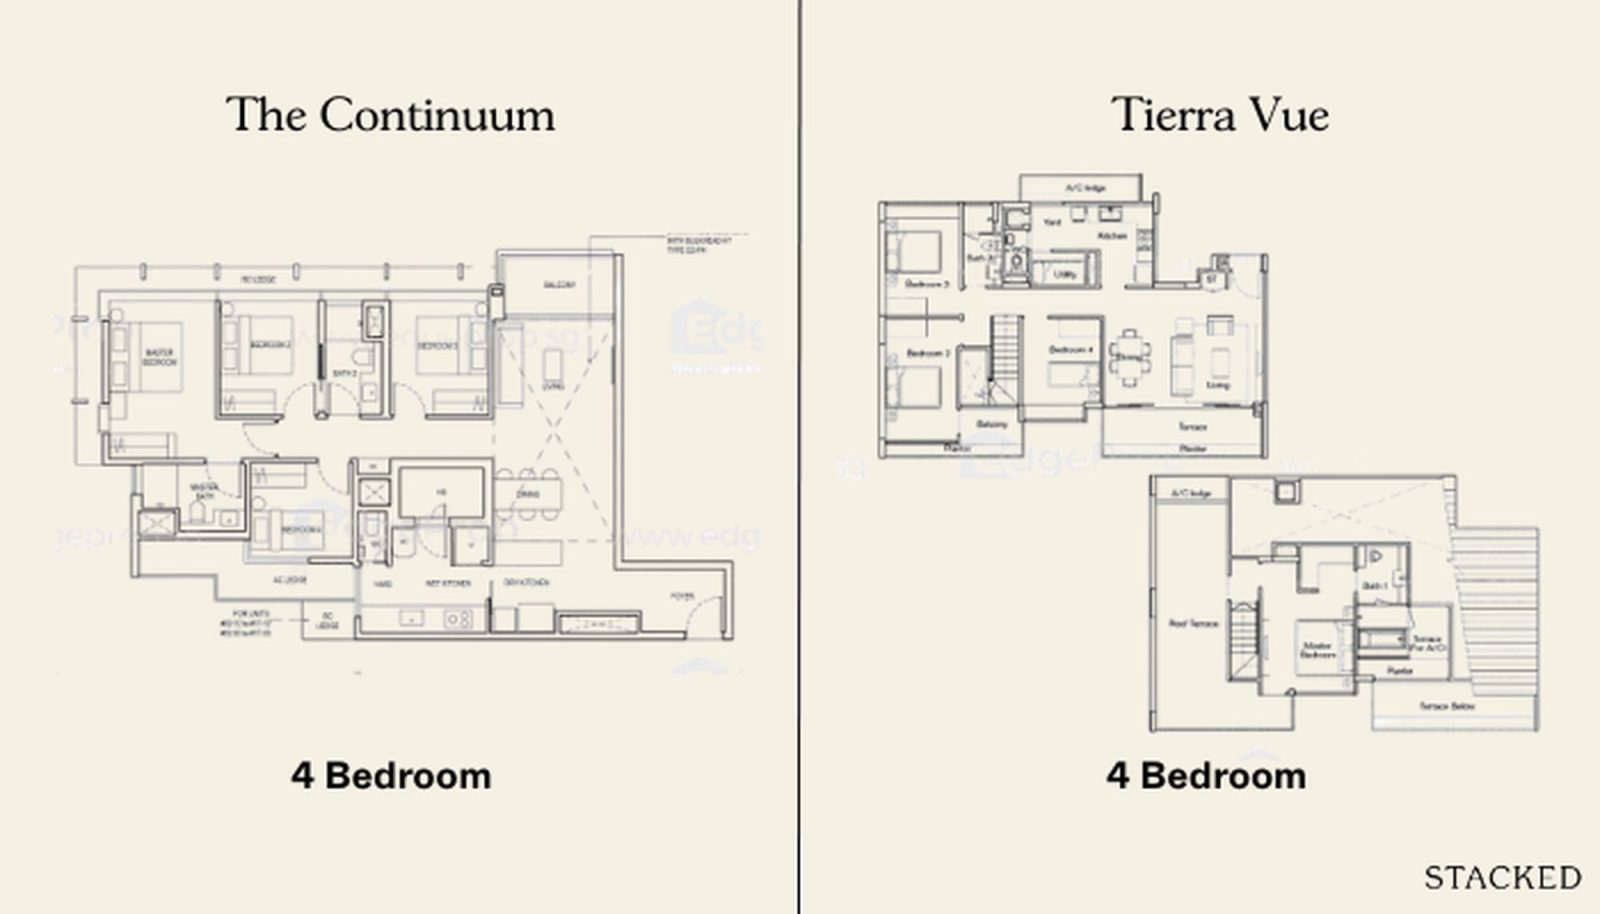
The four-bedder at Tierra Vue is noticeably larger, but much of this difference comes from outdoor space: the duplex penthouse offers a balcony and terrace on the lower floor, as well as another terrace and roof terrace upstairs.
In contrast, The Continuum’s four-bedder is a single-storey unit with just one balcony off the living area. In terms of layout, both units provide four bedrooms and two bathrooms, although The Continuum effectively has two ensuite bedrooms thanks to a Jack and Jill configuration for its common bathroom.
Both kitchens come with a yard, WC, and utility or home shelter, though The Continuum adds a dry kitchen – something Tierra Vue lacks. The Continuum also offers clearer segregation of living and dining areas, while Tierra Vue keeps both in the same shared space. While the penthouse format at Tierra Vue may appeal to those who value outdoor living and larger square footage, The Continuum’s more efficient single-storey layout, with practical touches like the dry kitchen, is likely to have broader appeal.
Let’s also take a look at the new and resale leasehold transactions done in 2024:
New sale
| Project | Average price | Average $PSF | Average size (sqft) for units transacted | Transaction volume |
| EMERALD OF KATONG | $3,180,781 | $2,552 | 1246 | 155 |
| TEMBUSU GRAND | $3,454,264 | $2,408 | 1435 | 53 |
| GRAND DUNMAN | $3,501,707 | $2,483 | 1412 | 41 |
Sub sale and resale
| Project | Average price | Average $PSF | Average size (sqft) for units transacted | Transaction volume |
| WATER PLACE | $2,385,000 | $1,594 | 1493 | 3 |
| VILLA MARINA | $2,480,000 | $1,226 | 2024 | 2 |
| SANCTUARY GREEN | $2,837,600 | $1,494 | 1942 | 8 |
| RIVEREDGE | $3,150,000 | $1,964 | 1604 | 1 |
| LAGUNA PARK | $3,600,000 | $1,069 | 3369 | 1 |
| SEASIDE RESIDENCES | $3,815,000 | $2,366 | 1609 | 2 |
| COSTA RHU | $3,872,500 | $1,728 | 2239 | 4 |
| PEBBLE BAY | $5,030,000 | $1,802 | 2788 | 2 |
| CAMELOT BY-THE-WATER | $5,400,000 | $1,529 | 3531 | 1 |
| SILVERSEA | $5,864,000 | $2,001 | 2928 | 5 |
In 2024, new launches like Emerald of Katong, Tembusu Grand, and Grand Dunman sat squarely in the mid-range of the resale market. Their $PSF was consistently higher, but resale projects were larger, keeping to the familiar pattern.
Of the ten resale projects transacted, six recorded higher average prices than Grand Dunman, the most expensive new launch. As such, buyers with budgets in the mid-range of the resale market could just as easily consider a new launch.
For buyers weighing a resale alternative at a similar price point to Emerald of Katong and Riveredge comes closest in average pricing.
Let’s compare their floor plans:
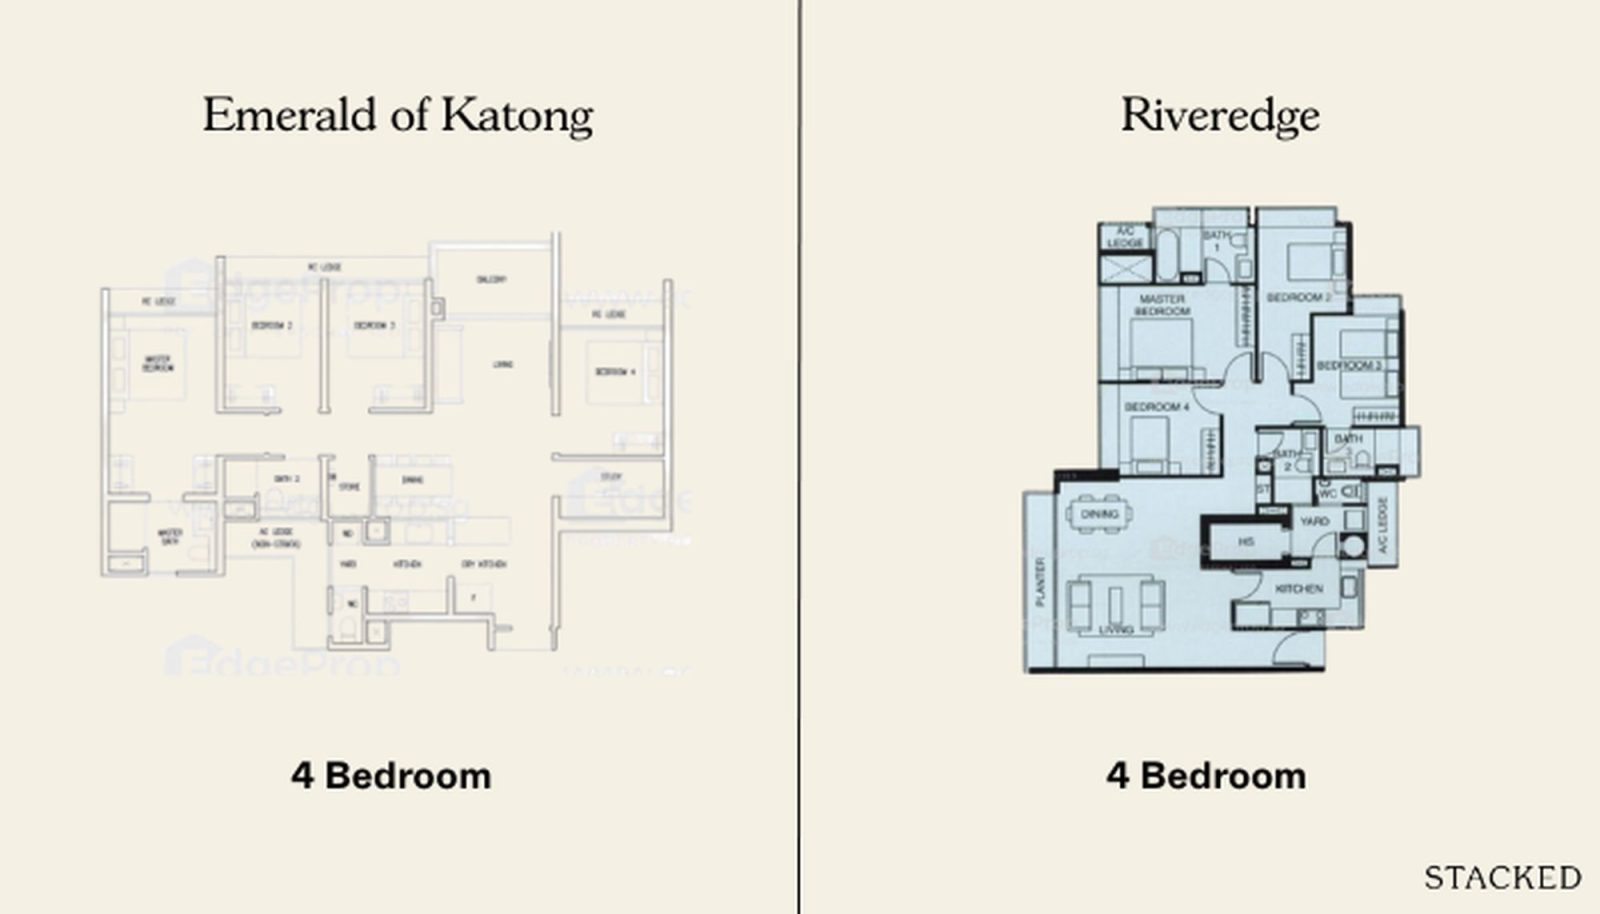
Emerald of Katong’s layout is actually a 4 + Study, while Riveredge sticks to a conventional four-bedder; but the Riveredge unit is still bigger.
For Emerald, the study is large enough to be enclosed and used as a small extra bedroom. Layout-wise, Emerald of Katong goes for a dumbbell configuration, while Riveredge takes the traditional corridor approach. This makes Emerald more efficient, which is expected of a newer layout.
Emerald of Katong comes with two bathrooms and just one ensuite, while Riveredge offers three bathrooms and two ensuites.
In the living spaces, Emerald separates the living and dining areas, with the living flowing onto a balcony. Riveredge places its living and dining side by side, but swaps the balcony for a planter. Both kitchens are enclosed and include a yard and WC, though Riveredge adds a home shelter. Emerald tucks in a store near the bedroom walkway and even manages a dry kitchen, something Riveredge doesn’t have.
Every bedroom in Riveredge comes with bay windows unfortunately, which chew up usable space. Together with the planter, there’s definitely wasted square footage. Emerald of Katong, on the other hand, is newer and more efficient.
As for the five-bedders, we run into the usual issue of low transaction volumes.
There was only one resale transaction for leasehold developments in 2017; so we will just look at freehold projects instead:
999-year/freehold
| Year | New Sale | Sub sale and resale | Price difference | % difference |
| 2014 | $1,735,167 | $7,350,000 | -$5,614,833 | -76.39% |
| 2015 | $1,590,000 | $2,794,444 | -$1,204,444 | -43.10% |
| 2016 | $2,363,667 | $2,818,688 | -$455,021 | -16.14% |
| 2017 | $2,371,000 | $3,453,200 | -$1,082,200 | -31.34% |
| 2018 | $2,393,000 | $4,433,167 | -$2,040,167 | -46.02% |
| 2019 | $5,587,656 | $2,325,250 | $3,262,406 | 140.30% |
| 2020 | $5,562,660 | $3,136,444 | $2,426,216 | 77.36% |
| 2021 | $5,555,000 | $4,998,889 | $556,111 | 11.12% |
| 2022 | $4,953,474 | $5,100,000 | -$146,526 | -2.87% |
| 2023 | $5,315,551 | $6,020,000 | -$704,449 | -11.70% |
| 2024 | $6,349,487 | $4,256,000 | $2,093,487 | 49.19% |
The price gap in 2024 was just seven per cent on paper, but this is misleading. The presence of new 99-year leasehold projects – with lower launch prices – dragged down the average for new sales, making the gap appear narrower than it really is.
Once again, we need to caution against reading too much into five-bedder numbers. Because these very high-priced transactions are so rare and volatile, they aren’t representative of much.
But for the sake of completeness if nothing else, let’s look into the actual freehold five-bedder transactions recorded in 2024.
999-year/freehold
New sale
| Project | Average price | Average $PSF | Average size (sqft) for units transacted | Transaction volume |
| STRAITS AT JOO CHIAT | $3,051,300 | $2,100 | 1453 | 1 |
| K SUITES | $3,400,000 | $2,064 | 1647 | 1 |
| THE CONTINUUM | $5,470,000 | $2,871 | 1905 | 1 |
| MEYER BLUE | $6,943,417 | $3,325 | 2083 | 12 |
Sub sale and resale
| Project | Average price | Average $PSF | Average size (sqft) for units transacted | Transaction volume |
| THE RAMFORD | $2,600,000 | $1,579 | 1647 | 1 |
| ST PATRICK’S RESIDENCES | $3,668,000 | $1,432 | 2562 | 1 |
| AMBER PARK | $6,500,000 | $2,783 | 2336 | 1 |
On the surface, new and resale five-bedders traded in a fairly similar price band in 2024, aside from The Ramford which came in lower. The apparent gap in averages was mainly the result of Meyer Blue. Because Meyer Blue had more transactions than the other projects, and two deals above $10 million, its higher quantum skewed the overall new launch average upward.
A floor-plan comparison for five-bedders wouldn’t be useful to do. Apart from the very low transaction numbers, units at this price point also tend to be special or one-of-a-kind within their project, so meaningful insights are unlikely.
Conclusion
Three-bedders in D15 show the narrowest gaps today, with resale units even edging out new launches in long-term growth. This is partly due to many older three-bedders being larger than their newer counterparts.
We see this more dramatically with four-bedders, which highlight how sheer size can swing the balance: many resale units are much larger, which pushes their overall quantum significantly above new launches; even if the $PSF is lower.
For family buyers, this means resale options in District 15 can be strong contenders if you value space, utility rooms, and bigger layouts; these tend to be more scarce in new projects. However, newer layouts aren’t just more efficient – their lower square footage tends to make them more affordable, alongside newer facilities; and this may appeal to buyers who prize more than just space.
Either way, the big lesson from three-bedders and up is that the choice isn’t as straightforward as “new versus old.” It’s about which trade-offs – space versus efficiency, or age versus tenure – that make the most sense for your long-term goals.
The challenge with family-sized units in D15 isn’t just price, it’s knowing which trade-offs actually align with your lifestyle and exit strategy. Too many buyers focus only on $PSF or overall quantum, but the deeper issue is how layout efficiency, tenure, and long-term liveability interact. At Stacked, we’ve helped families navigate this exact dilemma to secure homes that balance size with value, and avoid costly mismatches down the line. Want to see how this framework applies to your own upgrading plans? Let’s chat.
Follow us on Stacked Pro, as we do more deep dives into the new launch/resale price gap in the Singapore property market.