
An alternative series to the ONS’s Labour Force Series based on tax data and ONS population data
08 May 2025
Overview
Since the onset of the Covid-19 pandemic, significant issues have emerged with the ONS’s Labour Force Survey (LFS), which is the main source of the UK’s official labour market data. These issues have been picked up not only by us, but also by the Bank of England, the Office for Budget Responsibility and the ONS itself. Survey response rates collapsed and trends in employee numbers in the LFS diverged significantly from those in monthly payroll data and employer surveys, while estimates of self-employment dropped below those implied by tax data.
In response to these concerns, we have developed alternative employment estimates – going back to 2014 – based primarily on HMRC tax data (giving an estimate of employment), and on the ONS’s population estimates (giving the denominator, which can then be used to calculate an employment rate). These figures also have the advantage of being more timely than the LFS.
Latest estimates
Using the latest data available, we estimate:
- A 16+ employment rate of 61.2% in January 2025 (compared to an LFS estimate of 60.6% for the three months from December to February). Our rate falls to 60.0% by March 2025 based on ‘flash’ payroll estimates but these are prone to revision.
- A 16 to 64 employment rate of 75.5% in January 2025 (compared to an LFS estimate of 75.1% for the three months from December to February). Our rate falls to 75.2% by March 2025 based on ‘flash’ payroll estimates but these are prone to revision.
Larger differences are estimated for much of 2021 to 2024. As the charts below show, we believe the UK employment rate recovered rapidly after the pandemic, returning to pre-pandemic highs – in contrast to LFS trends. But since 2023 the employment rate has been falling, again often contrary to LFS trends which may partly reflect a recovery of LFS accuracy.
Figure 1: Analysis of tax data gives a 16-64 employment rate of 75.5%: higher than the LFS but down over the past two years
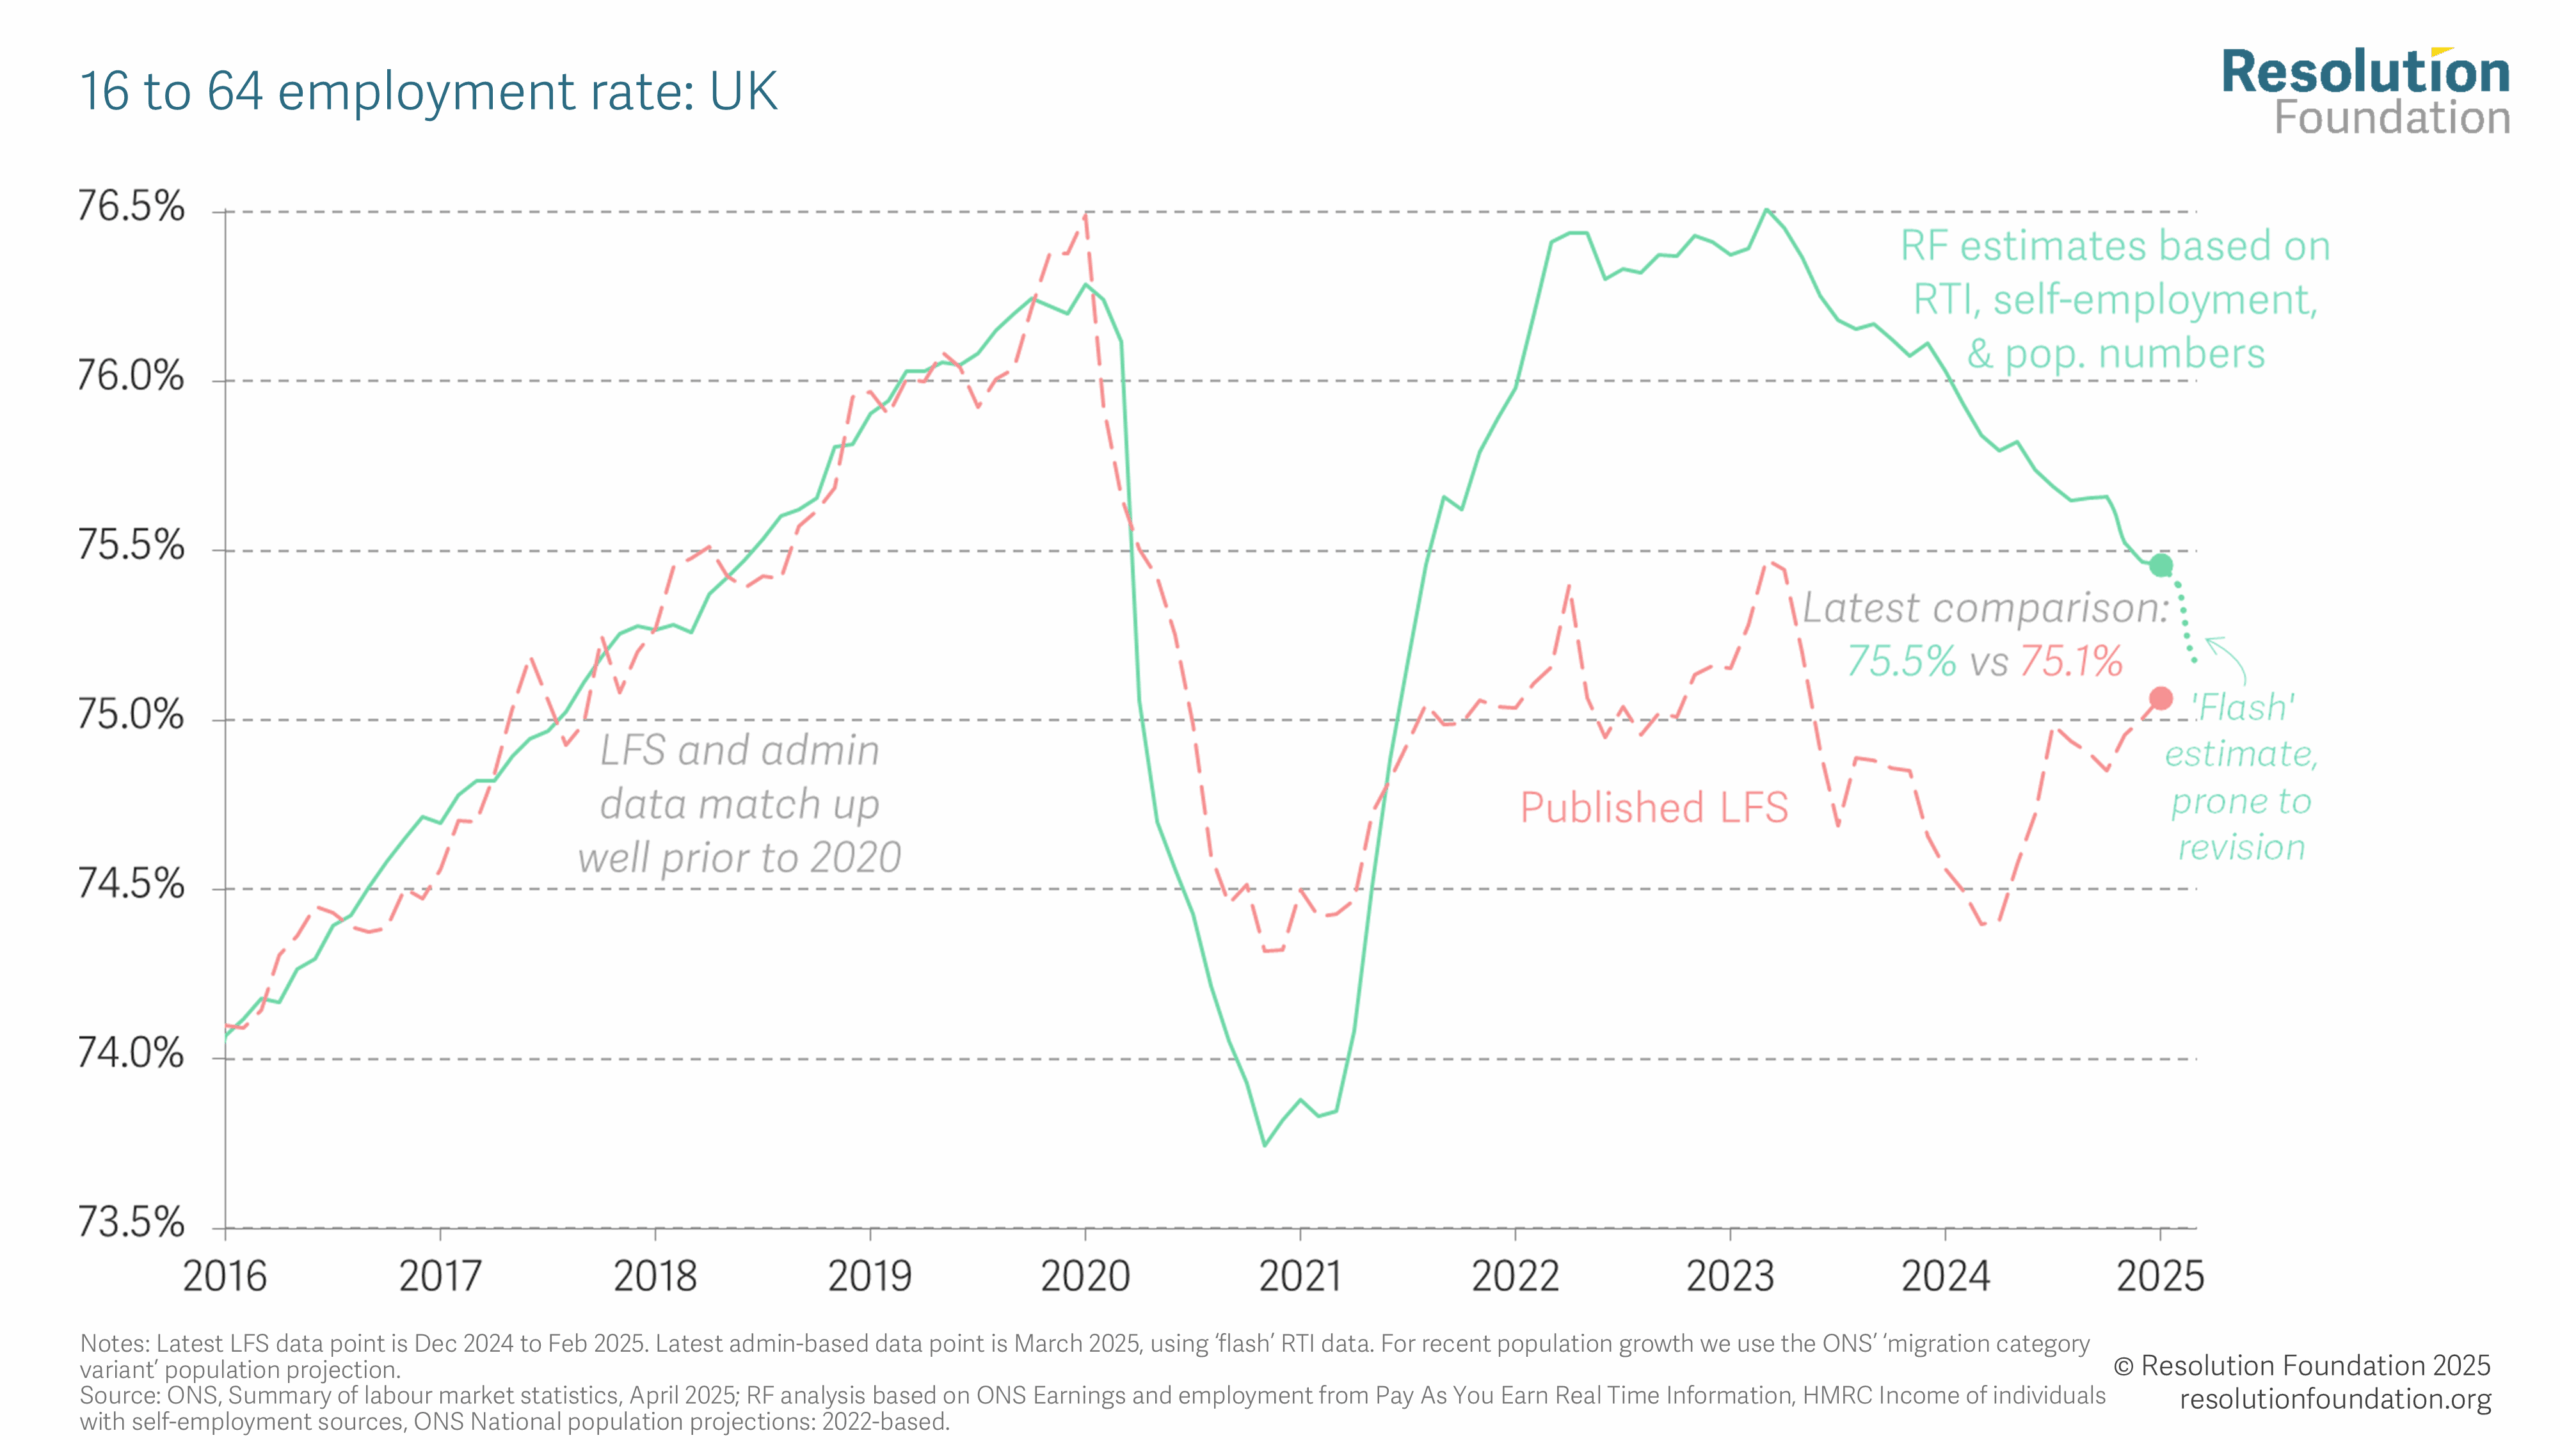
Figure 2: Analysis of tax data gives a 16+ employment rate of 61.2%: higher than the LFS but down over the past two years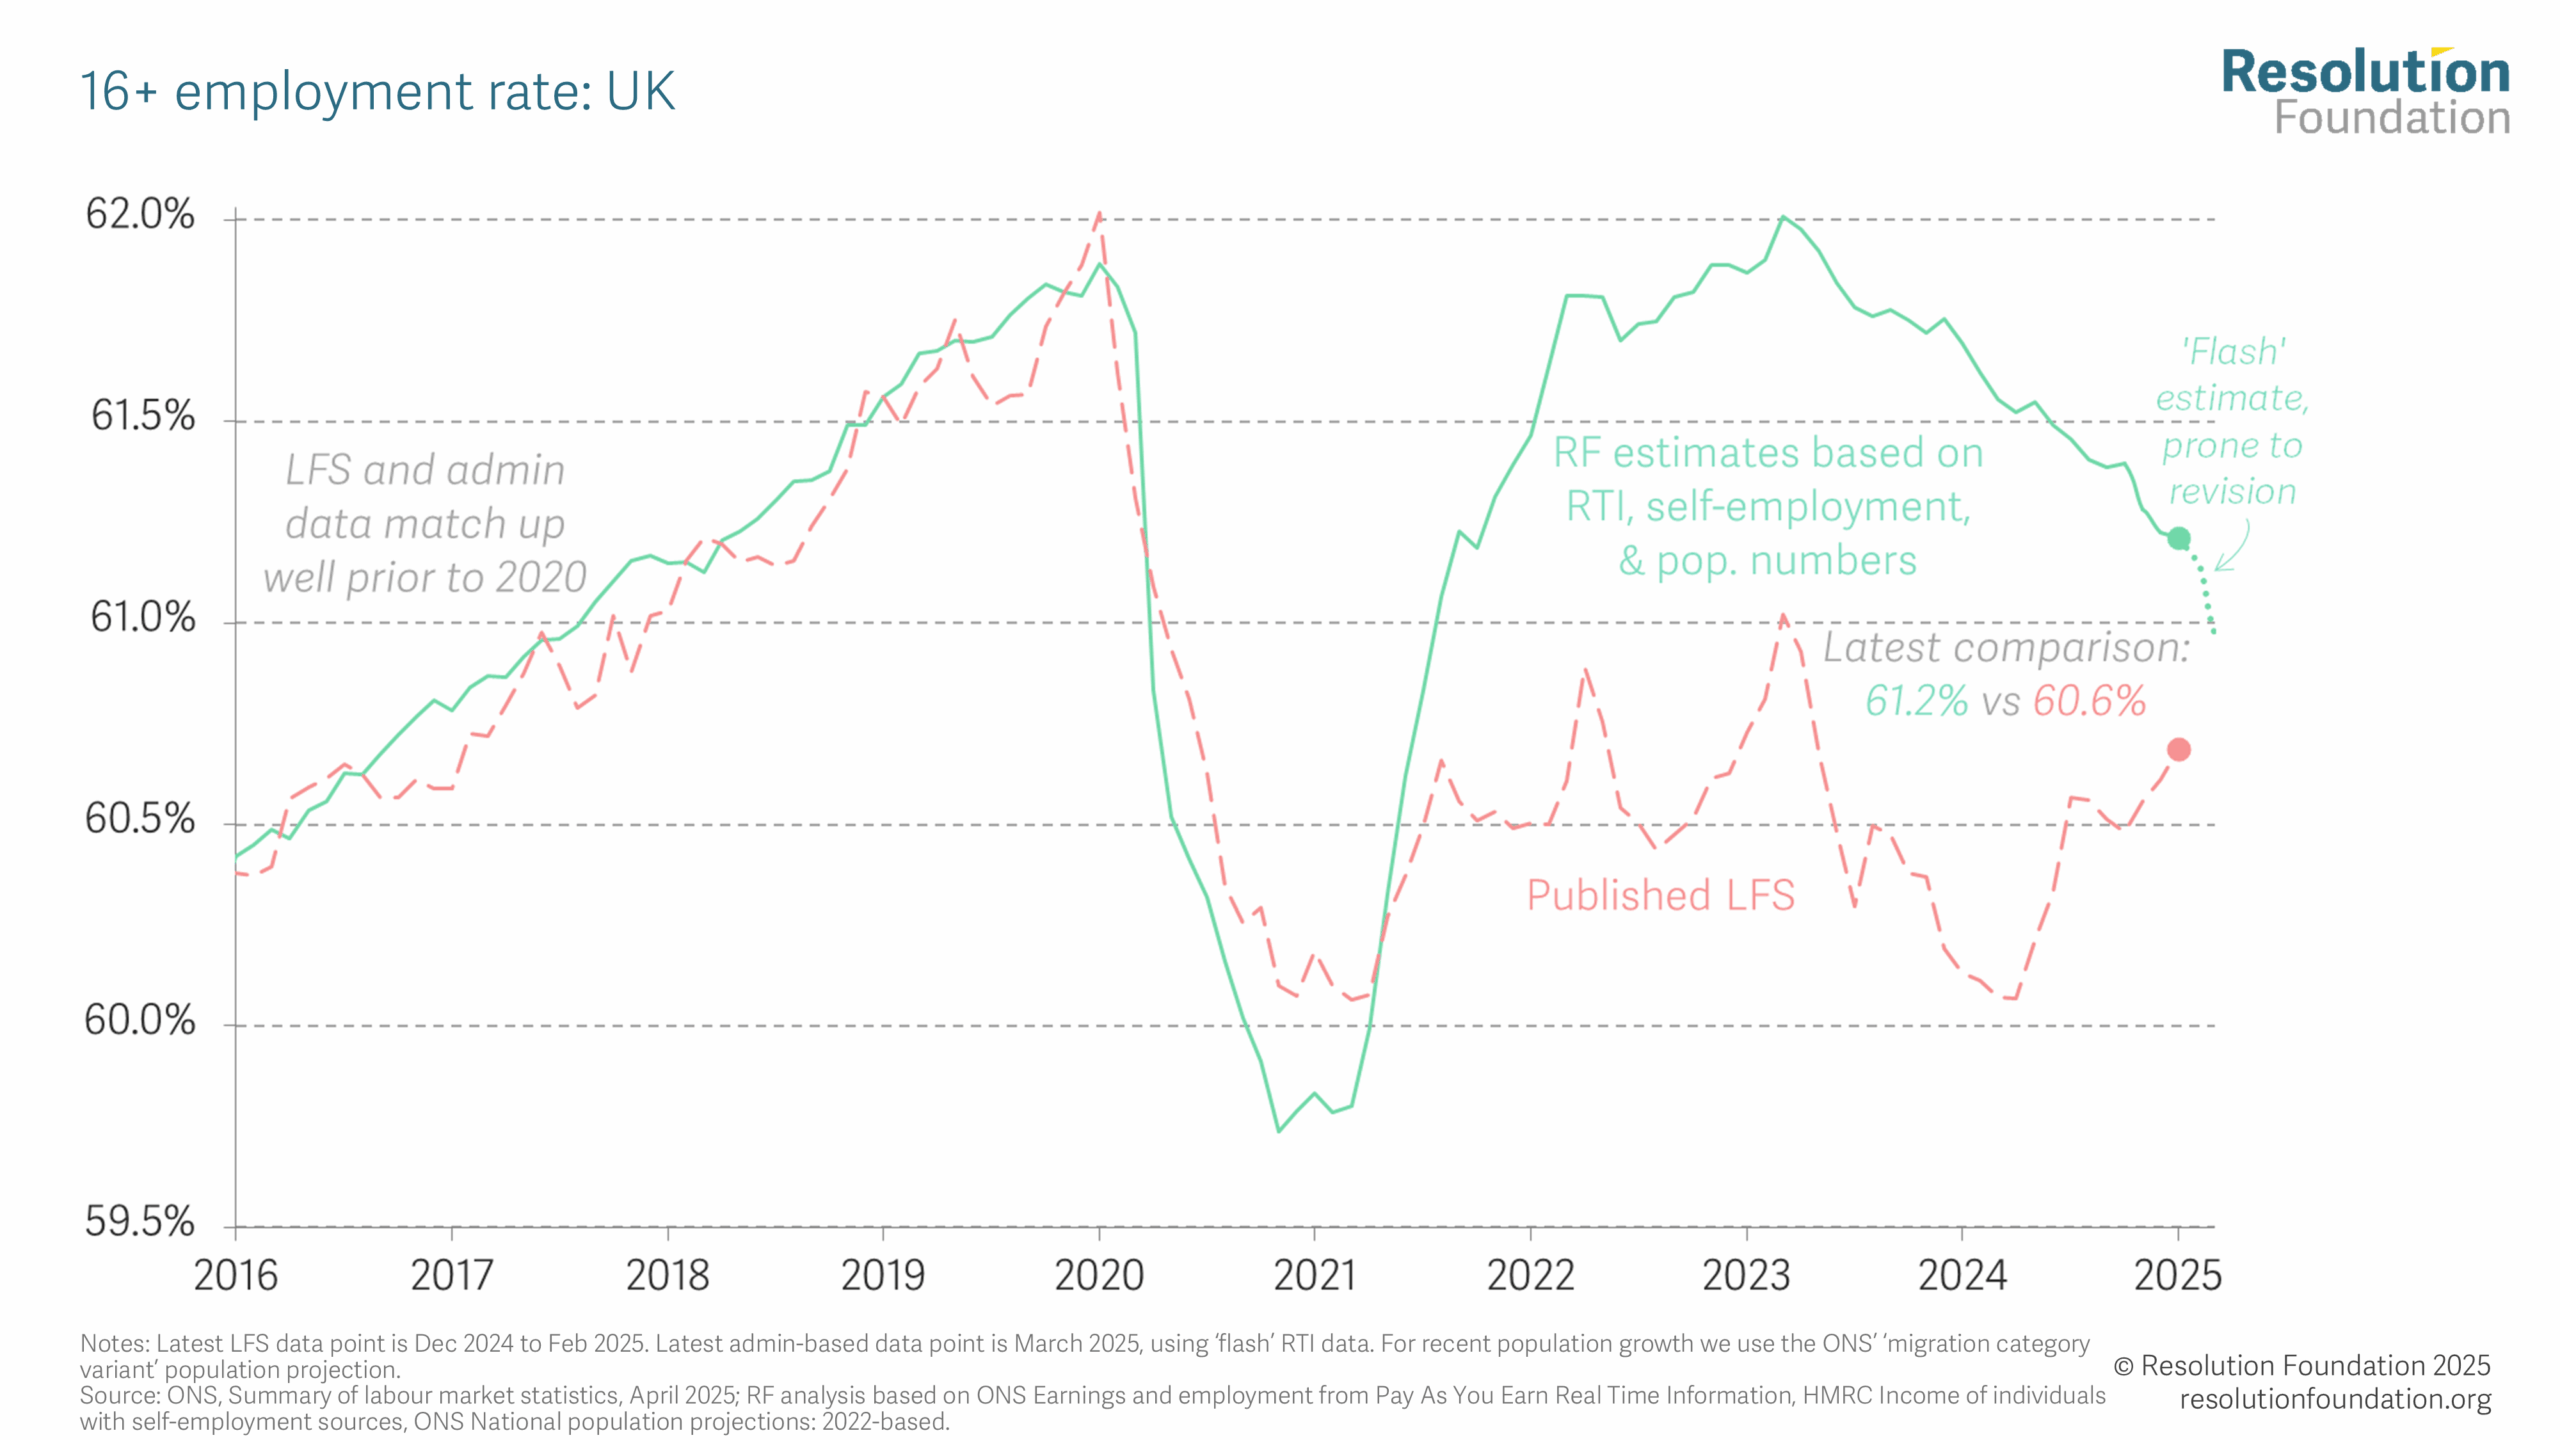
FAQ
How (briefly) is our series calculated?
Our alternative employment estimates are based on HMRC tax data (giving an estimate of employment and self-employment) and the ONS’s population estimates (giving the denominator, which can then be used to calculate an employment rate). To avoid double counting we subtract an estimate of the number of people who have both employee and self-employed earnings. In order to align with LFS concepts, we subtract an estimate of the (small) number of people who appear in the tax data but who wouldn’t be in the LFS sample, and add on an estimate of the number of workers who wouldn’t appear in the tax data but who would be found in the LFS. For more detail, see the methodology section below.
What’s wrong with the Labour Force Survey estimates?
The Labour Force Survey (LFS) has been used for decades to produce official labour market statistics for the UK – the employment and unemployment rates, for example. However, since 2021 there have been concerns about the estimates it is producing because it has shown a different trend to other, related data sources. Both the ONS’s ‘Workforce Jobs’ data (which is mainly based on a survey of businesses) and HMRC’s ‘PAYE Real Time Information’ dataset (which counts the number of employees in the payroll tax system) indicated a stronger recovery in employment after the pandemic than the LFS was showing. Before the pandemic, these datasets had followed a similar trend to the LFS.
There are two broad potential sources of error in the ONS’s Labour Force Survey (LFS) employment estimates.
- One is that people who are employed may have become disproportionately less likely to respond to the survey than those who are not employed. If differential non-response was driven by regional, age, sex, or housing tenure differences, the survey’s weighting procedure would correct for this. But it can’t correct for differences in response rates within those groups. So, for example, if employed men aged 30 to 34 living in private rented accommodation in London have become less likely to fill in the survey than non-employed men aged 30 to 34 living in private rented accommodation in London, this would lead to a lower employment rate estimate and wouldn’t be corrected by the survey’s weights.
- A second issue relates to how survey estimates are grossed up (‘weighted’) to produce population level estimates of employment and the employment rate. If the population total used in the weighting is different from the actual population, this will lead to estimates of total employment which are different from actual total employment, even if the LFS is correctly estimating the employment rate. The LFS methodology uses the ONS’s population forecasts produced by the ONS to give recent population figures. But these forecasts will not be perfect, and the population figures used within the LFS don’t necessarily incorporate the latest-available information. Issues relating to weighting mainly affect the accuracy of the estimate of the number of people in employment, but they can also affect the accuracy of the employment rate if the weights used are wrong about the relative size of different population subgroups.
So, future revisions to population numbers may affect our estimates and/or LFS estimates; and it is possible that the number of workers in our method will be revised or is imperfect; but at present we think the most important cause of the post-pandemic divergence is uncorrected LFS bias.
What are the biggest sources of uncertainty?
Payroll data for the most recent data points in particular may be revised, but overall this is an invaluable data source. Self-employment data is more limited and – due to reporting lags – we have no such data beyond 2023-24 except for the LFS itself. Estimates of the recent population will inevitably be revised but at present we are not aware of any known bias in the figures we use. Finally, estimates of the number of temporary foreign workers or tax ‘ghosts’ (see methodology) are particularly uncertain, but at present there is no evidence to suggest these play a role in driving the divergence.
In short, our time series will change each month as various data is revised, but the overall disagreement in post-pandemic estimates (particularly for 2022 and 2023) is very large and has been robust in the face of many rounds of revisions. Future LFS revisions, the separate ‘Transformed LFS’ and further research using administrative data will hopefully help reconcile the sources over the coming years.
What does this mean for the unemployment rate and inactivity rate?
Our methodology doesn’t allow us to independently estimate the unemployment rate or the ‘inactivity’ rate, because those rely on knowing not just whether someone is not working, but whether they are looking for work and available to work. That’s only possible with survey data.
However, a higher employment rate must mean some combination of lower inactivity and lower unemployment. And we can explore plausible splits using simplistic assumptions, such as that the LFS is right about the relative split between inactivity and unemployment, even if it is wrong about their overall levels. This is unlikely to be true precisely, but such examples can still provide insights. In particular, unless the unemployment rate fell to very extreme lows post-pandemic, we have previously showed that our employment rate estimates would significantly reduce the rise in overall economic inactivity rates between 2019 and 2022: see our ‘Get Britain’s Stats Working’ briefing note from November 2024.
That note also set out how these conclusions could still be consistent with benefit caseload trends. First, increases in the receipt of disability-related and incapacity-related benefits do not require a fall in employment rates: many people receiving those benefits are in work, while many people who are not in work are not receiving those benefits. Second, that paper shows that even without an overall rise in inactivity, inactivity due to long-term sickness specifically can have risen a lot given a change in the make-up of the economically inactive group (plus population growth). Much of the rise in long-term sickness appears to have been offset by falls in the numbers of people inactive due to ‘looking after family/home’ or due to retirement under the age of 65.
Detailed methodology
- Up to mid-2022, we use the same 16+ and 16-64 private household populations as in the published LFS numbers. Beyond this we grow these populations in line with the ONS’s National population projections: 2022-based – in particular their Migration Category Variant (which the OBR also uses as the most plausible projection). This is more up to date than the LFS which currently uses 2021-based population projections. Both the LFS and adjusted population series are included in our Excel file above.
- Our crucial starting point for the number of workers is ONS/HMRC Real Time Information (PAYE) data on the number of employees. (Note this is the number of people: not the number of separate jobs.) We use seasonally adjusted data. As RTI data is not published for ages 16+ specifically, we use FOI data to deduct an estimate of employees under 16. It is not known how many employees in the RTI data might be living overseas (e.g. on military bases), but we do not believe this is a significant factor.
- To align more closely with LFS definitions, we subtract ONS estimates of ‘temporary foreign workers’, ‘armed forces not living in private accommodation’ and ‘workers living in communal establishments‘.
- While administrative tax data will include most workers who earn too little to pay tax, it is possible that there are ‘ghosts’ whose work is not known to HMRC but who could (in theory) appear as workers in the LFS. By the nature of this group, little data is available at present. We add a fixed number of around 370,000 to minimise the overall levels difference between our 16-64 employment estimates and those in the LFS in the 3 years prior to the Covid-19 pandemic, to aid comparison of post-pandemic trends.
- For self-employment, our key numbers are from HMRC statistics. We deduct those people who have both self-employment and employment income, to avoid double counting. Beyond 2022-23 we use FOI numbers for growth in 2023-24 and – in the absence of any other solid data – assume no change beyond that. We assume none of the self-employed are under 16, and use Annual Population Survey data on the share who are age 65+. Financial year totals are smoothed into a monthly series.
- We straightforwardly add the LFS number of unpaid family workers.
- We add LFS estimates of those on ‘Government supported training & employment programmes’, but deduct a shifting proportion that we think will be in the PAYE data (e.g. on the Kickstart Scheme) to avoid double counting, based on receipt of pay in the LFS microdata.
- The combination of steps 2-7 above gives our total number of workers, and dividing this by the population from step 1 gives our employment rate estimate.
For any further details or data, please contact [email protected]


