Incoming Foreign Direct investment in USA

Want this Map?
Subscribe and download ultra-high resolution maps!
| Rank | Region name | billions USD |
|---|---|---|
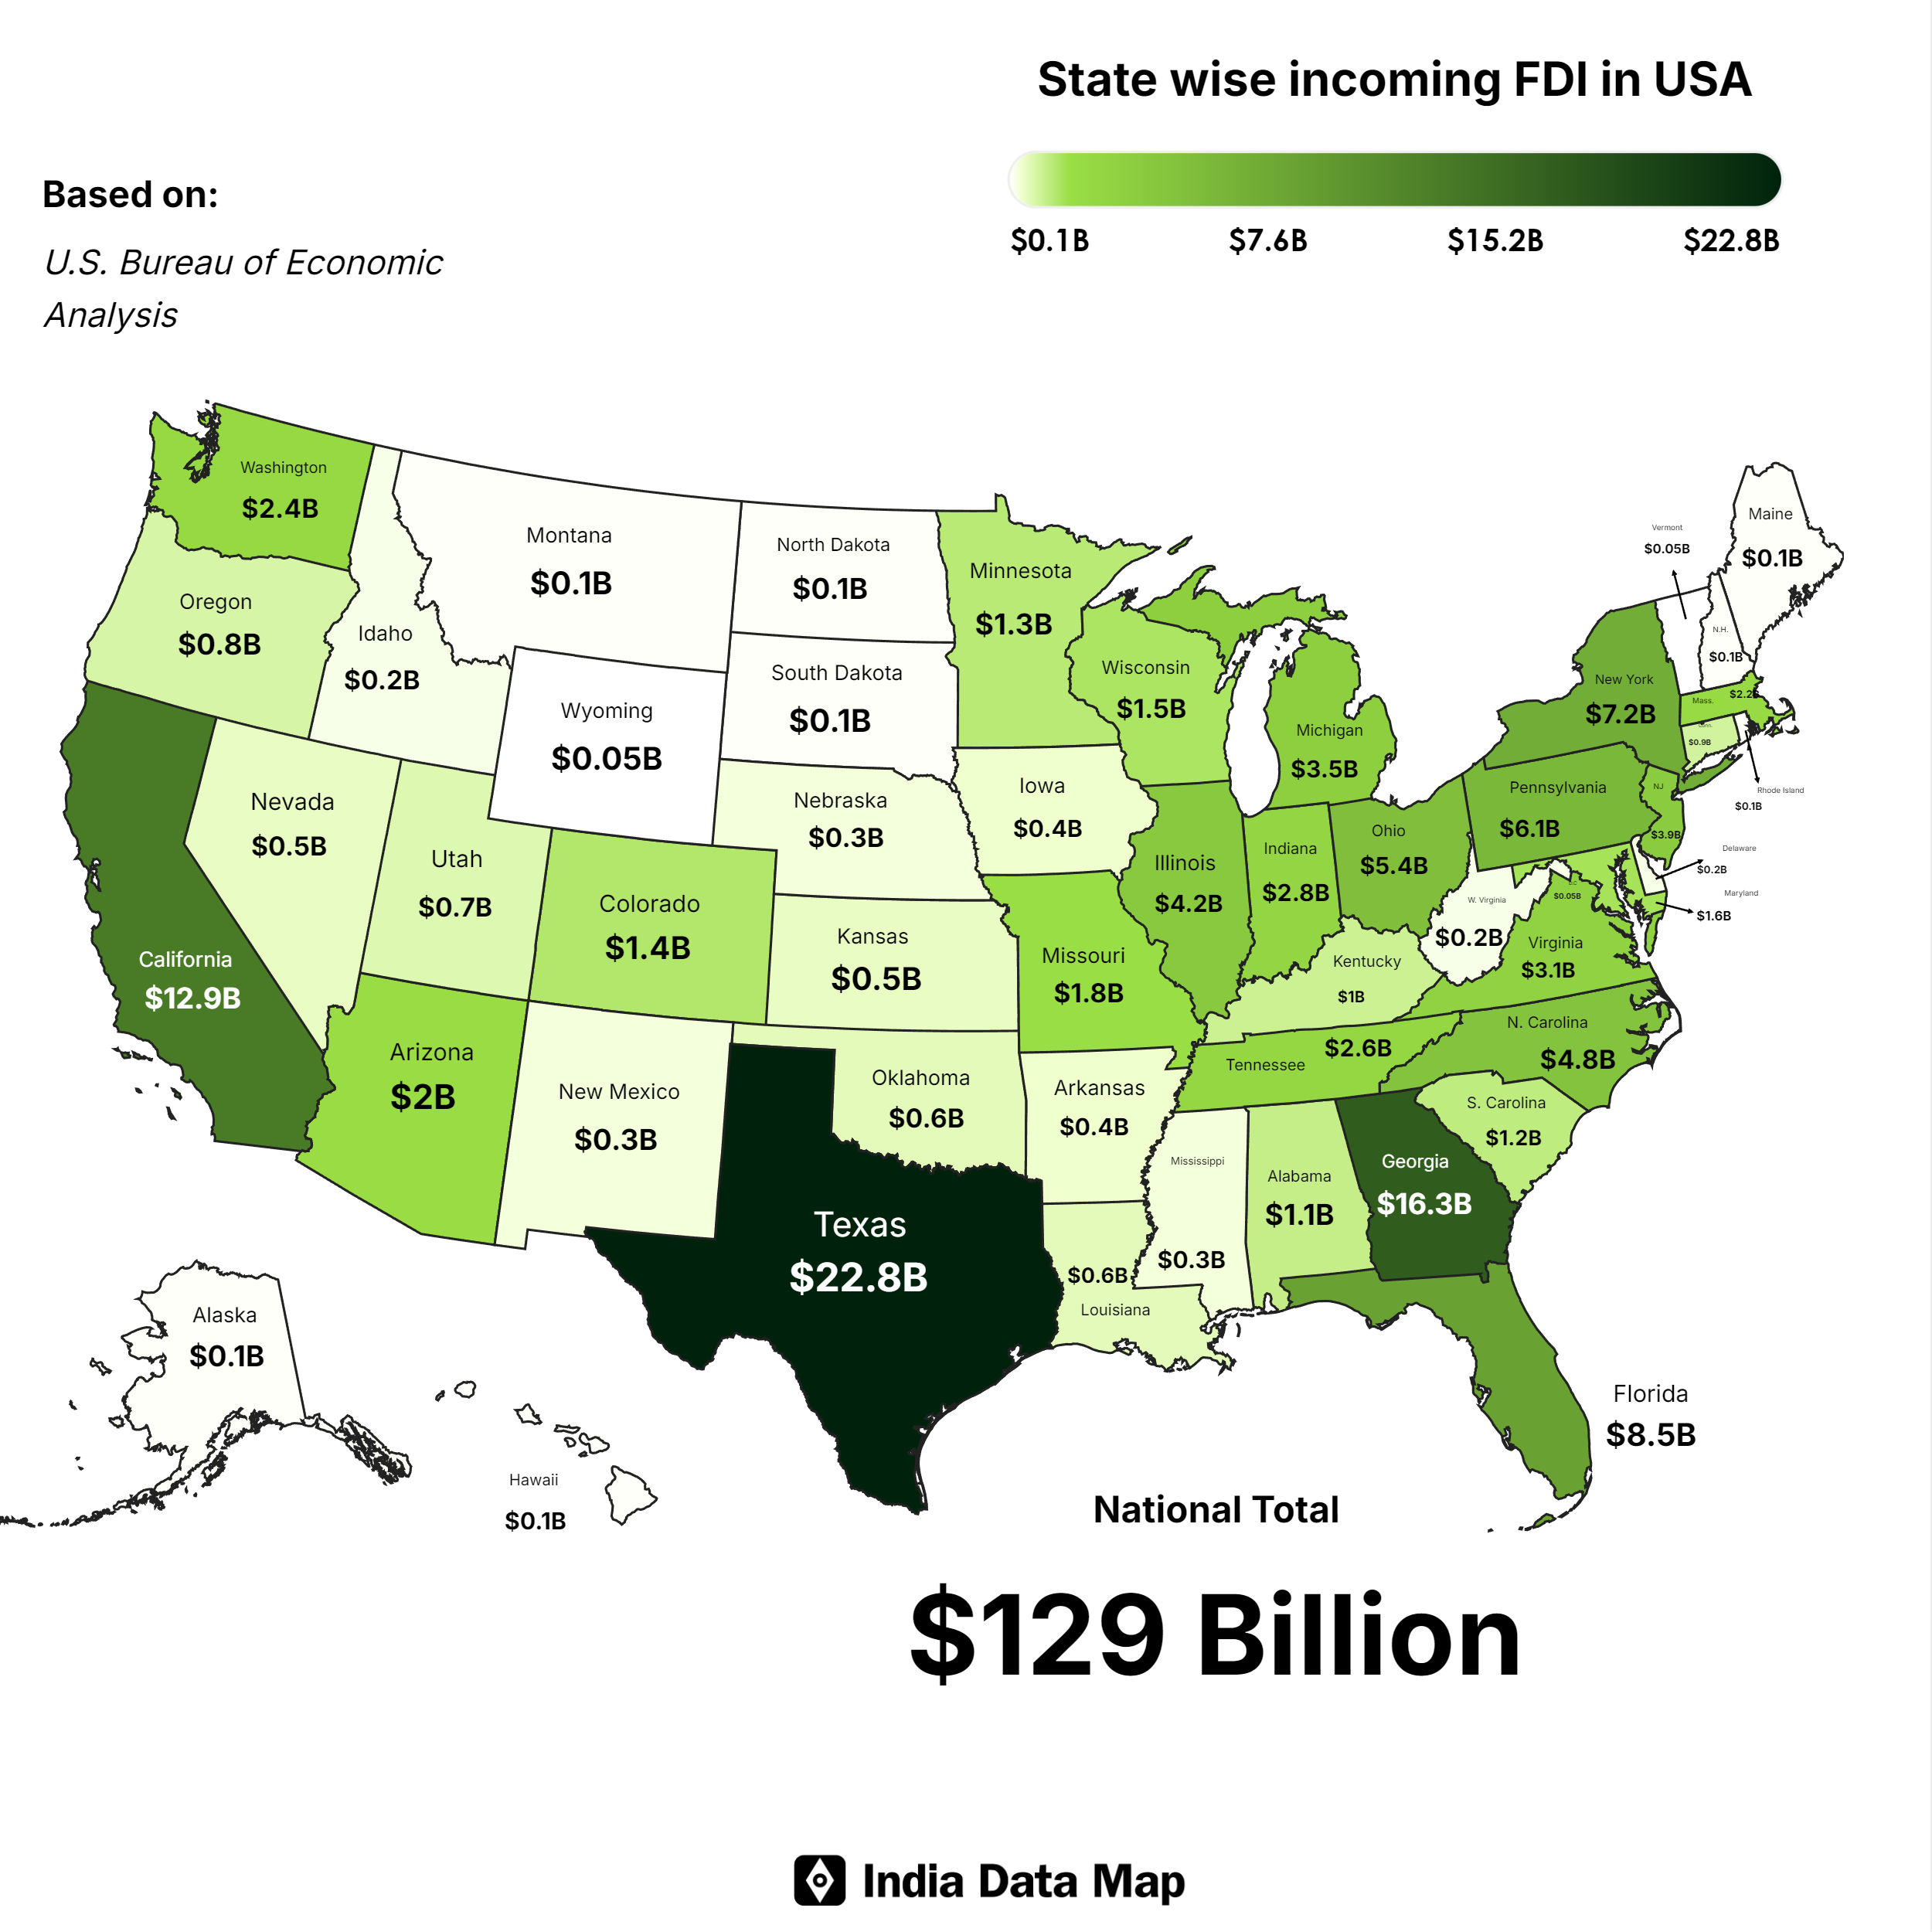
| 1 | Texas | 22.8 |
| 2 | Georgia | 16.3 |
| 3 | California | 12.9 |
| 4 | Florida | 8.5 |
| 5 | New York | 7.2 |
| 6 | Pennsylvania | 6.1 |
| 7 | Ohio | 5.4 |
| 8 | North Carolina | 4.8 |
| 9 | Illinois | 4.2 |
| 10 | New Jersey | 3.9 |
| 11 | Michigan | 3.5 |
| 12 | Virginia | 3.1 |
| 13 | Indiana | 2.8 |
| 14 | Tennessee | 2.6 |
| 15 | Washington | 2.4 |
| 16 | Massachusetts | 2.2 |
| 17 | Arizona | 2.0 |
| 18 | Missouri | 1.8 |
| 19 | Maryland | 1.6 |
| 20 | Wisconsin | 1.5 |
| 21 | Colorado | 1.4 |
| 22 | Minnesota | 1.3 |
| 23 | South Carolina | 1.2 |
| 24 | Alabama | 1.1 |
| 25 | Kentucky | 1.0 |
| 26 | Connecticut | 0.9 |
| 27 | Oregon | 0.8 |
| 28 | Utah | 0.7 |
| 29 | Oklahoma | 0.6 |
| 30 | Louisiana | 0.6 |
| 31 | Nevada | 0.5 |
| 32 | Kansas | 0.5 |
| 33 | Arkansas | 0.4 |
| 34 | Iowa | 0.4 |
| 35 | Mississippi | 0.3 |
| 36 | New Mexico | 0.3 |
| 37 | Nebraska | 0.3 |
| 38 | Delaware | 0.2 |
| 39 | West Virginia | 0.2 |
| 40 | Idaho | 0.2 |
| 41 | Alaska | 0.1 |
| 42 | Hawaii | 0.1 |
| 43 | Montana | 0.1 |
| 44 | Maine | 0.1 |
| 45 | New Hampshire | 0.1 |
| 46 | Rhode Island | 0.1 |
| 47 | North Dakota | 0.1 |
| 48 | South Dakota | 0.1 |
| 49 | Vermont | 0.05 |
| 50 | Wyoming | 0.05 |
| 51 | District of Columbia | 0.05 |
Foreign direct investment (FDI) inflows signify new capital that international entities allocate to U.S. operations via acquisitions, new establishments, or expansions. In 2024, the total new FDI reached $151 billion, a decrease from previous years but still notable amid the global economic recovery.
Texas leads the state rankings with $22.8 billion, underscoring a shift towards energy, manufacturing, and logistics hubs. This table illustrates the patterns of 2024 and offers insights into the economic attractiveness of various states.
In-Depth Analysis of FDI trends
Texas ranks first with $22.8 billion in incoming FDI for 2024. Investors are drawn to Texas due to its extensive energy sector, favorable business regulations, low tax rates, and strategic location for logistics.
The manufacturing and utilities sectors attract significant investments, particularly from European and Canadian sources.
Georgia closely follows with $16.3 billion, propelled by its expanding role in aerospace, film production, and electric vehicle supply chains. The international airport in Atlanta and its skilled workforce entice companies looking to expand in the Southeast.
California comes in third with $12.9 billion. The state’s tech innovation, Hollywood influence, and ports continue to attract investment despite high costs.
Foreign companies are particularly interested in software, biotech, and entertainment, with a notable presence of Asia-Pacific investors.
Florida ranks fourth with an estimated $8.5 billion, benefiting from a rebound in tourism, real estate, and the absence of a state income tax. The influx of retirees and connections to Latin America enhance inflows into the services and finance sectors.
New York and Pennsylvania maintain strong positions due to their financial services and industrial revitalization. New York draws investments in banking and media, while Pennsylvania benefits from a resurgence in manufacturing and infrastructure projects.
Midwestern states such as Ohio, Illinois, and Michigan experience solid inflows from the automotive and machinery industries. Their historical industrial foundations and skilled labor pools contribute to their attractiveness.
Southern states like North Carolina, Tennessee, and South Carolina enjoy lower operating expenses and right-to-work legislation. These elements promote migration from areas with higher costs.
In contrast, Northeastern states such as Massachusetts and New Jersey attract investments in pharmaceuticals and finance due to their prestigious universities and closeness to markets.
Western states, including Washington, Colorado, and Arizona, experience growth in technology and renewable energy sectors. Washington benefits from the presence of major aerospace companies, while Arizona capitalizes on its semiconductor industry.
Smaller states such as Iowa, Kansas, and Nebraska draw foreign direct investment (FDI) in agribusiness and food processing, thanks to their abundant natural resources.
States that rank lower, particularly those in the Plains and Northeast, see limited inflows of less than $1 billion. Their appeal is hampered by factors like small populations, inadequate infrastructure, or a lack of industry focus. Wyoming and New Mexico exhibit potential for greenfield investments in energy, yet overall investment volumes remain low.
Various factors influence these trends. The size of the economy and access to markets favor larger states. The regulatory environment, including tax incentives, significantly impacts investment decisions.
Industry clusters foster specialization, with energy concentrated in Texas, technology in California, and manufacturing in the Midwest.
Global developments, such as the nearshoring of supply chains and transitions to green energy, will affect distributions in 2024. Projections for smaller states depend on maintaining consistent shares from previous years amid national economic slowdowns.
In summary, foreign direct investment tends to concentrate in states that provide scale, skilled labor, and attractive incentives. This distribution not only bolsters regional economies but also supports job creation across the country.
Based on:
Discover more from India Data Map
Subscribe to get the latest posts sent to your email.