

This content is provided by Saltydog Investor. It is a third-party supplier and not part of interactive investor. It is provided for information only and does not constitute a personal recommendation.
This year got off to a reasonable start, with nearly all the major stock markets that we follow making gains in January. However, in February and March, most of them went down as investors grew increasingly concerned about tariffs imposed by the US on countries such as China, Canada and Mexico.
The situation deteriorated further at the beginning of April following Donald Trump’s so-called Liberation Day, when he announced a minimum tariff of 20% on all goods entering the US, with some countries having to pay significantly more.
In the first few days of April, the FTSE 100 fell by 6.1%, and the FTSE 250 lost 5.7%. There were larger losses on the Continent, with the French CAC 40 falling by 6.6% and the German DAX dropping by 6.9%. The situation was even more severe in the US, where the Dow Jones Industrial Average went down by 8.8%, the S&P 500 fell by 9.6% and the Nasdaq lost 9.9%.
Trump then announced a 90-day suspension of tariffs for countries that had not retaliated and markets started to recover. The S&P 500 jumped by 9.5% – its third-largest one-day gain since the Second World War.
Last week, all the stock market indices shown below made gains, and for many that was for the second week in a row. Despite this recovery, half are still showing month-to-date losses.
| Stock market indices | 2025 | |||||||
| Index | Jan | Feb | March | 1 to 5 April | 6 to 12 April | 13 to 19 April | 20 to 26 April | Month-to-date |
| FTSE 100 | 6.1% | 1.6% | -2.6% | -6.1% | -1.1% | 3.9% | 1.7% | -2.0% |
| FTSE 250 | 1.6% | -3.0% | -4.2% | -5.7% | 0.8% | 4.0% | 1.9% | 0.7% |
| Dow Jones Ind Ave | 4.7% | -1.6% | -4.2% | -8.8% | 5.0% | -2.7% | 2.5% | -4.5% |
| S&P 500 | 2.7% | -1.4% | -5.8% | -9.6% | 5.7% | -1.5% | 4.6% | -1.5% |
| NASDAQ | 1.6% | -4.0% | -8.2% | -9.9% | 7.3% | -2.6% | 6.7% | 0.5% |
| DAX | 9.2% | 3.8% | -1.7% | -6.9% | -1.3% | 4.1% | 4.9% | 0.4% |
| CAC40 | 7.7% | 2.0% | -4.0% | -6.6% | -2.3% | 2.5% | 3.4% | -3.3% |
| Nikkei 225 | -0.8% | -6.1% | -4.1% | -5.2% | -0.6% | 3.4% | 2.8% | 0.2% |
| Hang Seng | 0.8% | 13.4% | 0.8% | -1.2% | -8.5% | 2.3% | 2.7% | -4.9% |
| Shanghai Composite | -3.0% | 2.2% | 0.4% | 0.2% | -3.1% | 1.2% | 0.6% | -1.2% |
| Sensex | -0.8% | -5.6% | 5.8% | -2.6% | -0.3% | 4.5% | 0.8% | 2.3% |
| Ibovespa | 4.9% | -2.6% | 6.1% | -2.3% | 0.3% | 1.5% | 3.9% | 3.4% |
Data source: Morningstar. Past performance is not a guide to future performance.
With only a few days to go, only 12 of the 34 Investment Association (IA) sectors that we monitor are showing gains in April. Two are level, and 20 have gone down.
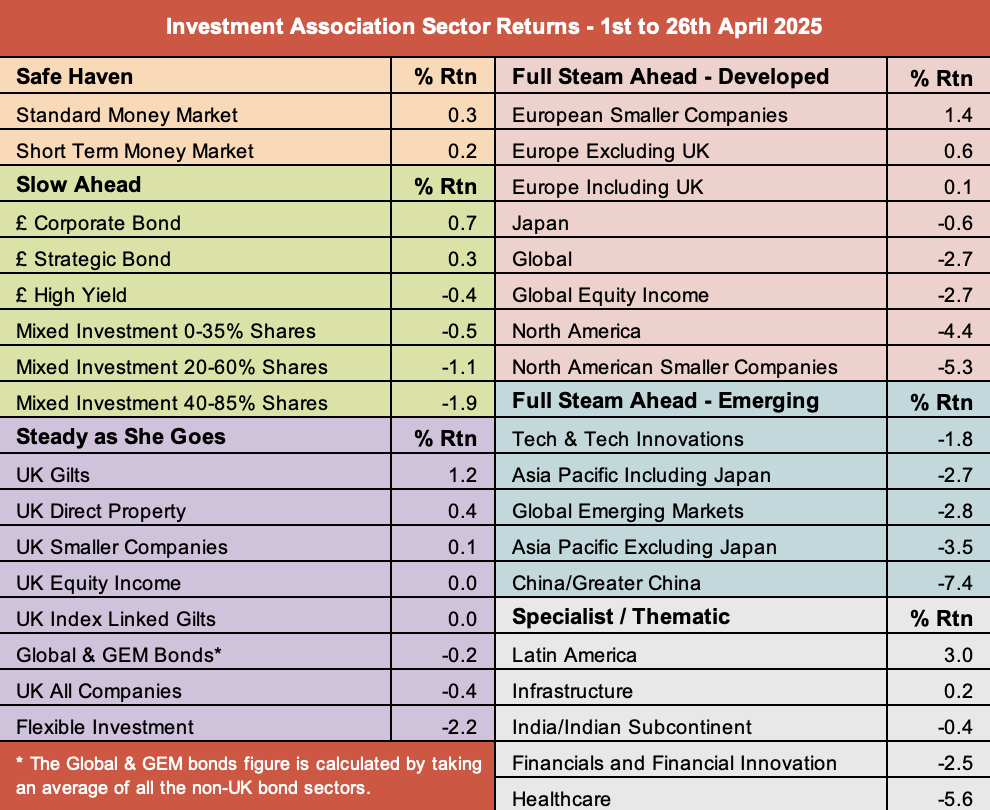
Data source: Morningstar. Past performance is not a guide to future performance.
Since the beginning of the month, sterling has strengthened by around 3% against the dollar. This currency shift negatively impacts any funds holding US investments, reducing returns when converting from local currencies.
The best-performing sector so far this month is Latin America, with a return of 3.0%. The only other equity-based sectors currently showing month-to-date gains are the European sectors, UK Smaller Companies, and Infrastructure.
TheIA does not calculate the average sector returns for some sectors, including Specialist, because the strategies of the fund managers can vary so widely. Any average performance figure would not accurately reflect the performance of a typical fund within the sector and could be misleading to investors. However, as I highlighted a couple of weeks ago, the top-performing funds in the first quarter of the year were the ‘Gold’ funds from the Specialist sector. They have continued to lead the way in April.
Saltydog’s top 10 funds 1 to 26 April 2025
Data source: Morningstar. Past performance is not a guide to future performance.
Even though it fell by 5.1% last week, the BlackRock Gold & General fund has gone up by 7.0% this month and over 35% so far this year.
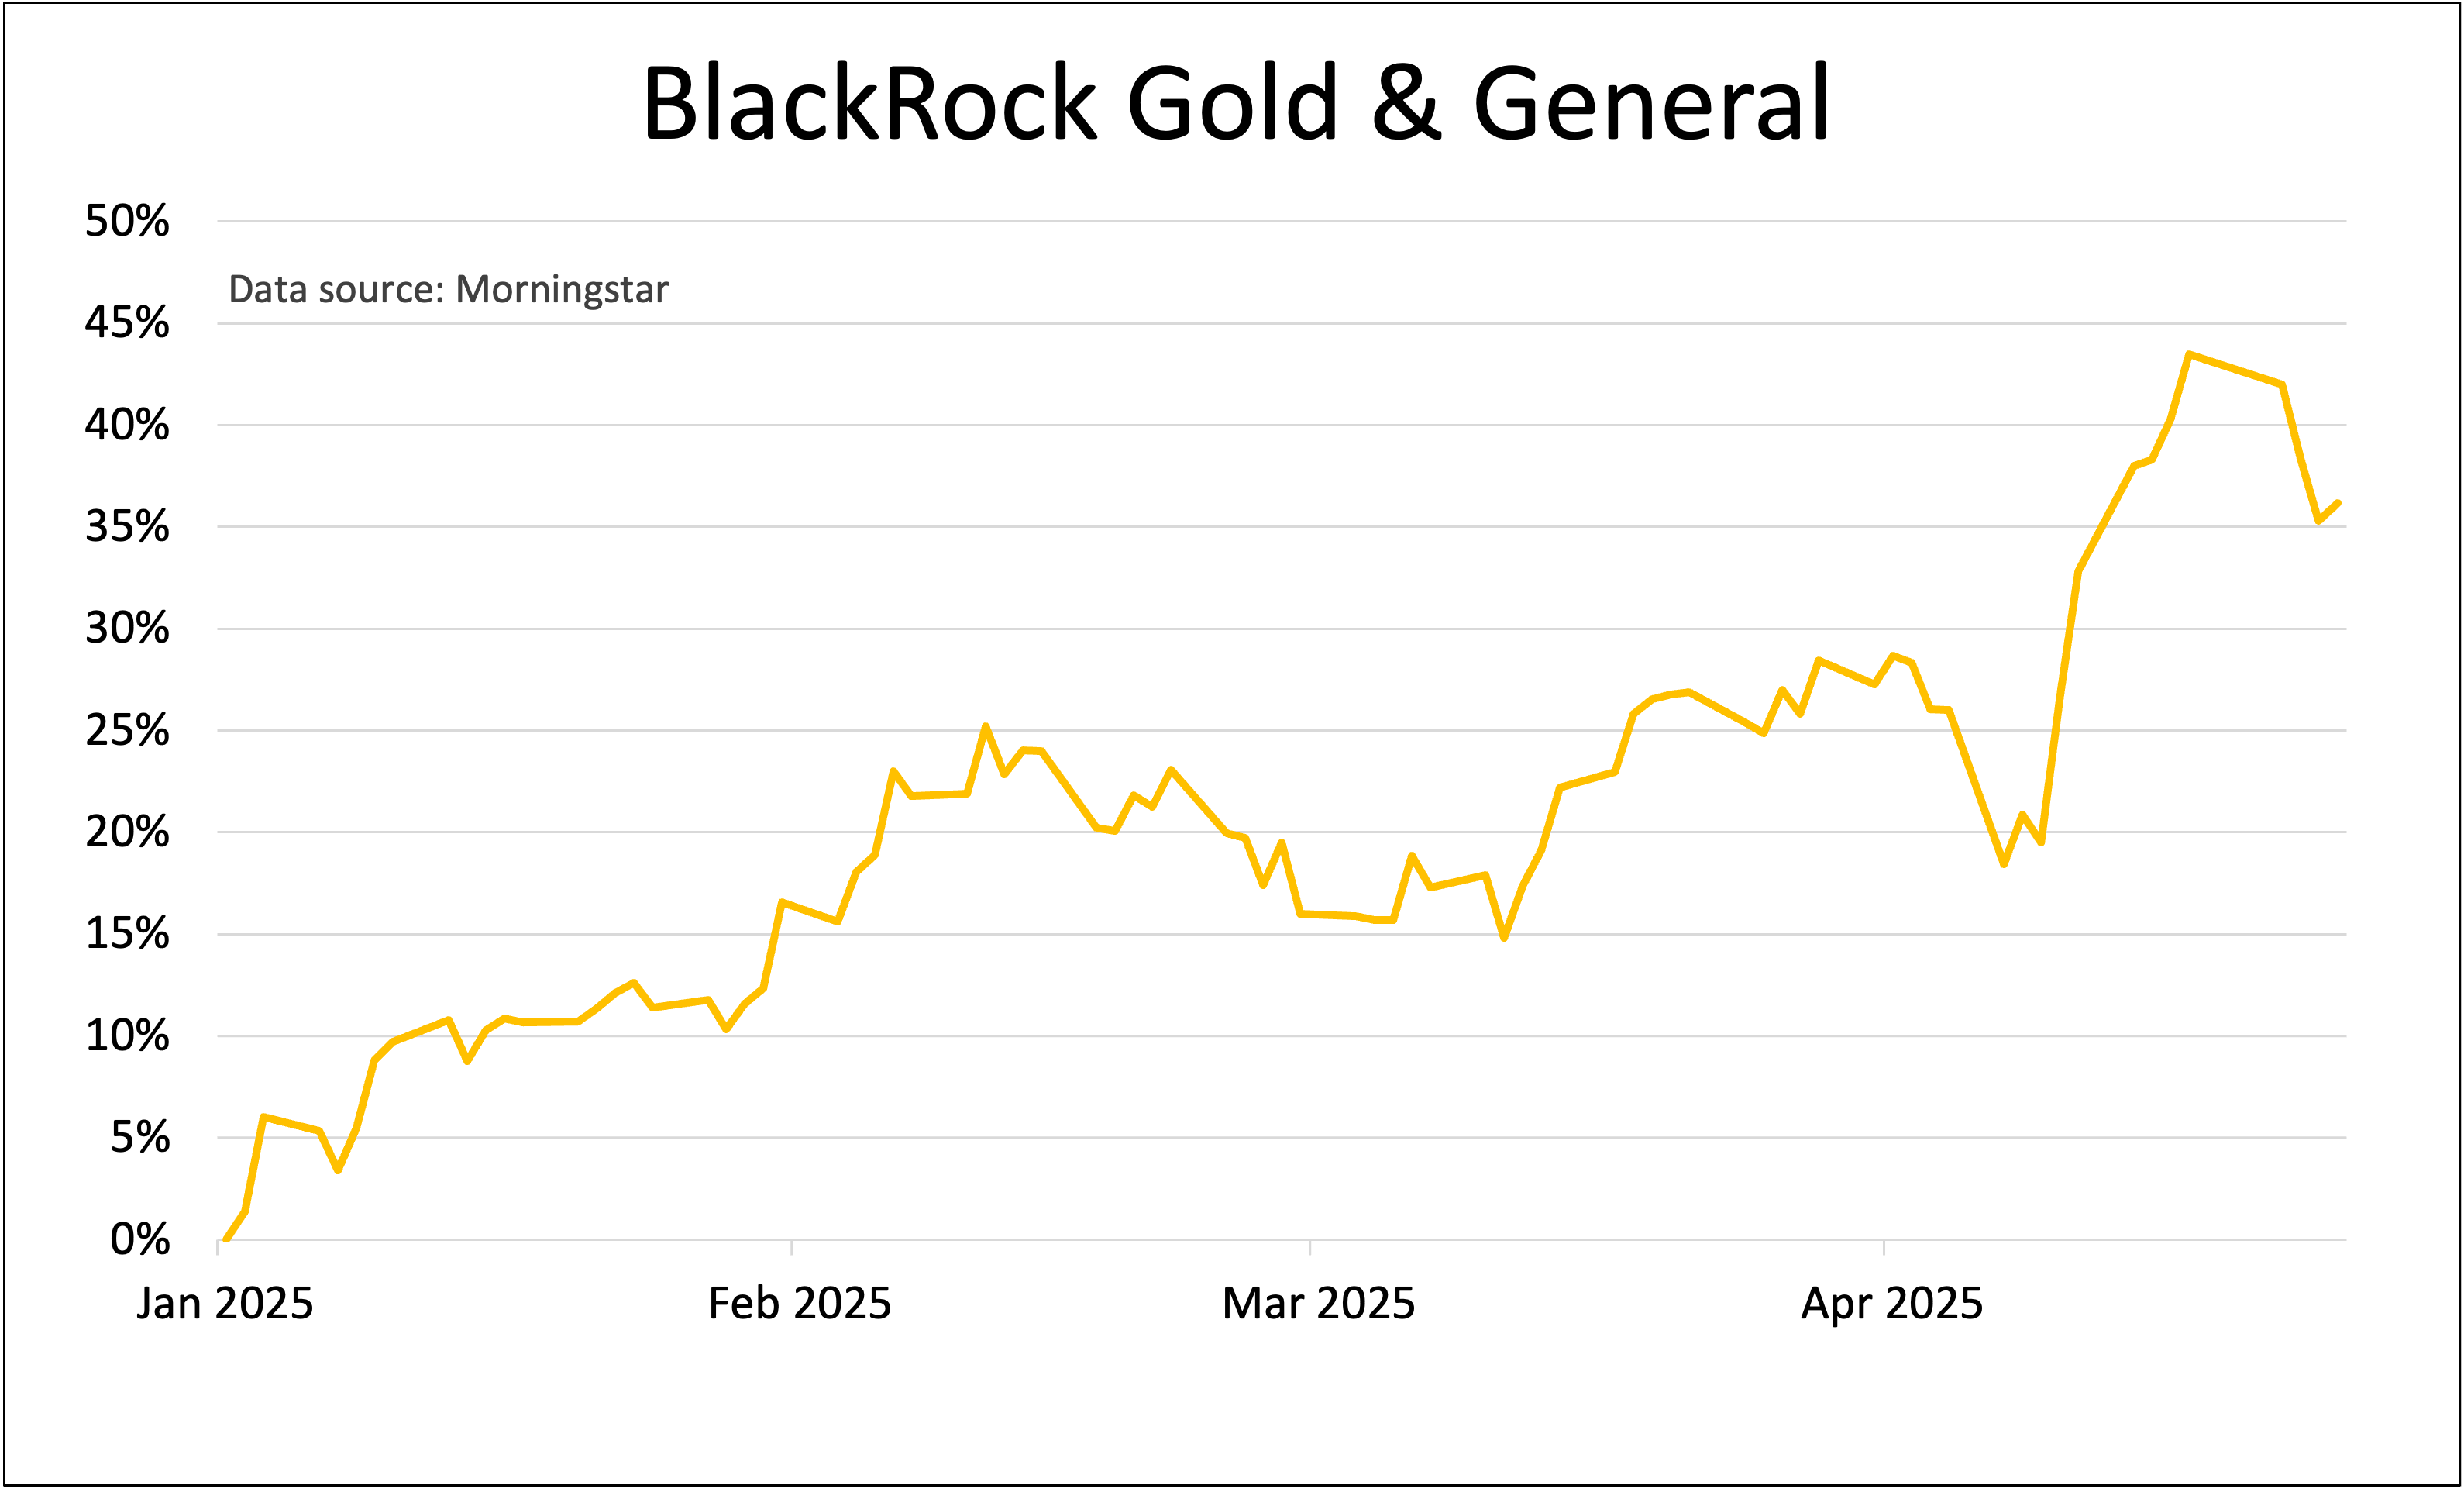
Past performance is not a guide to future performance.
For more information about Saltydog, or to take the two-month free trial, go to www.saltydoginvestor.com
These articles are provided for information purposes only. Occasionally, an opinion about whether to buy or sell a specific investment may be provided by third parties. The content is not intended to be a personal recommendation to buy or sell any financial instrument or product, or to adopt any investment strategy as it is not provided based on an assessment of your investing knowledge and experience, your financial situation or your investment objectives. The value of your investments, and the income derived from them, may go down as well as up. You may not get back all the money that you invest. The investments referred to in this article may not be suitable for all investors, and if in doubt, an investor should seek advice from a qualified investment adviser.
Full performance can be found on the company or index summary page on the interactive investor website. Simply click on the company’s or index name highlighted in the article.


