
In this Stacked Pro breakdown:
– We uncover why most CCR shoebox units are underperforming in capital gains—even after holding periods of over eight years.
– See how ABSD can completely wipe out any meaningful returns, unless you structure your investment with care.
– Discover the few CCR projects where investors saw 2.5 per cent annualised gains—and why these are the rare exceptions.
🔓 Unlock the data, calculations, and insights to make a sharper investment move.
The shoebox craze ended many years ago, but elements of it still linger. One of the common sayings from that period – that “shoeboxes in the CCR are good investments” – still lingers.
However, our examination of the numbers suggests otherwise: several signs point to CCR-showboxes showing lacklustre gains, and perhaps being hampered by higher initial price points. Here’s what to know before you buy or invest:
Examining shoebox units for rental and resale gains
For the following, we will look at shoebox transactions from 4th January 2011 through to the end of 2024.
This is because the Sellers Stamp Duty (SSD) was introduced on 4th January 2011. Transactions before the SSD were more profitable over a much shorter period, and that would be misleading considering the regulatory environment today.
Let’s look at how they performed in general for resale gains:
| Type of sale | Average of % | Average of annualised | Average of holding period | Volume |
| New Sale to Resale | -0.7% | -0.1% | 8.4 | 299 |
| Resale to Resale | 1.5% | 0.4% | 6.2 | 194 |
This generally isn’t great. On average, we see a slight capital loss for new sale to resale. This is even with a more substantial number of units transacting in this category (299 to 194). Also note the long holding period (8.4 years), which shows that gains are not materialising even after fairly long periods.
This is partly because shoebox units miss out on a big chunk of prospective resale buyers: HDB upgraders make up a large percentage of condo buyers, but upgraders are families. They have no use for a shoebox unit, hence the weaker performance in new-to-resale transactions.
An experienced realtor, however, gave us another reason why this makes sense:
When CCR shoebox units are sold by the developer, they tend to have a higher price per square foot (this has been true since before COVID). The secondary market is unwilling to accept that price, hence many of the initial buyers incur a small capital loss.
But subsequently, in resale-to-resale transactions, sellers are able to resell the unit with marginally better results. This explains the small gain of 1.5 per cent in resale-to-resale transactions.
Next, let’s look at region-specific performance:
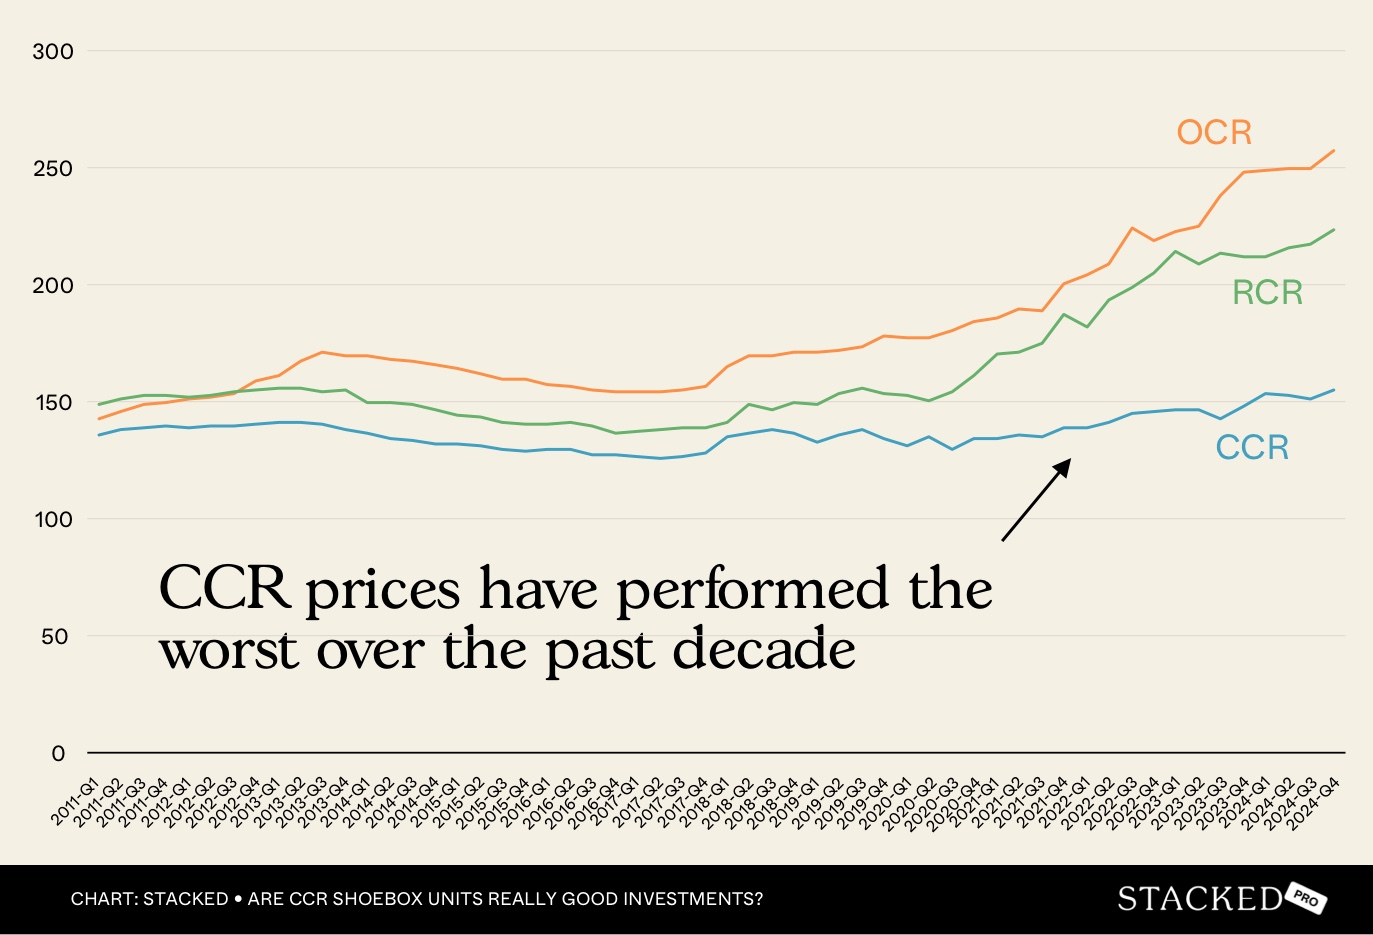
The gains specific to the CCR are the worst among the three regions. Why?
Real estate agents opined that this was likely due to the CCR units’ costs, compared to surrounding districts. A shoebox unit in the CBD, Orchard, etc., could, even in pre-Covid times, have a quantum that reached or exceeded $1 million.
When confronted with this quantum, buyers may sometimes realise they could buy a two-bedder in the RCR for around the same price!
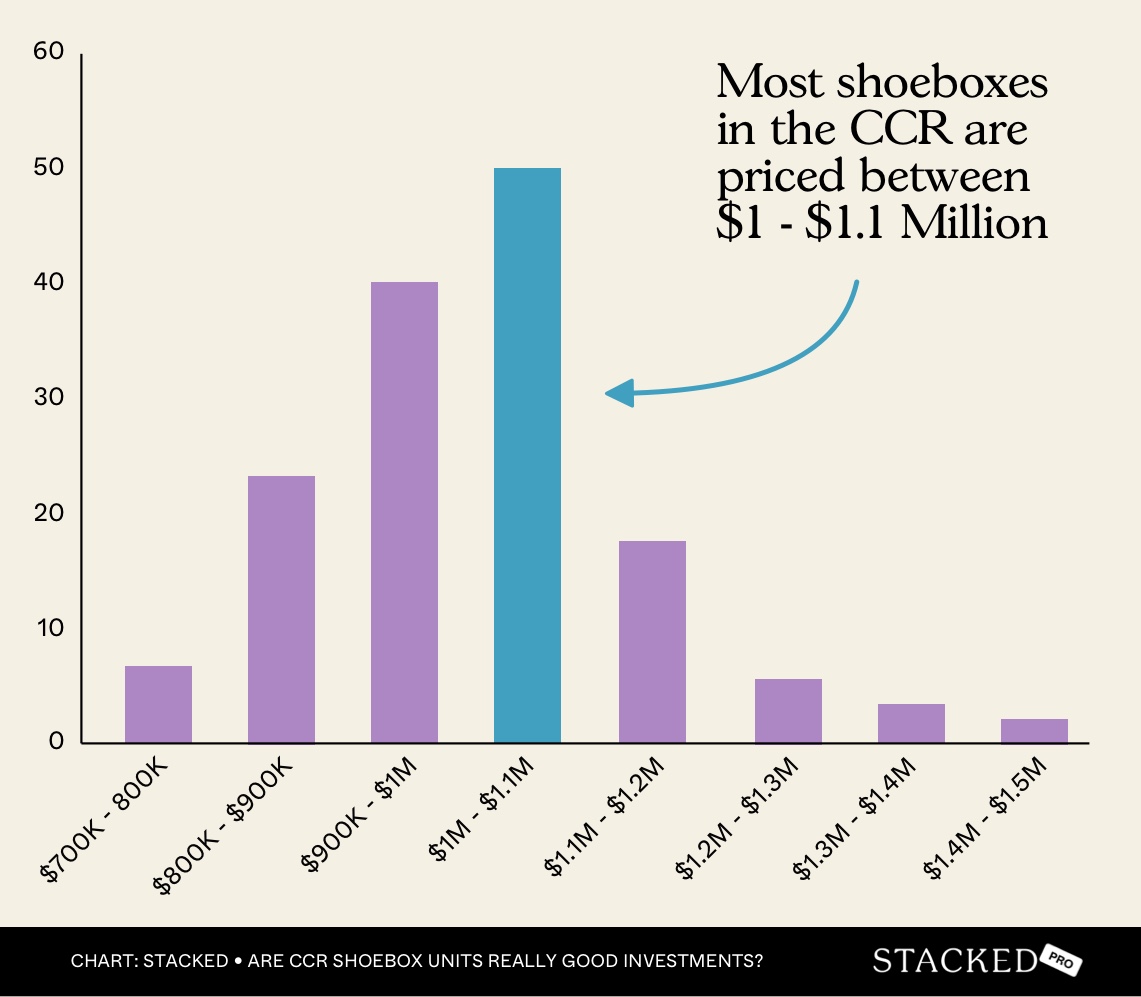
Shoebox rental performance in the CCR
The average price of a shoebox unit today averages around $1 million:
To get a sense of the rental income, let’s look at a sample unit from Espada, which is close to the average quantum of $1 million. This is a CCR condo at 48 St. Thomas Walk, which was built in 2013.
Our sample unit was purchased for $900,000, close to the average, in January of 2025. It’s 355 sq. ft. Let’s look at the unit’s rental history:
| LeaseStart | Street | Type | Unit size(sqft) | Number ofbedrooms | Monthly rent(S$) | Monthly rent(Est. S$ psf) |
| Jan 2025 | ST. THOMAS WALK | Condominium | 300-400 | 1 | 3,000 | 8.6 |
| Jan 2025 | ST. THOMAS WALK | Condominium | 300-400 | 1 | 3,200 | 9.1 |
| Jan 2025 | ST. THOMAS WALK | Condominium | 300-400 | 1 | 3,300 | 9.4 |
| Jan 2025 | ST. THOMAS WALK | Condominium | 300-400 | 1 | 3,400 | 9.7 |
| Jan 2025 | ST. THOMAS WALK | Condominium | 300-400 | 1 | 3,800 | 10.9 |
The annual rental income is about $39,600 per year. Gross rental yield = (annual rental income/total cost x 100) = 4.4 per cent.
This is, by the way, much higher than what you’d typically find in a bigger, higher-quantum family condo. Gross rental yields for three-bedders tend to be in the range of two to three per cent. But shoebox units are expected to have higher gross yields, on account of their lower quantum.
But let’s look beyond gross yields, as there’s more to an investment than that:
Here’s a total cost breakdown. We’re going to assume our buyer pays ABSD of 20 per cent, and that they’re taking a second loan to purchase the property (which caps their loan at 45 per cent of the total price).
At $900,000, this is a loan quantum of $405,000, and a total down payment of $495,000. Assuming an average holding period of six years, and a loan interest rate of 3.95 per cent; this is what the costs look like:
| Costs | |
| BSD | $21,600 |
| ABSD (20%, assume SC) | $180,000 |
| Interest Cost (At 3.95%) | $88,766 |
| Maintenance ($250 per month for 6 years) | $18,000 |
| Basic renovations/furnishing/repairs | $10,000 |
| Agent Fee (Rental – Assume changing tenants every 2 years) | $9,900 |
| Agent Fee (Selling) | $9,000 |
| Tax | $5,520 |
| Total Cost | $342,786 |
| Total Revenue | |
| Rental (Assume every 2 years, there’s a vacancy of 1 month) | $227,700 |
| Appreciation* (At 2.4% overall growth) | $21,600 |
| Total Revenue | $249,300 |
You can immediately see the numbers are too low to justify this “investment.” So we can conclude that, if ABSD is involved at all, you’re never getting a “performer” in a CCR shoebox.
But let’s say you don’t have to pay ABSD, because the property will be under a single name.
This may be possible if, for instance, you used a “sell-one-buy-two” method. This not only means you don’t pay ABSD, but that you can take out the full loan quantum, at 75 per cent of the price (although a bigger loan means paying more in interest, over the loan tenure).
It’s easier from the start, as the down payment is only $225,000. The other costs work out as follows:
| Costs | |
| BSD | $21,600 |
| Interest Cost (At 3.95%) | $147,944 |
| Maintenance ($250 per month for 6 years) | $18,000 |
| Basic renovations/furnishing/repairs | $10,000 |
| Agent Fee (Rental – Assume changing tenants every 2 years) | $9,900 |
| Agent Fee (Selling) | $9,000 |
| Tax | $5,520 |
| Total Cost | $221,964 |
Note: For properties that are rented out (non-owner occupied), do note that you can claim a flat tax deduction of 15 per cent, OR claim itemised deductions as allowed by IRAS .
In this case, your profit is $249,300 minus $221,964, which is really just $27,336.
We’ve also based our previous appreciation rate on the actual overall growth of 2.4 per cent (this is considered low for most properties, over a six year period).
What if you could achieve a 2.5 per cent growth year on year though? Assuming this, and a vacancy of one month every two years, this is what we have at the end of six years:
| Rental (Assume every 2 years, there’s a vacancy of 1 month) | $227,700 |
| Appreciation (Assuming 2.5% growth) | $143,724 |
| Total Revenue | $371,424 |
Your total profit would come to around $371,424, which, after costs ($221,964), is about $149,460. Not counting your principal payments over the years (for simplicity), the annualised returns for this are around 8.7 per cent.
This is rather decent. So if you don’t have to pay ABSD, and if your CCR shoebox can appreciate just 2.5 per cent year-on-year (which means little more than matching the overall inflation rate), the annualised returns after just six years are attractive. Assuming an average return of five to seven per cent in other assets like unit trusts, this could be enticing to some investors.
To be more precise, we looked at specific CCR projects, to see where buyers have had good annualised returns.
This is more actionable if you’re seriously considering buying a shoebox unit, at either of these projects (or close to them). We’re going to look at resale-to-resale transactions only here, as we want to factor in our case for renting.
| Project | Average of % | Average of annualised | Average of holding period | Volume |
| BUCKLEY RESIDENCE | 30.3% | 7.6% | 3.6 | 1 |
| LOFT @ STEVENS | 12.5% | 4.3% | 2.6 | 2 |
| 283 STUDIO | 21.2% | 4.2% | 4.7 | 1 |
| FIFTY-TWO STEVENS | 14.0% | 3.2% | 4.2 | 1 |
| TRIBECA | 16.7% | 2.5% | 5.4 | 5 |
| STELLAR RV | 10.2% | 2.3% | 4.6 | 2 |
| STRATA | 10.6% | 2.2% | 4.8 | 2 |
| NEWTON EDGE | 13.2% | 2.0% | 6.2 | 1 |
| THE VERMONT ON CAIRNHILL | 13.6% | 1.8% | 7.1 | 1 |
| RV SUITES | 10.4% | 1.8% | 5.9 | 4 |
| NOVELIS | 2.4% | 1.7% | 6.7 | 4 |
| LINCOLN SUITES | 9.6% | 1.5% | 6.1 | 4 |
| ESPADA | 7.7% | 1.5% | 5.0 | 7 |
| LOFT@HOLLAND | 9.8% | 1.5% | 5.8 | 6 |
| RV EDGE | 6.6% | 1.5% | 4.4 | 5 |
| VIVACE | 4.3% | 1.5% | 4.0 | 3 |
| MARTIN EDGE | 8.8% | 1.3% | 6.4 | 1 |
| NOMU | 5.5% | 1.2% | 4.3 | 1 |
| 10 SHELFORD | 4.1% | 1.2% | 3.2 | 2 |
| MACKENZIE 138 | 10.5% | 1.2% | 8.9 | 2 |
| ATTITUDE AT KIM YAM | 6.4% | 1.1% | 5.9 | 2 |
| MACKENZIE 88 | 6.3% | 0.8% | 6.3 | 9 |
| SUITES @ NEWTON | 5.5% | 0.8% | 7.0 | 1 |
| MULBERRY TREE | 3.9% | 0.8% | 6.7 | 2 |
| ROBERTSON EDGE | 3.2% | 0.7% | 6.2 | 9 |
| SOLEIL @ SINARAN | 3.7% | 0.5% | 6.4 | 3 |
| WILKIE 80 | 2.5% | 0.5% | 6.0 | 3 |
| LUMIERE | 2.0% | 0.5% | 3.9 | 1 |
| SKYSUITES@ANSON | 1.8% | 0.4% | 5.6 | 12 |
| DUNEARN SUITES | 0.8% | 0.3% | 7.3 | 6 |
| LOFT @ NATHAN | 1.9% | 0.3% | 4.7 | 7 |
| MILL POINT | 1.1% | 0.2% | 6.7 | 5 |
| ZEDGE | 1.6% | 0.1% | 12.1 | 2 |
| MEDGE | 0.6% | 0.1% | 9.9 | 2 |
| VIZ AT HOLLAND | 0.2% | 0.0% | 8.6 | 2 |
| ZENITH | -0.1% | 0.0% | 9.4 | 2 |
| THE FORD @ HOLLAND | 1.5% | 0.0% | 5.6 | 2 |
| RV RESIDENCES | 0.1% | 0.0% | 5.5 | 6 |
| PARC SOPHIA | -1.6% | -0.2% | 10.1 | 1 |
| THE CLIFT | -4.4% | -0.4% | 7.1 | 24 |
| ESTILO | -3.0% | -0.5% | 7.6 | 4 |
| ILLUMINAIRE ON DEVONSHIRE | -3.9% | -0.6% | 6.4 | 3 |
| VIDA | -5.8% | -0.6% | 7.0 | 12 |
| DEVONSHIRE RESIDENCES | -3.8% | -0.8% | 5.6 | 3 |
| HILLCREST ARCADIA | -3.3% | -0.9% | 3.8 | 1 |
| UE SQUARE | -5.5% | -1.2% | 4.8 | 1 |
| 26 NEWTON | -9.6% | -1.5% | 6.8 | 5 |
| SUITES @ SHREWSBURY | -12.3% | -2.2% | 6.0 | 4 |
| THE PEAK @ CAIRNHILL I | -15.2% | -3.1% | 4.6 | 2 |
| 6 DERBYSHIRE | -23.9% | -5.9% | 5.1 | 3 |
| Average | 1.5% | 0.4% | 6.2 | 194 |
If we look at the list as a whole, we can see that out of the 194 resale transactions, only five projects recorded a 2.5 per cent annualised return on average. Only four projects had fewer than five transactions over the given period.
The average resale gain across all projects is modest, at 1.5 per cent with a 0.4 per cent annualised return and a 6.2-year holding period. This is frankly a little on the slow side, especially if you factor in risks such as falling property values (uncommon but not impossible), or problem tenants / high vacancy rates.
It can be argued that an asset such as a CCR shoebox is meant more for rental yields than resale gains; and we can certainly see that in the numbers. However, it’s apparent that gains should still matter, as decent property appreciation is still needed to make the investment worthwhile.
Our conclusion here is that simply being in the CCR may not be a “magic bullet” solution for picking a good shoebox unit; and if anything, we can see that resale gains tend to struggle in this region. In addition, whilst some CCR shoebox units have provided good returns, there’s a real risk of negative returns if you pick the wrong one.
Coupled with the difficulties of finding and managing tenants, a CCR shoebox is not what we’d consider an easy or low-risk investment. A less experienced investor might be better off just buying a well-located three-bedder, and waiting for it to appreciate.
For more on the Singapore property market, or more specifics on shoebox units in various projects, follow us on Stacked. If you’d like to get in touch for a more in-depth consultation, you can do so here.


