Nonbank mortgage lenders and loan brokers react quickly to demand, which has collapsed.
By Wolf Richter for WOLF STREET.
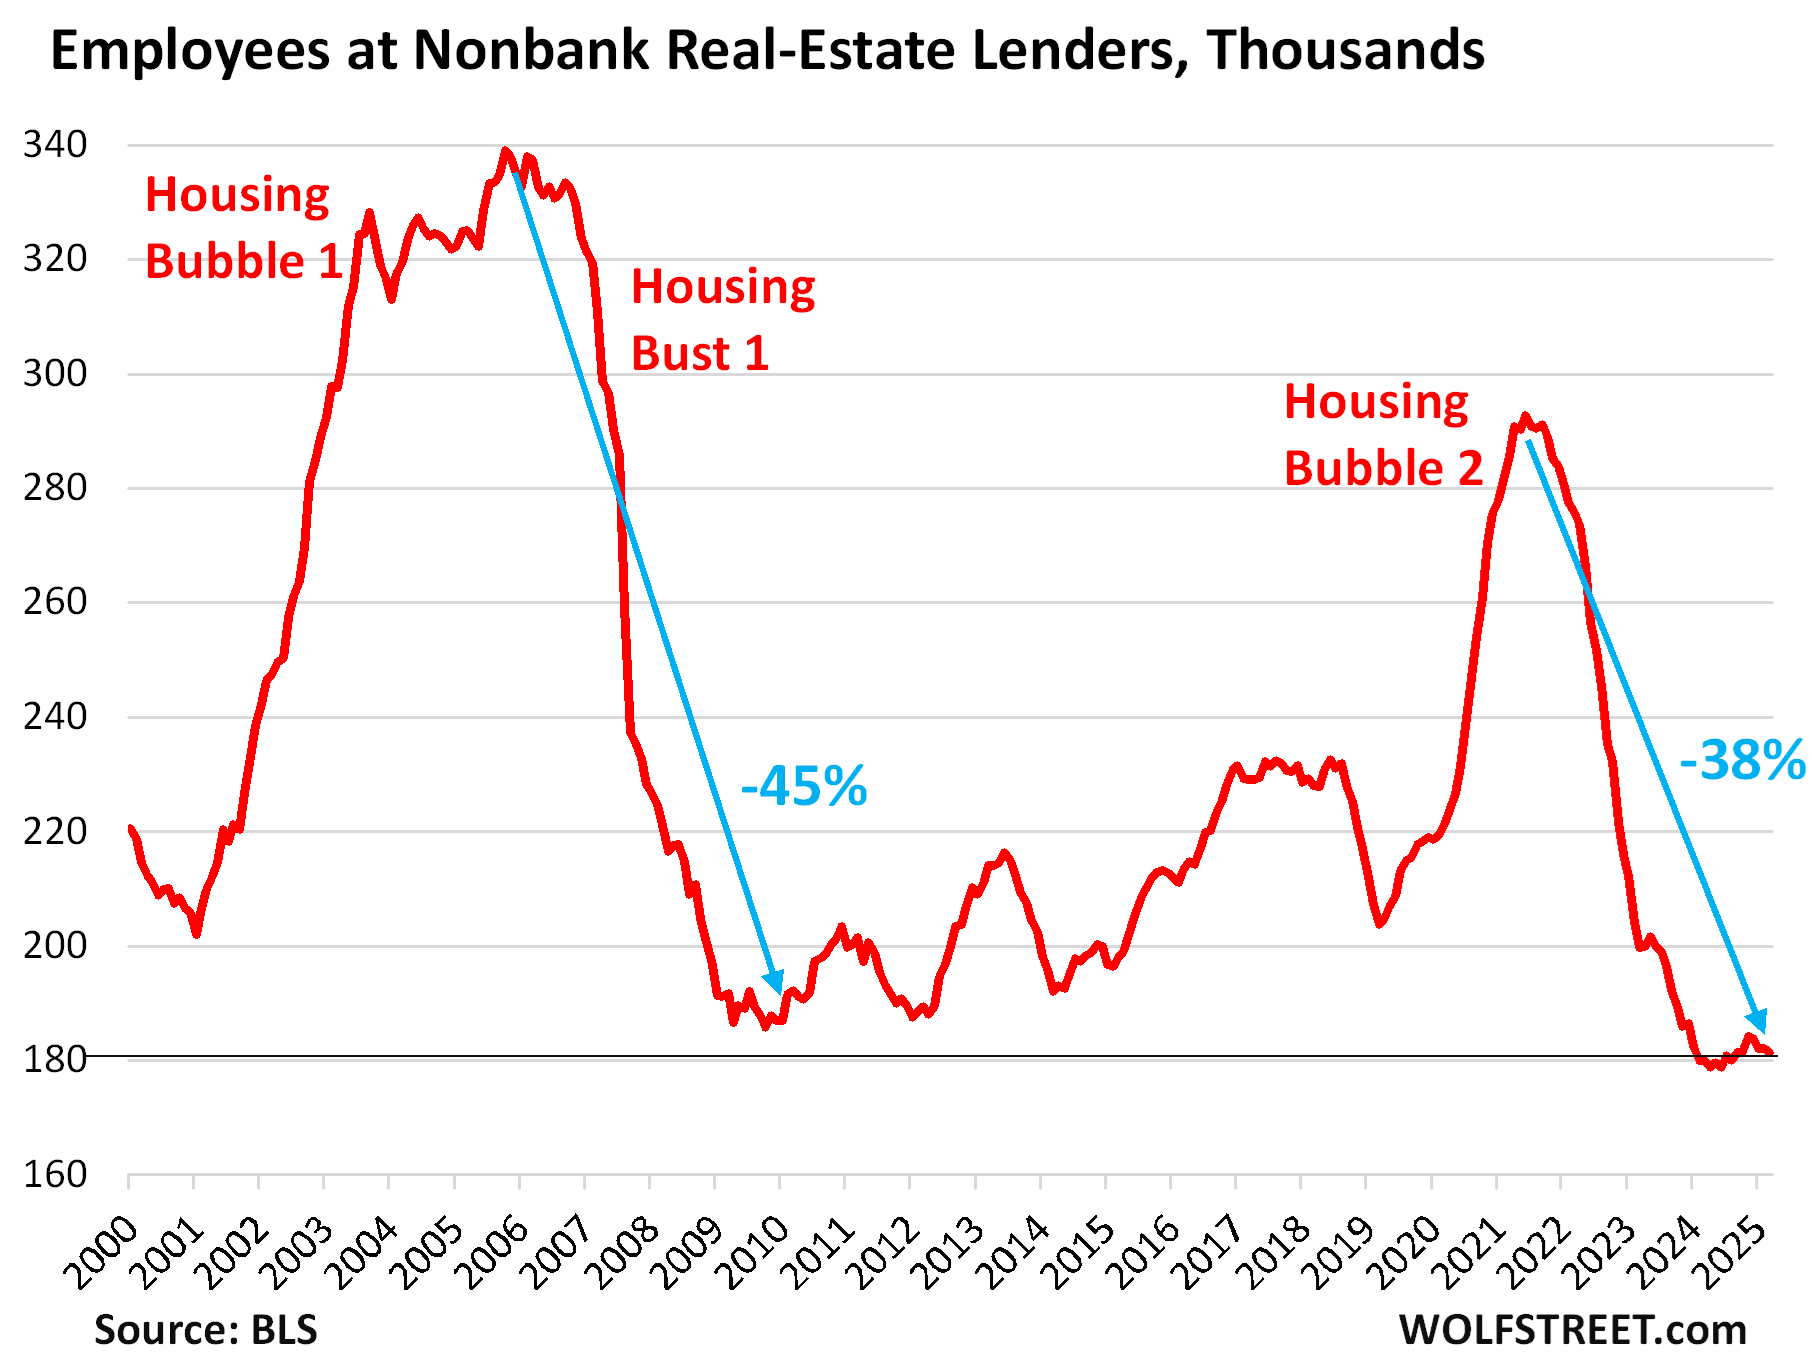
Mortgage lenders give a special perspective on the housing market because they sit at the epicenter of it. Employment at nonbank mortgage lenders – which include the largest mortgage lenders in the US, see list below – has re-declined four months in a row through March, after a mini-rise, having now plunged by 38%, or by 111,400 workers from the cycle peak in 2021, according to data from the Bureau of Labor Statistics.
Housing bubbles create employment bubbles at mortgage lenders. And housing busts undo those mortgage-lending employment bubbles as companies react rapidly to plunging demand in the housing market. The housing bust this time around is the plunge in sales volume to the lowest levels since the mid-1990s. Prices have also started to decline in many markets after the crazy spike.
The employment bubble of Housing Bubble 1 was even bigger than the employment bubble in Housing Bubble 2. Since then, a lot of work in mortgage lending has been automated, digitized, and moved online, requiring less human work today, and a relatively smaller workforce than 20 years ago:
Nonbank mortgage lenders dominate mortgage lending. The top three mortgage lenders by the number of mortgage originations – purchase mortgages and refinance mortgages – were nonbanks in 2024, according to data from Bankrate. Of the top 10, six were nonbanks.
The two largest mortgage lenders combined – United Wholesale Mortgage and Rocket Mortgage – originated more mortgages in 2024 (727,000) than the next eight largest mortgage lenders (banks, nonbanks, and a credit union) combined (647,000).
There are thousands of banks, credit unions, and thrifts that engage in mortgage lending. But the industry is concentrated at the top. The top 10 mortgage lenders provided 26% of total dollar-volume mortgage originations in 2024.
Note the right column, which shows the average size of mortgages by mortgage lender originated in 2024 – how they vary!
| 2024 | Mortgage lender | # of Mortgages | Billion $ originated | Average mortgage $ |
| 1 | United Wholesale Mortgage | 366,078 | 139.7 | 381,613 |
| 2 | Rocket Mortgage | 361,071 | 97.6 | 270,307 |
| 3 | CrossCountry Mortgage | 101,894 | 39.4 | 386,676 |
| 4 | Bank of America | 83,143 | 29.5 | 354,810 |
| 5 | Navy Federal Credit Union | 80,019 | 17.7 | 221,197 |
| 6 | LoanDepot | 79,418 | 23.8 | 299,680 |
| 7 | Chase | 78,529 | 38.2 | 486,444 |
| 8 | Guild Mortgage | 75,356 | 23.2 | 307,872 |
| 9 | Fairway Independent Mortgage | 74,404 | 23.7 | 318,531 |
| 10 | U.S. Bank | 74,138 | 29.2 | 393,860 |
| Total | 1,374,050.0 | 462.0 |
The jobs at the mortgage lending divisions of banks and credit unions are not included here – just jobs at nonbanks. But mortgage-related employment at banks ran a similar course as we saw with the announcements of mass layoffs in 2021-2023.
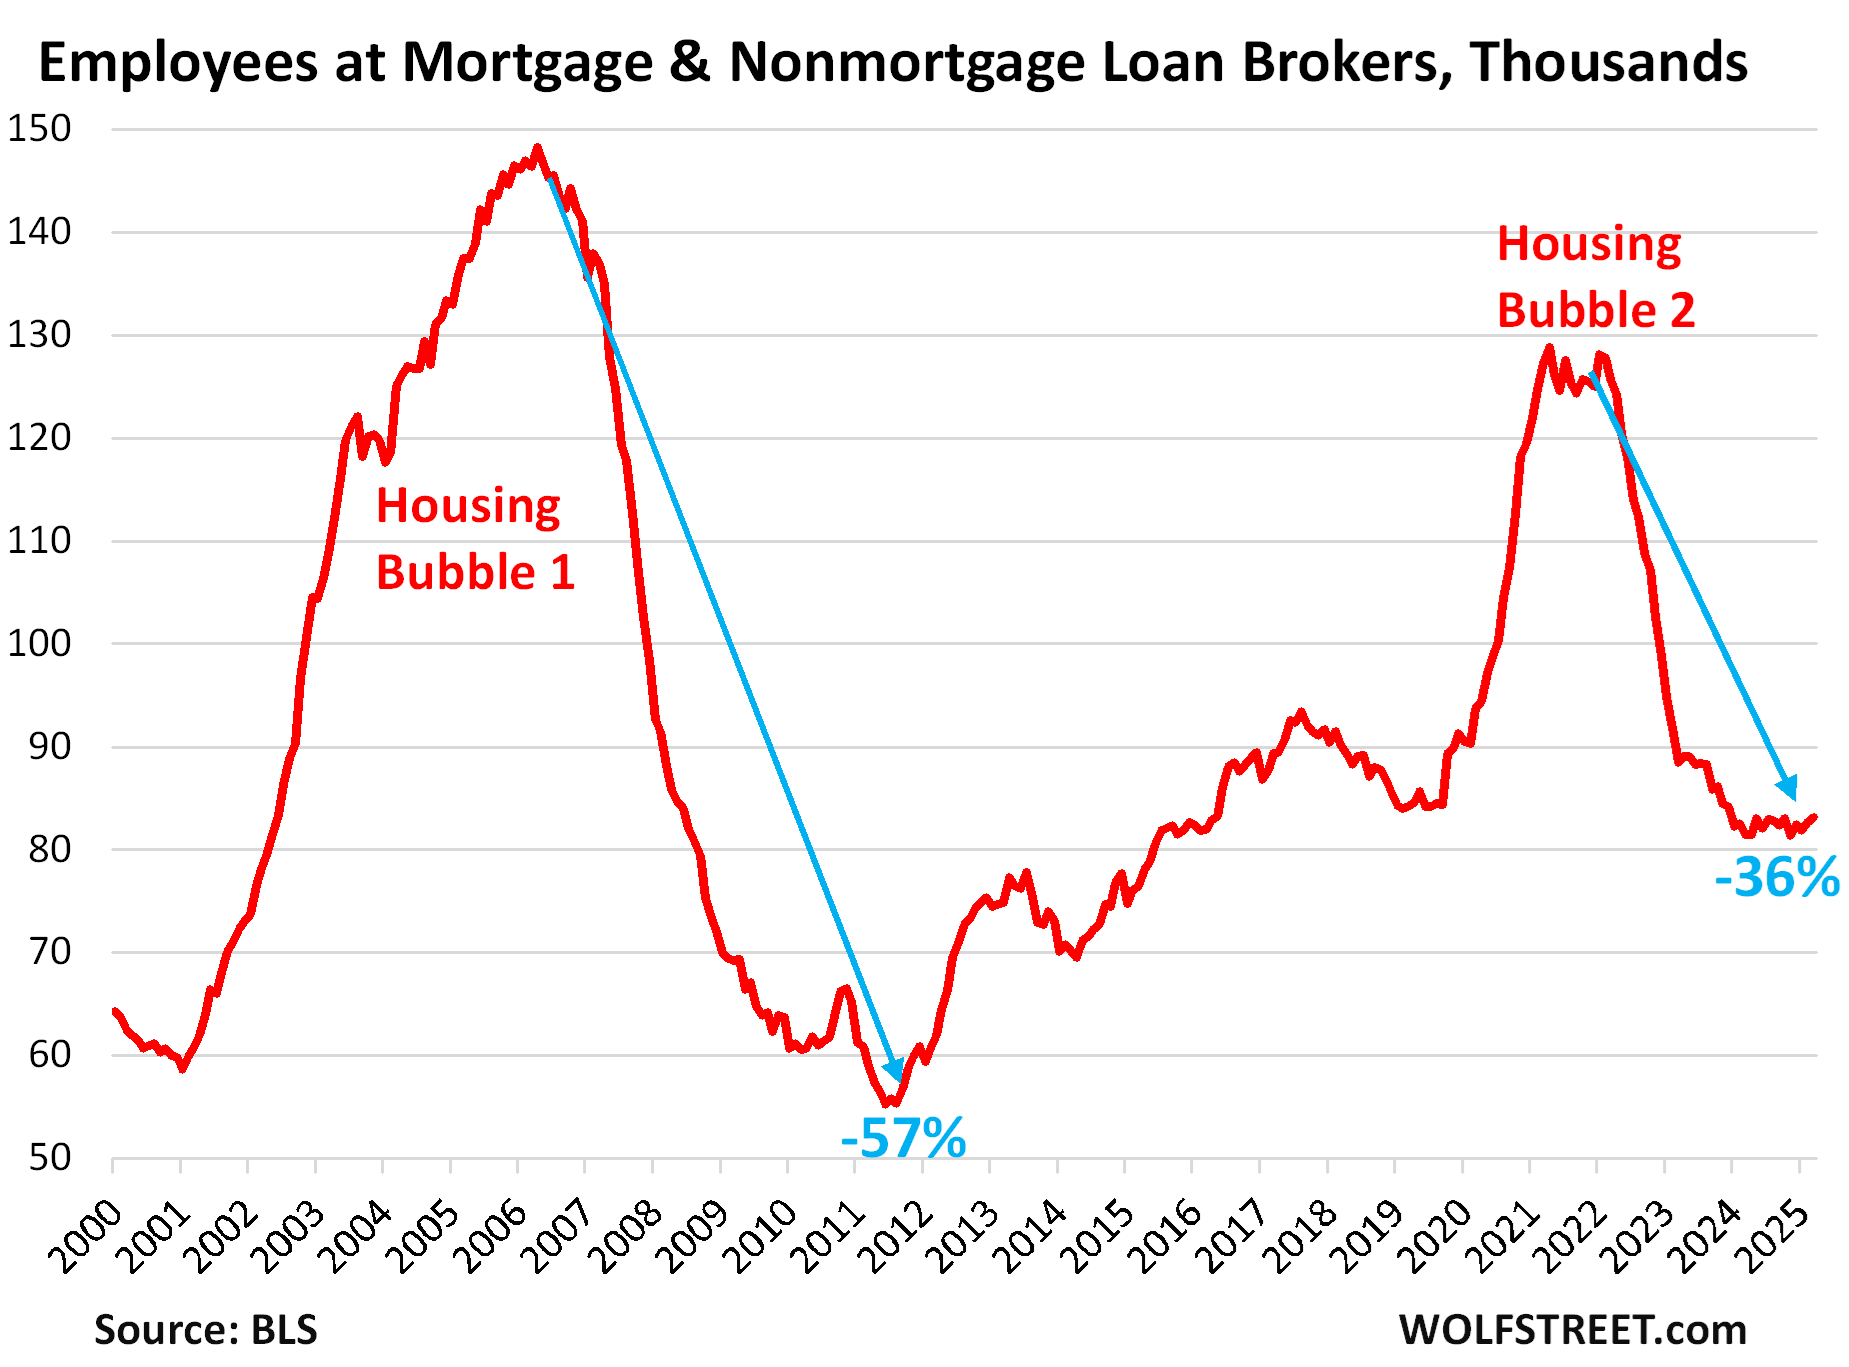
Loan brokers have seen a similar housing-bubble-to-housing-bust trajectory of job bubbles and job destruction. The metric here from the BLS includes all loan brokers, dominated by mortgage brokers.
But here, employment as ticked up a tiny bit in February and March. The mortgage-broker industry lost 57% of its jobs between 2006 and 2012 during the Housing Bust.
Currently they’re down 35% from mid-2021 levels, or by 42,500 jobs. But at the current level of 83,100 jobs, they didn’t get anywhere near setting four-decade lows, as employment at nonbank mortgage lenders has done.
At nonbank mortgage lenders and at loan brokers combined, employment plunged by 37%, or by 155,300 jobs, since mid-2021, or 37% of their total staff.
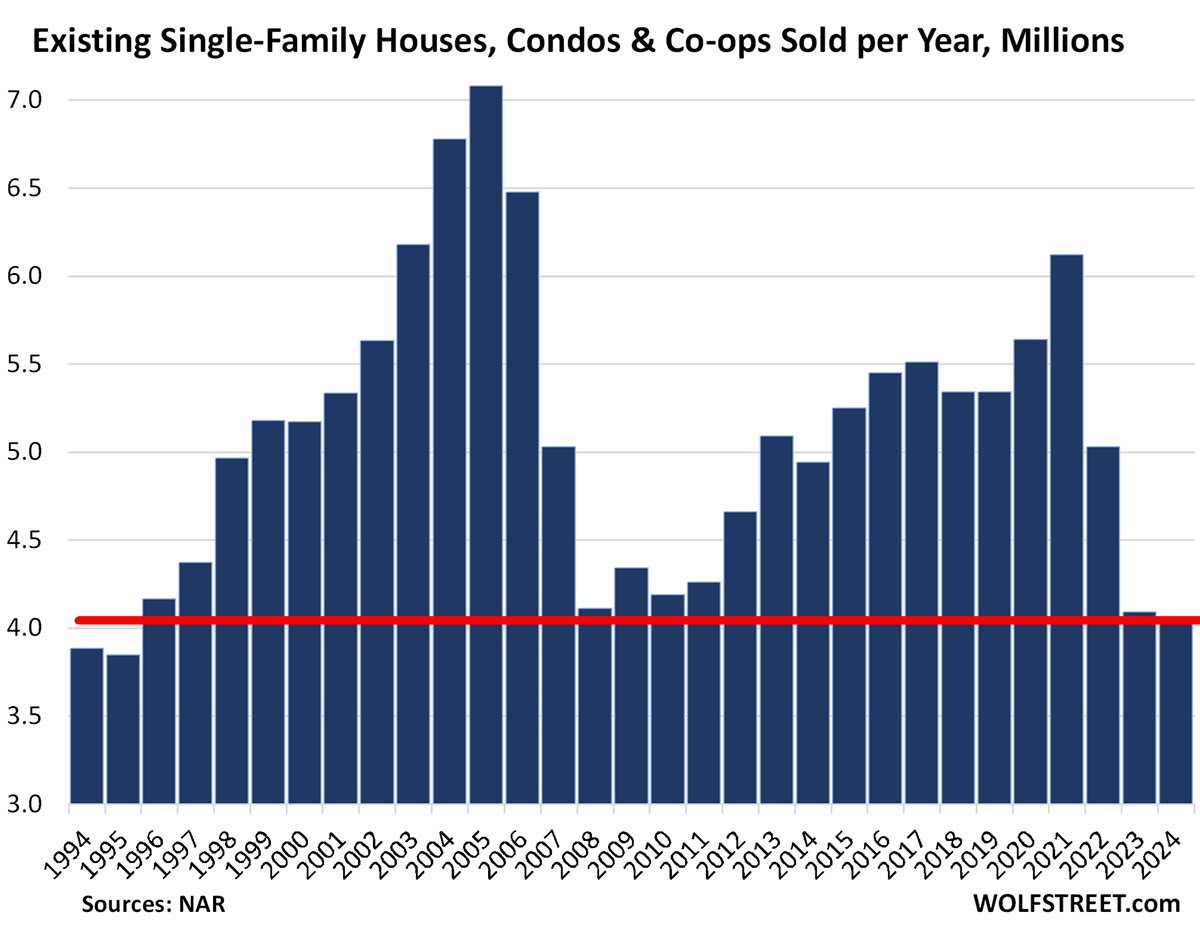
Employment in mortgage lending plunged because home sales plunged, and so mortgage originations plunged, and there wasn’t enough work to do.
Sales of existing homes in 2024 plunged by 24% compared to 2019, and by 34% compared to 2021, to 4.06 million homes, the lowest since 1995, below even the worst years during the Housing Bust, and demand destruction has continued so far this year, according to data from the National Association of Realtors.
This time around, demand destruction was caused by the spike in home prices that in many markets reached 50% or 60% or more in just two years. Those prices don’t make economic sense.
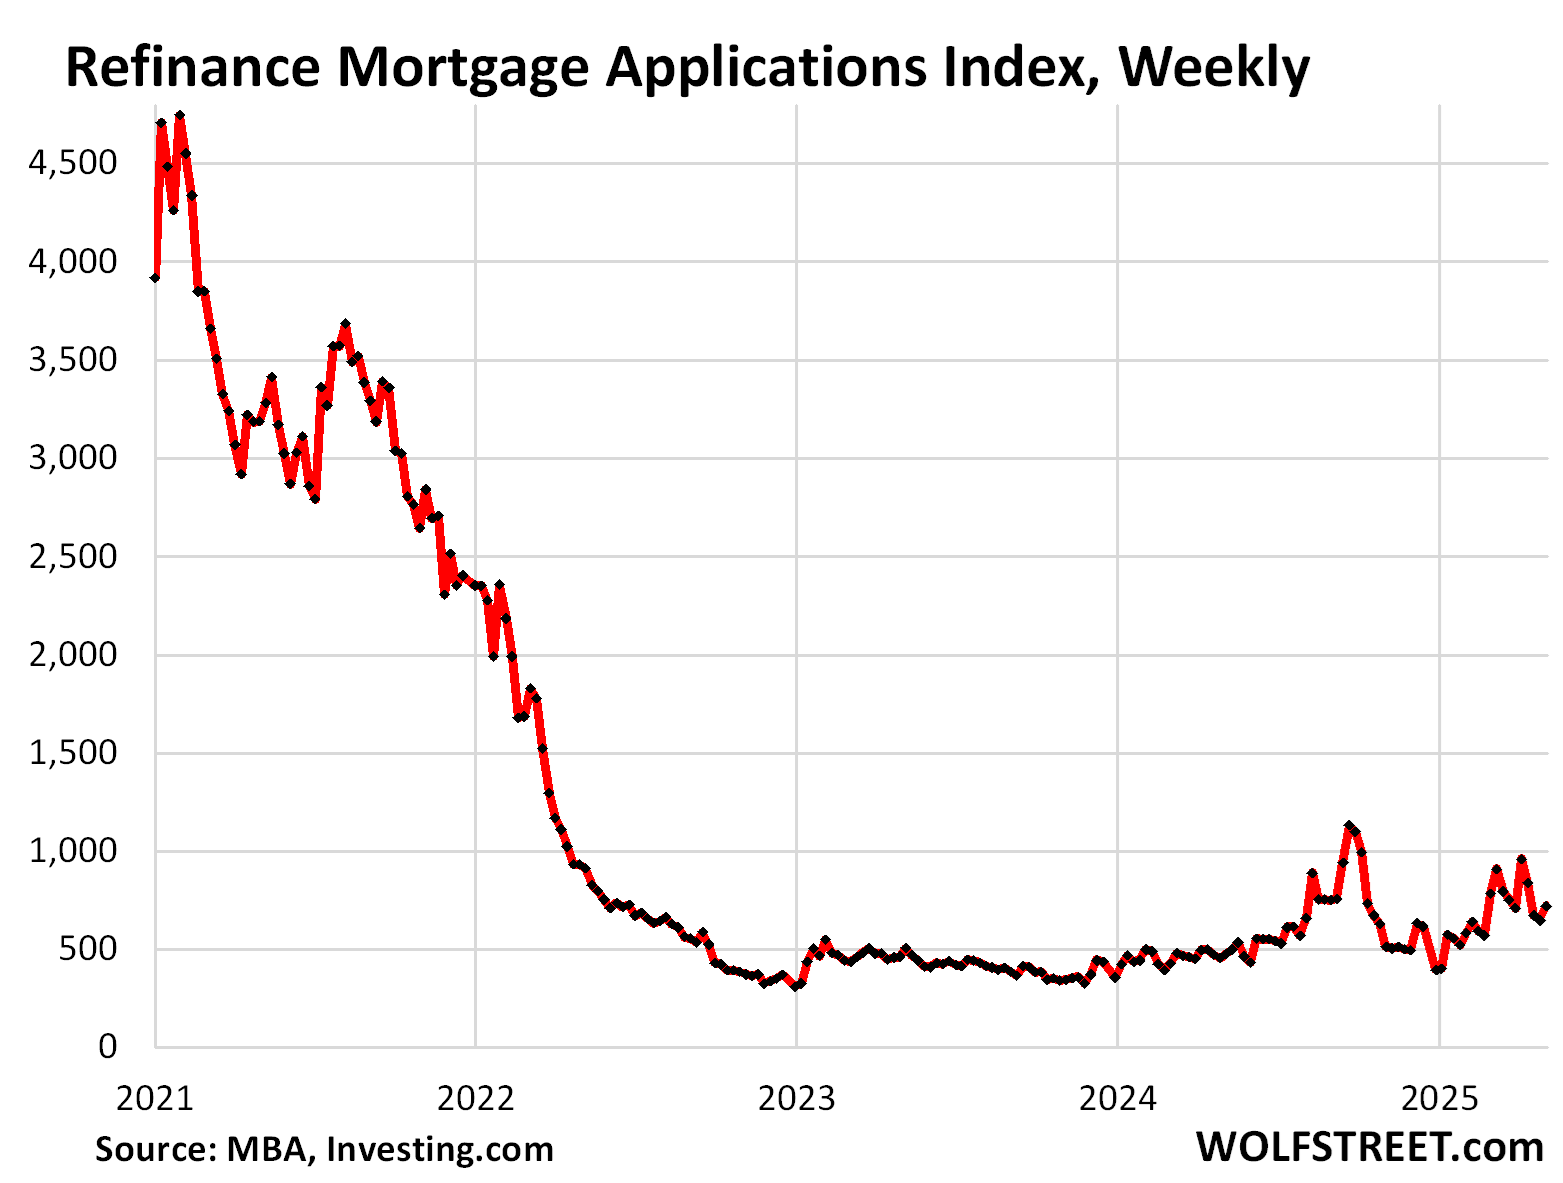
Mortgage applications plunged even more than home sales. And for the mortgage lending industry, that’s the metric that ultimately matters the most. The charts below of mortgage applications track the job destruction in the mortgage industry above fairly closely.
Applications for mortgages to purchase a home, though they ticked up from the lows, were still down by 40% compared to the same week in 2019, and by 44% from the same week in 2021, according to data from the Mortgage Bankers Association.
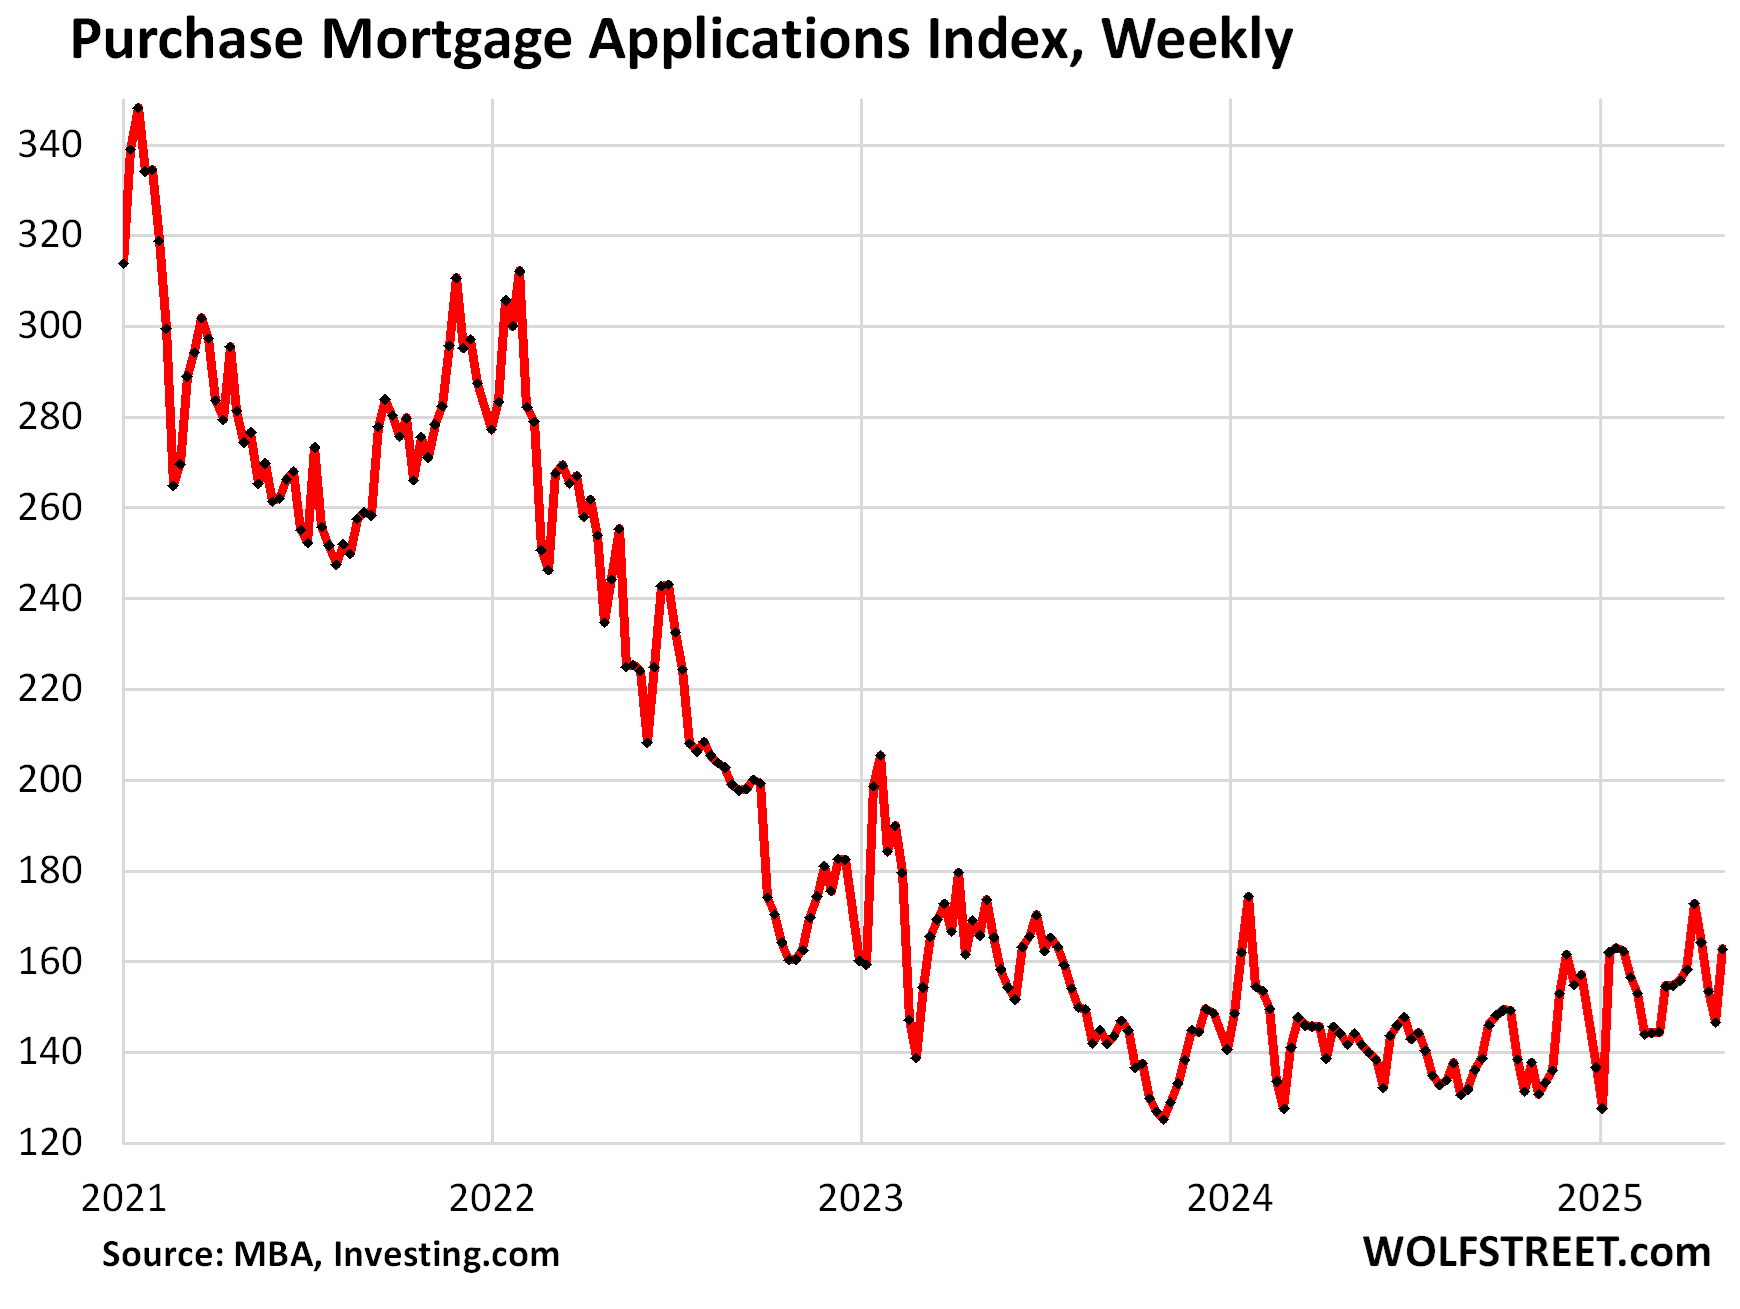
Applications for mortgages to refinance a home plunged by 42% compared to the same week in 2019 and by 78% compared to 2021, which had been during the historic refinance bubble triggered by the Fed’s interest-rate repression, when mortgage rates fell below 3%.
For mortgage lenders and brokers, this was a huge business that vanished overnight very quickly.
Enjoy reading WOLF STREET and want to support it? You can donate. I appreciate it immensely. Click on the mug to find out how:

![]()