As the United States grapples with shifting political winds, developers in the distributed solar and storage market are facing a potential policy storm.
The confluence of an uncertain future for the Inflation Reduction Act (IRA), escalating import tariffs and evolving state-level responses threaten to reshape the economic and growth trajectory of both commercial and industrial (C&I) and community solar projects. This article outlines the core federal policy risks, their implications and the most viable mitigation levers for stakeholders.
The Policy Risks: IRA Rollback and Tariff Escalation
Congressional budget reconciliation negotiations are ongoing and may extend through the summer, with Republicans currently divided on whether to maintain or repeal IRA renewable subsidies, including the 30% base Investment Tax Credit (ITC) and associated adders for domestic content and energy communities.
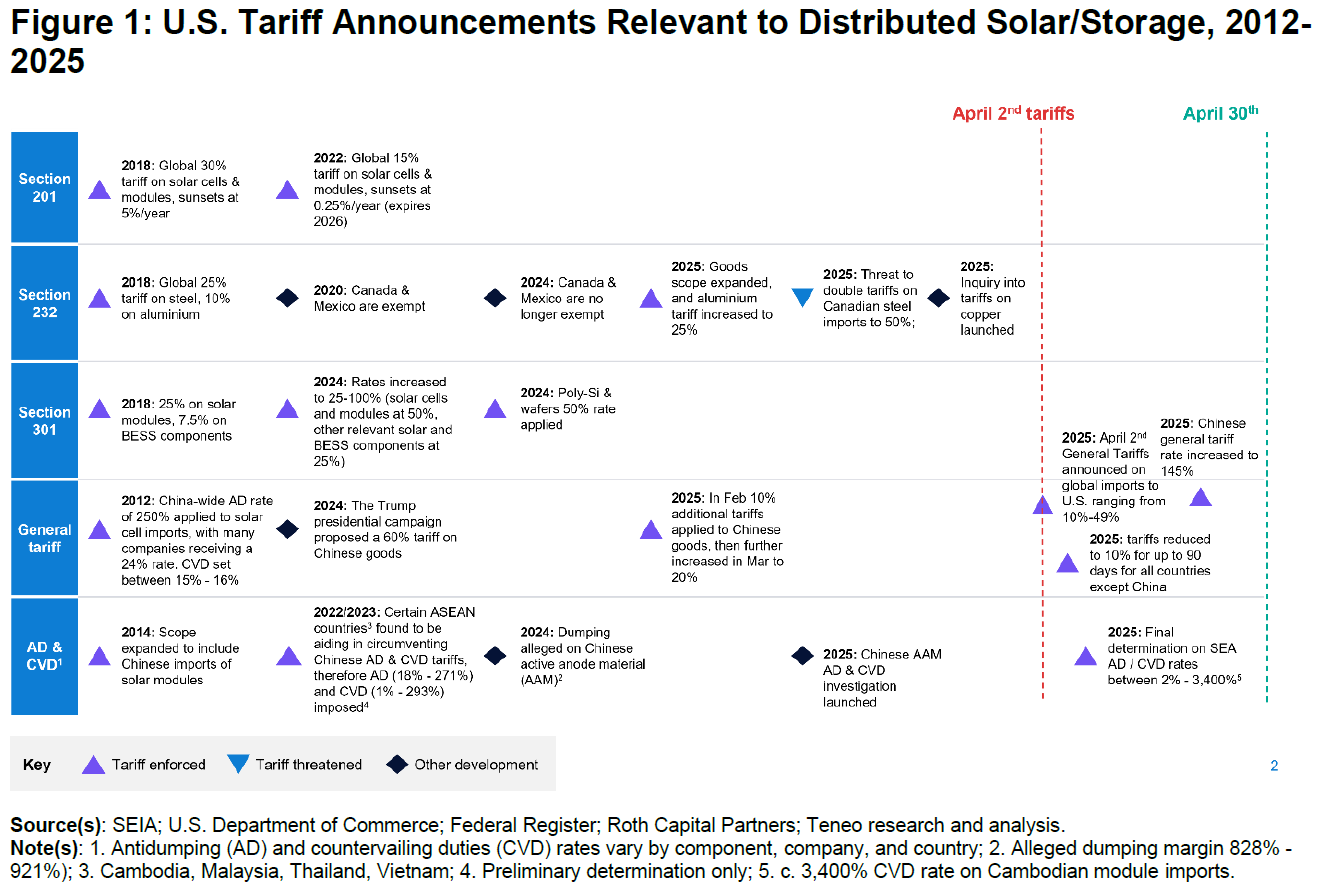
Simultaneously, and with several measures announced in recent weeks, the federal government has imposed new tariffs, revised recently announced tariffs and set expectations for further tariff revisions.
These announcements have levied additional tariffs relevant to core solar PV (photovoltaic) and energy storage components through U.S. policies such as the General Tariff, Section 201 (Solar Imports), Section 301 (China Imports), Anti-Dumping (AD) and Countervailing Duties (CVD). AD and CVD tariffs are set per company and range between 2% and 3,400%.1 These tariffs compound existing price pressures from inflation and supply chain constraints.
Economic Impact: Higher Costs, Lower Returns, Slower Growth
The downstream impact on project viability is dramatic. The 2028 levelized cost of energy (LCOE) for a 5MW ground-mounted solar PV system, which on average is estimated to be ~$31/MWh for C&I and community solar projects,2 could effectively rise by 145–210% under a severe policy scenario that includes both a drastic ITC rollback to a 10% base (no adders) and a Modified Accelerated Cost Recovery System (MACRS) extension from 5 to 20 years. Tariff hikes could also add another 23–26% to LCOE,3 further impairing developer returns.
A severe rollback to a 10% ITC with extended MACRS results in a more than 2x increase in solar LCOE.
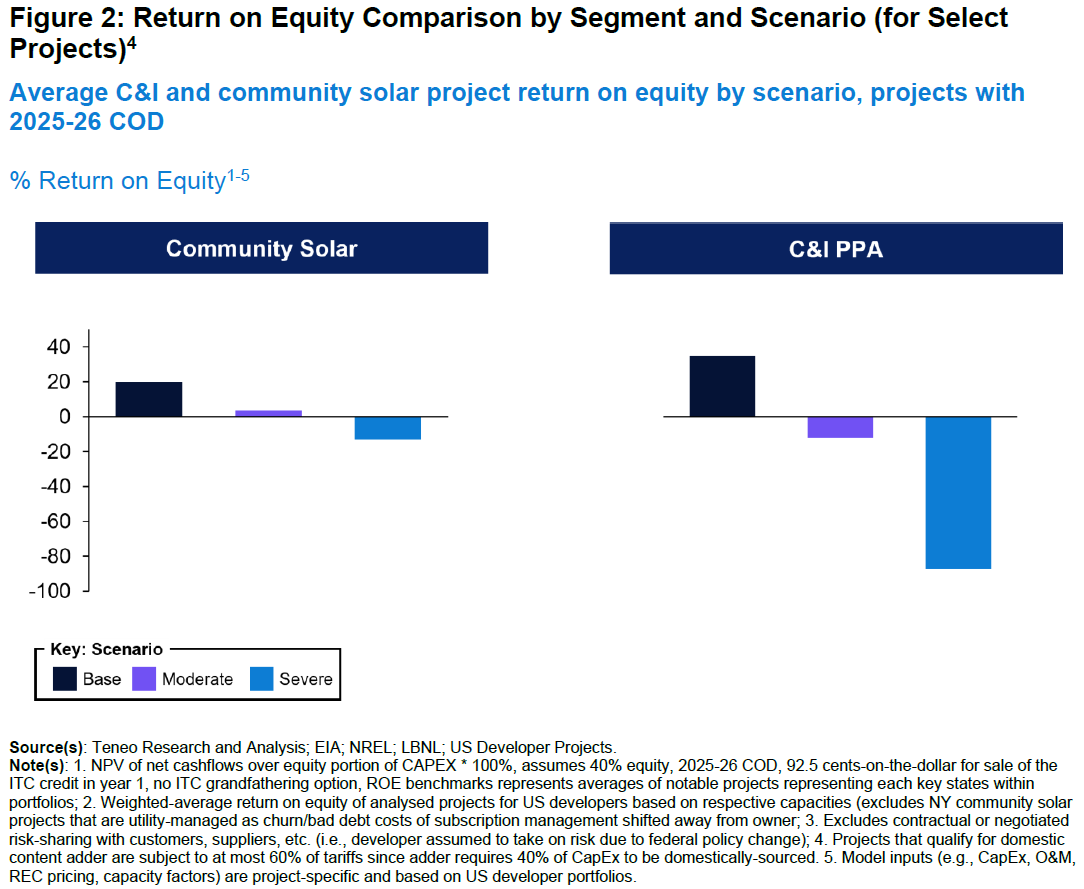
Returns for C&I solar plummet under a severe scenario, while community solar proves somewhat more resilient.
The implications of these cost increases on the pace of PV adoption in the C&I and community solar segments are equally significant. Combined ITC repeal5 and tariff hikes could reduce cumulative distributed solar capacity additions by 14-29% through 2030, with the C&I segment particularly impacted. The overall 2025-30 market could fall from 23GW to 14-20 GW.
Mitigating Factors: Sharing Risk, State-Level Action and Inflation Dynamics
Despite the significant risks to distributed energy resources (DER) profitability and growth discussed above, several exogenous factors could cushion the blow.
1: Cost-Sharing Appetite Across the Value Chain
Based on a Teneo panel survey of over 50 senior executives at U.S. distributed solar and storage developers,6 customers and suppliers are expected to absorb approximately 5-15% of the incremental cost caused by new tariffs. Additionally, the survey indicated that customers could also absorb approximately 15% of the effective cost of an ITC reduction. We also observed that, on average, suppliers added a 2-3% margin to pricing if aware that a project was expected to receive a 10% ITC adder, suggesting further possible flexibility to risk-sharing if ITC adders were removed.
2: State Renewable Energy Credits (RECs)
States like Illinois—where Renewable Portfolio Standards (RPS) remain unmet by a substantial margin—may see REC price increases serve as a substitute for reductions in federal subsidies. Fully offsetting the loss of the ITC would require REC prices to increase by approximately 70-155% for distributed C&I and community solar projects, and even more for utility-scale given higher capitalization. However, the effective shift of decarbonization cost from taxpayers to ratepayers may incite regulatory and political pushback given its impact on affordability.
3: Inflation and Retail Electricity Prices
Rising inflation offers a partial offset. Unlike electric retail rates, solar LCOEs are uncorrelated with inflation and may continue to decline due to technological advancements, thus improving the value proposition of behind-the-meter (BTM) solar. Since 2018, the U.S. consumer price index (CPI) and U.S. average total electric retail rates have increased at compound annual growth rates (CAGR) of 3.9% and 4.7%, respectively. In contrast, solar LCOEs declined at a CAGR of 3.5% over the same period.

4: Power Demand
A further uptick in power demand, particularly driven by data centers and onshoring of manufacturing, could create new solar and storage opportunities for developers. Over the past two years, the Federal Energy Regulatory Commission’s (FERC) five year load growth forecast has increased almost five-fold, from 23 to 128 GW.7 As demand grows, C&I customers will be able to realize additional benefits for BTM generation to address interconnection delays (e.g., permitting, expanded queue) as well as threats to electric grid reliability, which has worsened over the past decade with frequency and duration of outages growing at 0.8% and 5.0% CAGRs, respectively.8
Competitive Implications
In addition to market contraction and a decrease in overall margins, IRA retrenchment and new tariffs are expected to introduce a wave of consolidation, as suggested by the precedent set by California’s Net Energy Metering (NEM) 3.0 program. In this case, a steep drop in customer incentives of about 75% led to a shift in market share toward top-tier installers, with the median market share of the top five largest installers increasing by 40% while the aggregate market share of smaller installers dropped 18%.9
To protect project value propositions and margins, we expect developers to consider and, to varying degrees, pursue the following active measures:
- Pre-purchase inventory to meet eligibility for safe-harboring and ITC grandfathering.
- Price more strategically with end-users, including defining contractual terms and conditions that address the distribution of risks more carefully.
- Shift and diversify procurement strategies to optimize tariff risks and address supply chain constraints, including proactively developing relationships with promising new suppliers.
- Improve operating and capital productivity through adoption of new technologies (e.g., artificial intelligence for system design and marketing, improved field labor management), recalibration of resourcing strategies by function (in-house vs. outsourcing) and updating contracts with partners to reflect the new trade and subsidy environment.
- Shift to growth through operating project aggregation (i.e., M&A) vs. greenfield development, as costs of new developments increase faster than revenues.
- Pursue increased share of BTM rather than front-of-the-meter (FTM) projects, due to incremental benefits, including savings from rising grid charges and retail electric rates, less capital intensity and on-site reliability and resiliency benefits.
- Lead policy, regulatory and community advocacy campaigns to communicate challenging cost environment in which developers and independent power producers (IPPs) operate and reposition value of C&I and community solar projects in terms of key markets factors such as affordability, certainty/speed of supply and reliability.
1 Preliminary determinations; 3,400% CVD rate on Cambodian solar module imports.
2 Texas-based project with capacity factor of 24%, 2028 NREL CapEx and O&M, 92.5% ITC transfer haircut, 21% federal tax rate.
3 Assumes developers absorb effective cost increases without any risk-sharing with supplier nor customers.
4 Projects modeled using U.S. developer portfolio financials from 2025.
5 ITC repeal under a severe scenario removes all ITC adders, reduces based rate to 10%, and extends MACRS to 20 years.
6 Teneo-run panel of 50 executives at mid-sized to large renewable developers active in the C&I/community solar and storage market with roles of director to C-suite, held in April 2025.
7Strategic Industries Surging: Driving US Power Demand, Grid Strategies, December 2024.
8 According to the EIA, the US system average interruption frequency index (SAIFI) grew from 1.257 in 2014 to 1.348 in 2023, representing a 0.8% CAGR; the US system average duration index (SAIDI) grew from 236.2 in 2014 to 366.6 in 2023, equivalent to a 5.0% CAGR.
9 % change in top 5 California residential solar installers from April 2022-23 to April 2023-24 in order of largest market share to smallest were: SunPower (+44%), SunRun (-22%), Tesla (+17%), Bright Power (+40%), Freedom Forever (+100%); All others’ cumulative installs dropped from 60% market share to 49% market share over the same periods.
The views and opinions in these articles are solely of the authors and do not necessarily reflect those of Teneo. They are offered to stimulate thought and discussion and not as legal, financial, accounting, tax or other professional advice or counsel.