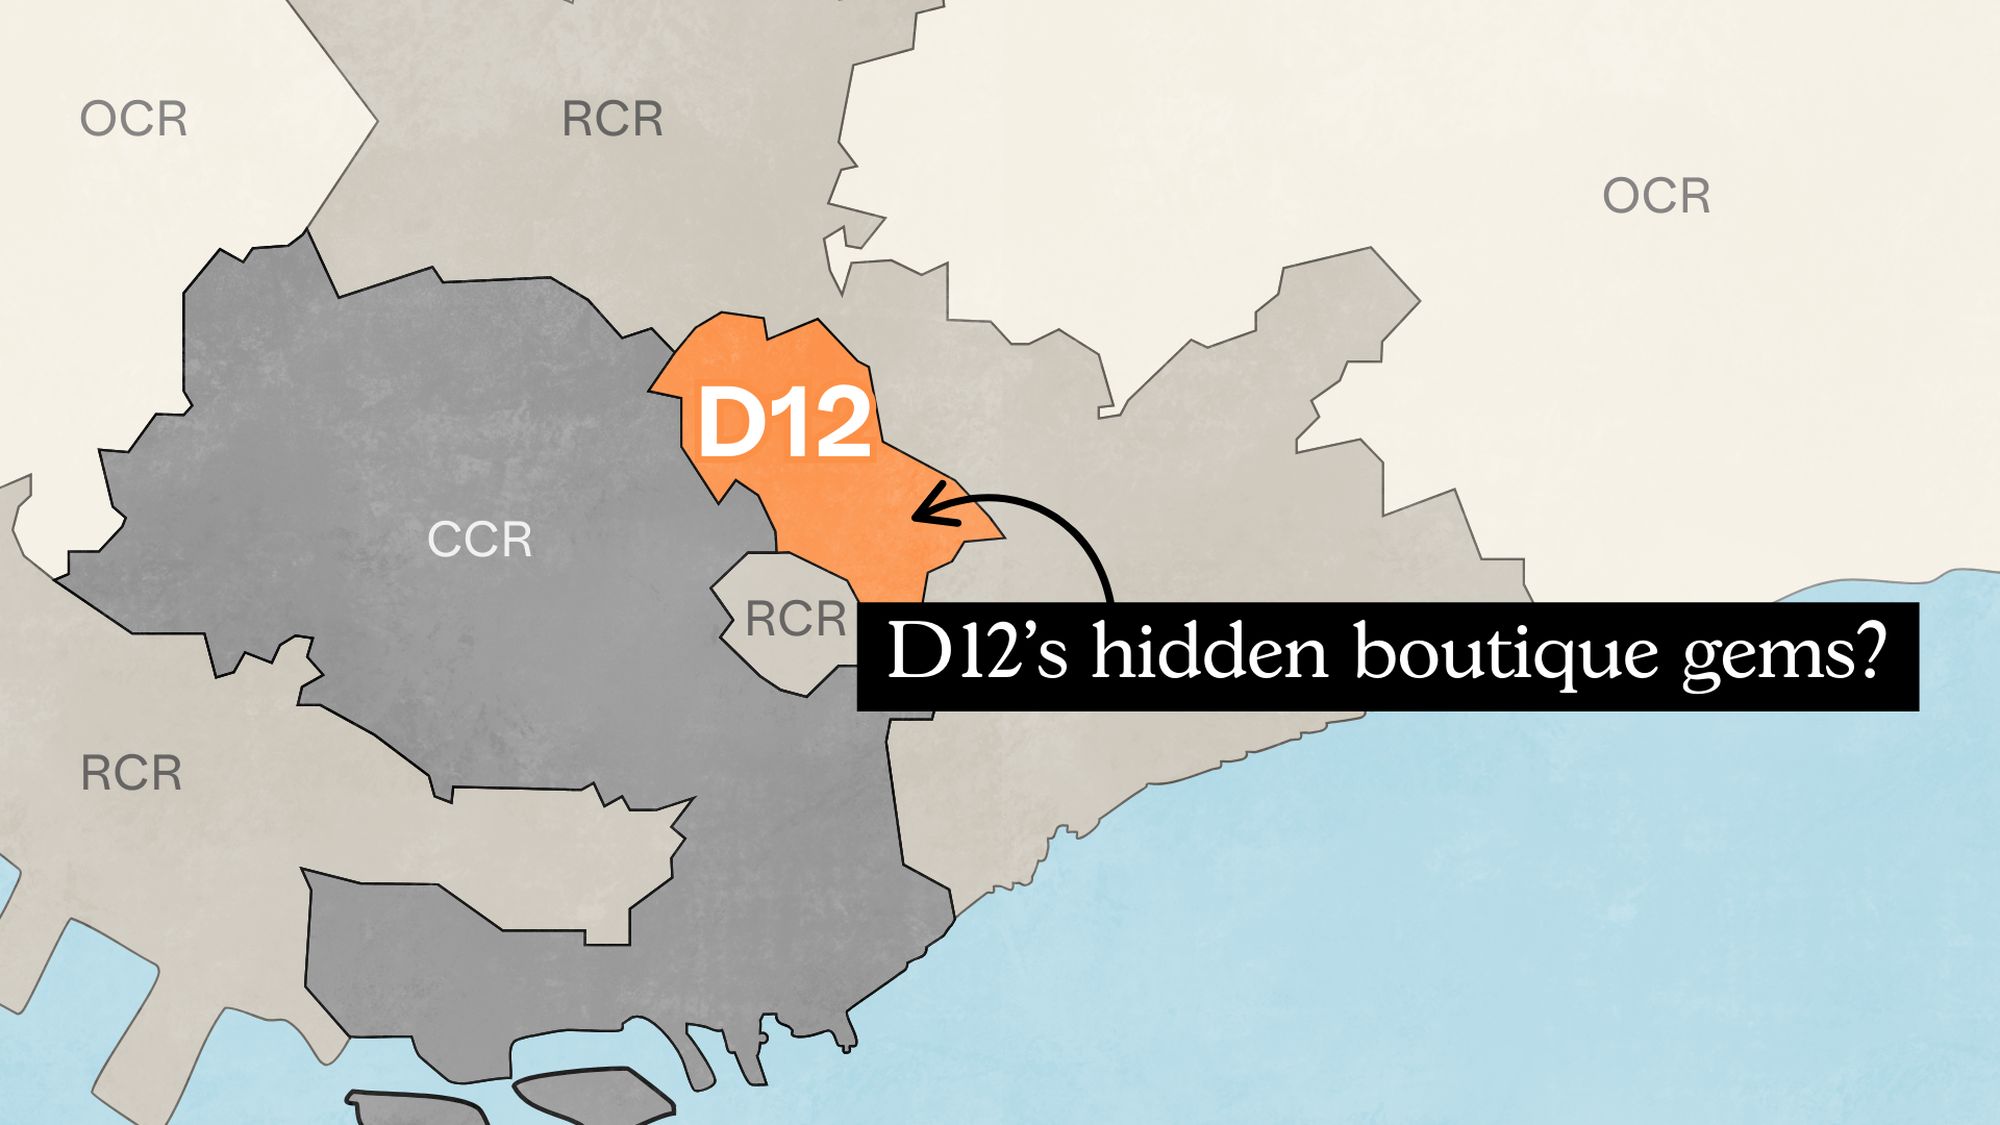
District 12 isn’t usually the first place you’d expect to find outperformers. Mention Balestier or Novena, and most buyers think of supper spots and old apartments before they think of condos. And to be frank, it is true that D12 is rather heavily built-up, and available land parcels are small; but there are boutique condos here that have punched above their weight, given the tight surroundings.
So, have boutique condos here managed to hold their own as investments? We analysed 10 years of resale transactions (2014–2024) to find out.
What do we mean by a boutique condo?
In general, these are condos with 150 units or fewer, though many in District 12 fall well below that threshold; some have fewer than 50 units. Because of their small scale, units are few and transactions may be rare. In such cases (e.g., only one transaction over more than a year), we’ve left those developments out of the analysis.
For consistency, we’ve focused on transactions from 2014 to 2024. This 10-year window gives us a clearer picture of how boutique condos have performed over time, as starting it from just five years ago would mainly reflect the COVID disruption.
The entire dataset for our study spans 2,364 condos in total, with the following breakdown:
| Number of units | Number of condos | In D12 Only | % Boutique In D12 |
| 50 or less | 1086 | 49 | 5% |
| 51 to 150 | 621 | 48 | 8% |
| 151 or more | 656 | 16 | 2% |
Within D12 alone, there were 49 developments with 50 units or fewer (around five per cent of our total boutique set), and another 48 projects that still fall within our boutique range. In fact, in the whole of D12, only 16 projects had more than 150 units – so we can see that boutique projects are the mainstay of the district, and larger projects here are quite rare.
Before diving into D12, let’s examine the overall performance of boutique condos in Singapore
| Year/Units | 0 to 50 | 51 – 150 | More than 150 |
| 2014 | $1,327 | $1,507 | $1,327 |
| 2015 | $1,252 | $1,473 | $1,257 |
| 2016 | $1,286 | $1,528 | $1,341 |
| 2017 | $1,286 | $1,547 | $1,390 |
| 2018 | $1,445 | $1,711 | $1,452 |
| 2019 | $1,416 | $1,804 | $1,594 |
| 2020 | $1,423 | $1,648 | $1,581 |
| 2021 | $1,466 | $1,786 | $1,682 |
| 2022 | $1,577 | $1,904 | $1,806 |
| 2023 | $1,782 | $2,016 | $1,964 |
| 2024 | $1,717 | $1,955 | $1,985 |
| Annualised | 2.61% | 2.64% | 4.11% |
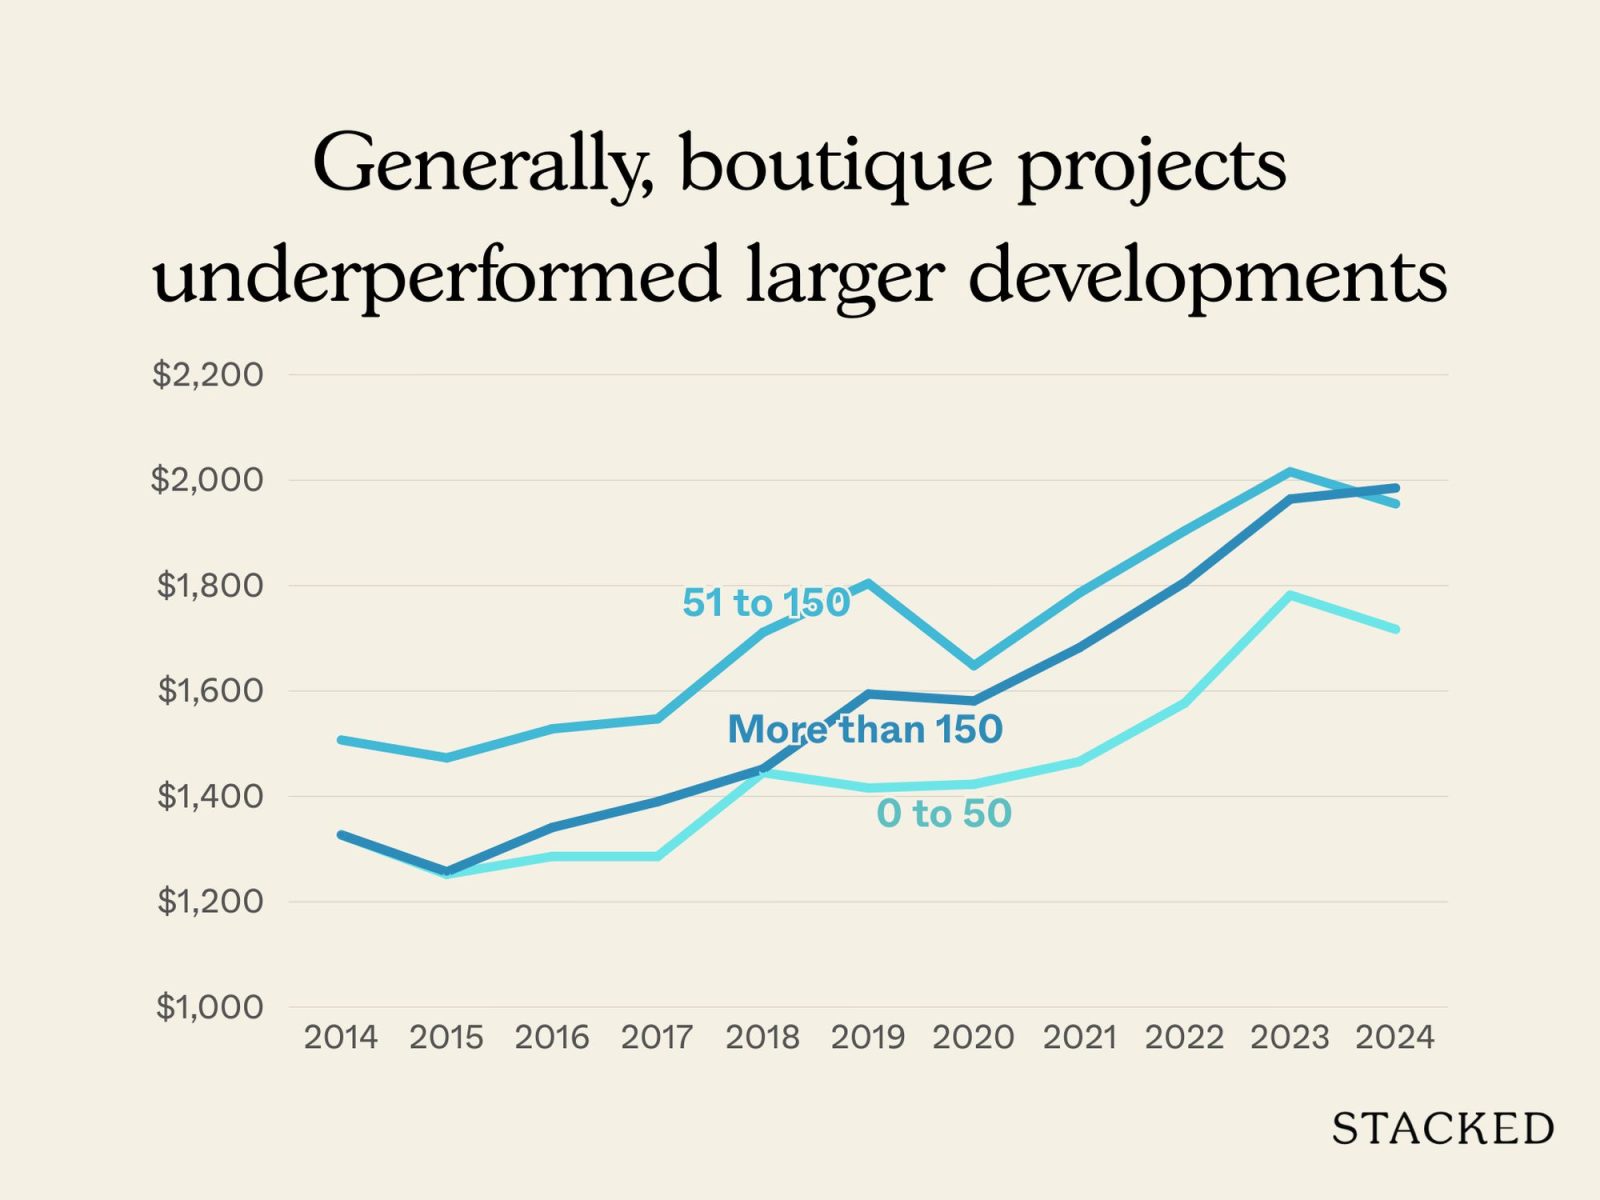
Over the past decade, boutique projects of 50 units across Singapore saw gains of 2.61 per cent. The bigger boutique condos (51 to 150 unit range) saw almost exactly the same performance at 2.64 per cent. By contrast, full-scale projects of more than 150 units pulled ahead, averaging 4.11 per cent annualised growth.
Bigger projects tend to benefit from stronger mass-market appeal and higher transaction volumes; that reduces volatility and keeps prices on a firmer upward trajectory. Boutique condos show slower or uneven appreciation, partly due to lower transaction volumes.
To avoid distortions from developer pricing and discounts, we should also look at sub sale and resale prices
| Year/Units | 0 to 50 | 51 – 150 | More than 150 |
| 2014 | $1,262 | $1,421 | $1,195 |
| 2015 | $1,214 | $1,373 | $1,193 |
| 2016 | $1,207 | $1,451 | $1,246 |
| 2017 | $1,216 | $1,497 | $1,279 |
| 2018 | $1,331 | $1,609 | $1,293 |
| 2019 | $1,367 | $1,594 | $1,357 |
| 2020 | $1,353 | $1,454 | $1,315 |
| 2021 | $1,413 | $1,556 | $1,381 |
| 2022 | $1,474 | $1,692 | $1,506 |
| 2023 | $1,647 | $1,780 | $1,636 |
| 2024 | $1,642 | $1,825 | $1,733 |
| Annualised | 2.67% | 2.53% | 3.79% |
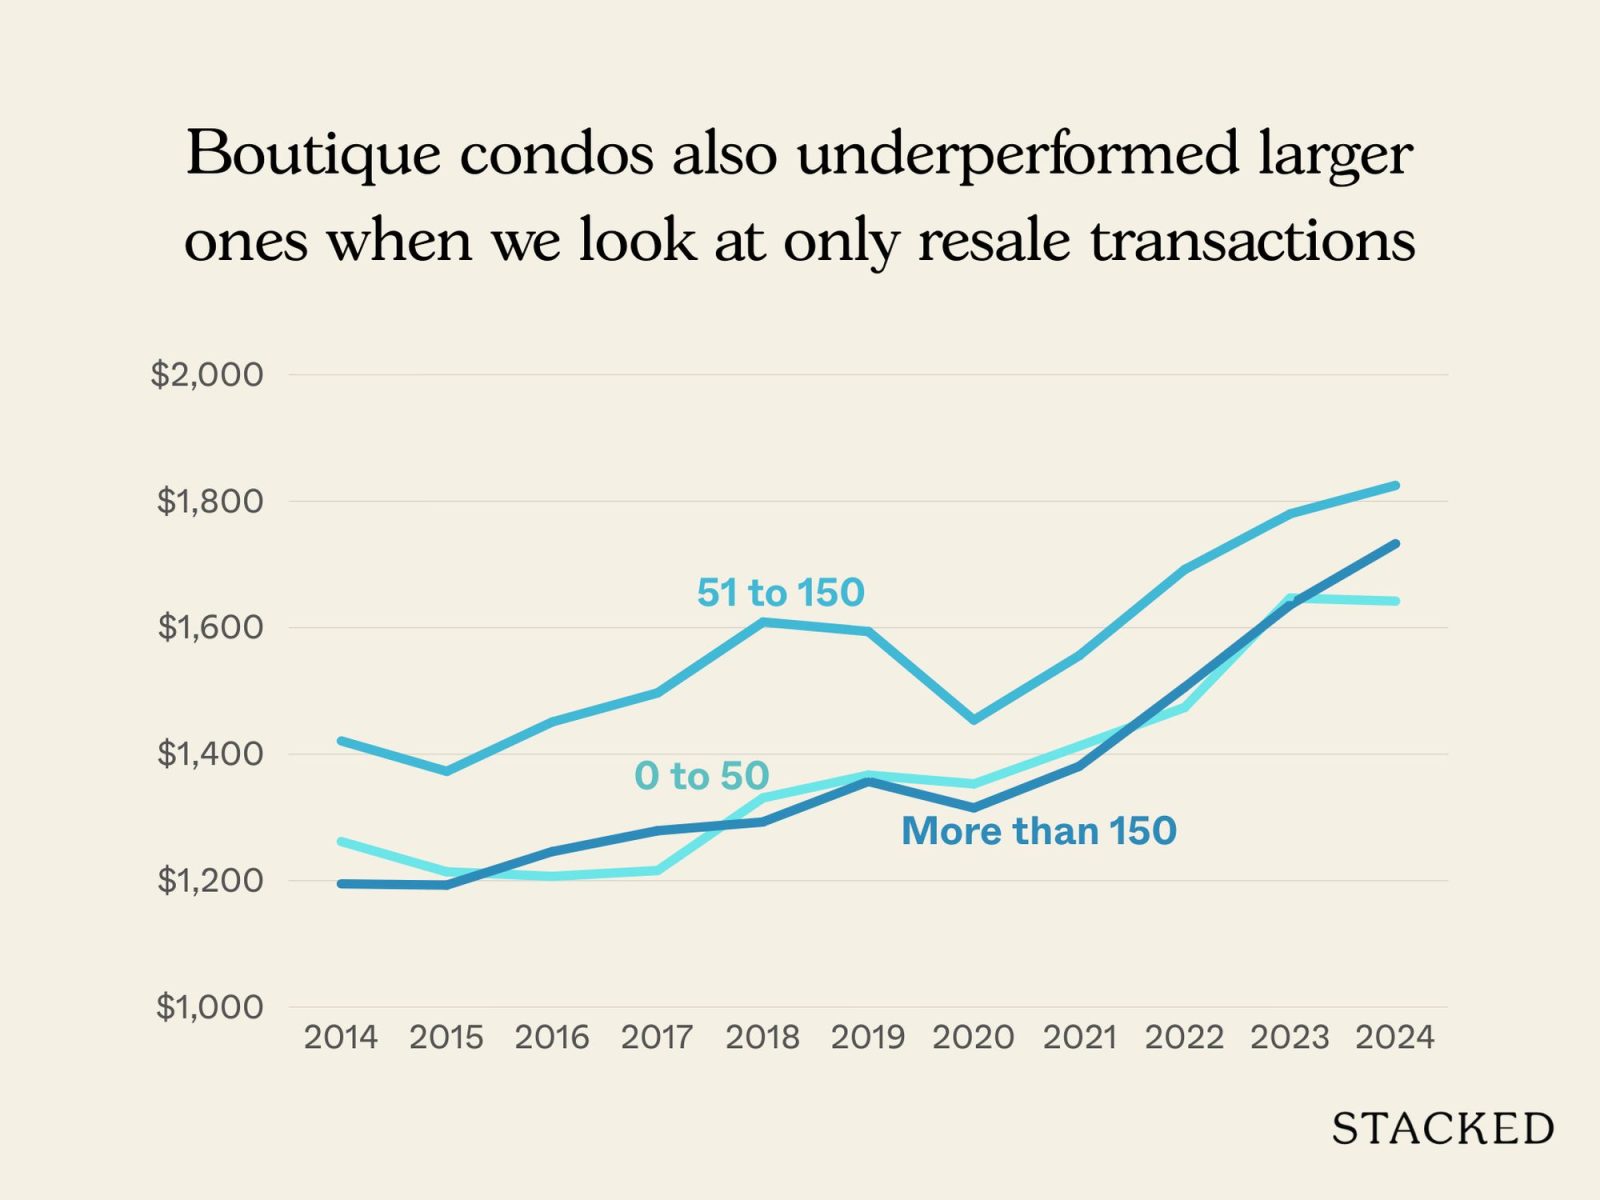
The conclusions are similar, even if we look at resale and sub sale transactions only. Boutique projects with 50 units or fewer saw annualised gains of 2.67 per cent, while those with 51–150 units performed almost the same at 2.53 per cent. Larger projects once again outperformed, at 3.79 per cent.
That’s a collective and not individual reality though: At the level of specific transactions, some sellers may experience very different outcomes from the average; but what we’re looking at here is simply the $PSF movement across the board. This smooths out those individual wins (and losses) into a digestible district-wide average.
Next, we need to look at actual transaction volumes, which is a common hazard with boutique projects
This is always the trickiest part when it comes to boutique condos. Because units are few and transactions are rare, any outliers can significantly skew the average (e.g., if there are only two transactions, then the much higher or lower one will skew the average accordingly).
| Year/Units | 0 to 50 | 51 – 150 | More than 150 |
| 2014 | 747 | 1766 | 9038 |
| 2015 | 655 | 1452 | 10628 |
| 2016 | 867 | 1639 | 12168 |
| 2017 | 1441 | 2760 | 17554 |
| 2018 | 1500 | 2582 | 15188 |
| 2019 | 882 | 1930 | 13768 |
| 2020 | 1030 | 1950 | 15211 |
| 2021 | 1796 | 3700 | 24044 |
| 2022 | 1299 | 2798 | 16335 |
| 2023 | 1112 | 2198 | 14466 |
| 2024 | 1039 | 1986 | 16814 |
| Total Volume | 12368 | 24761 | 165214 |
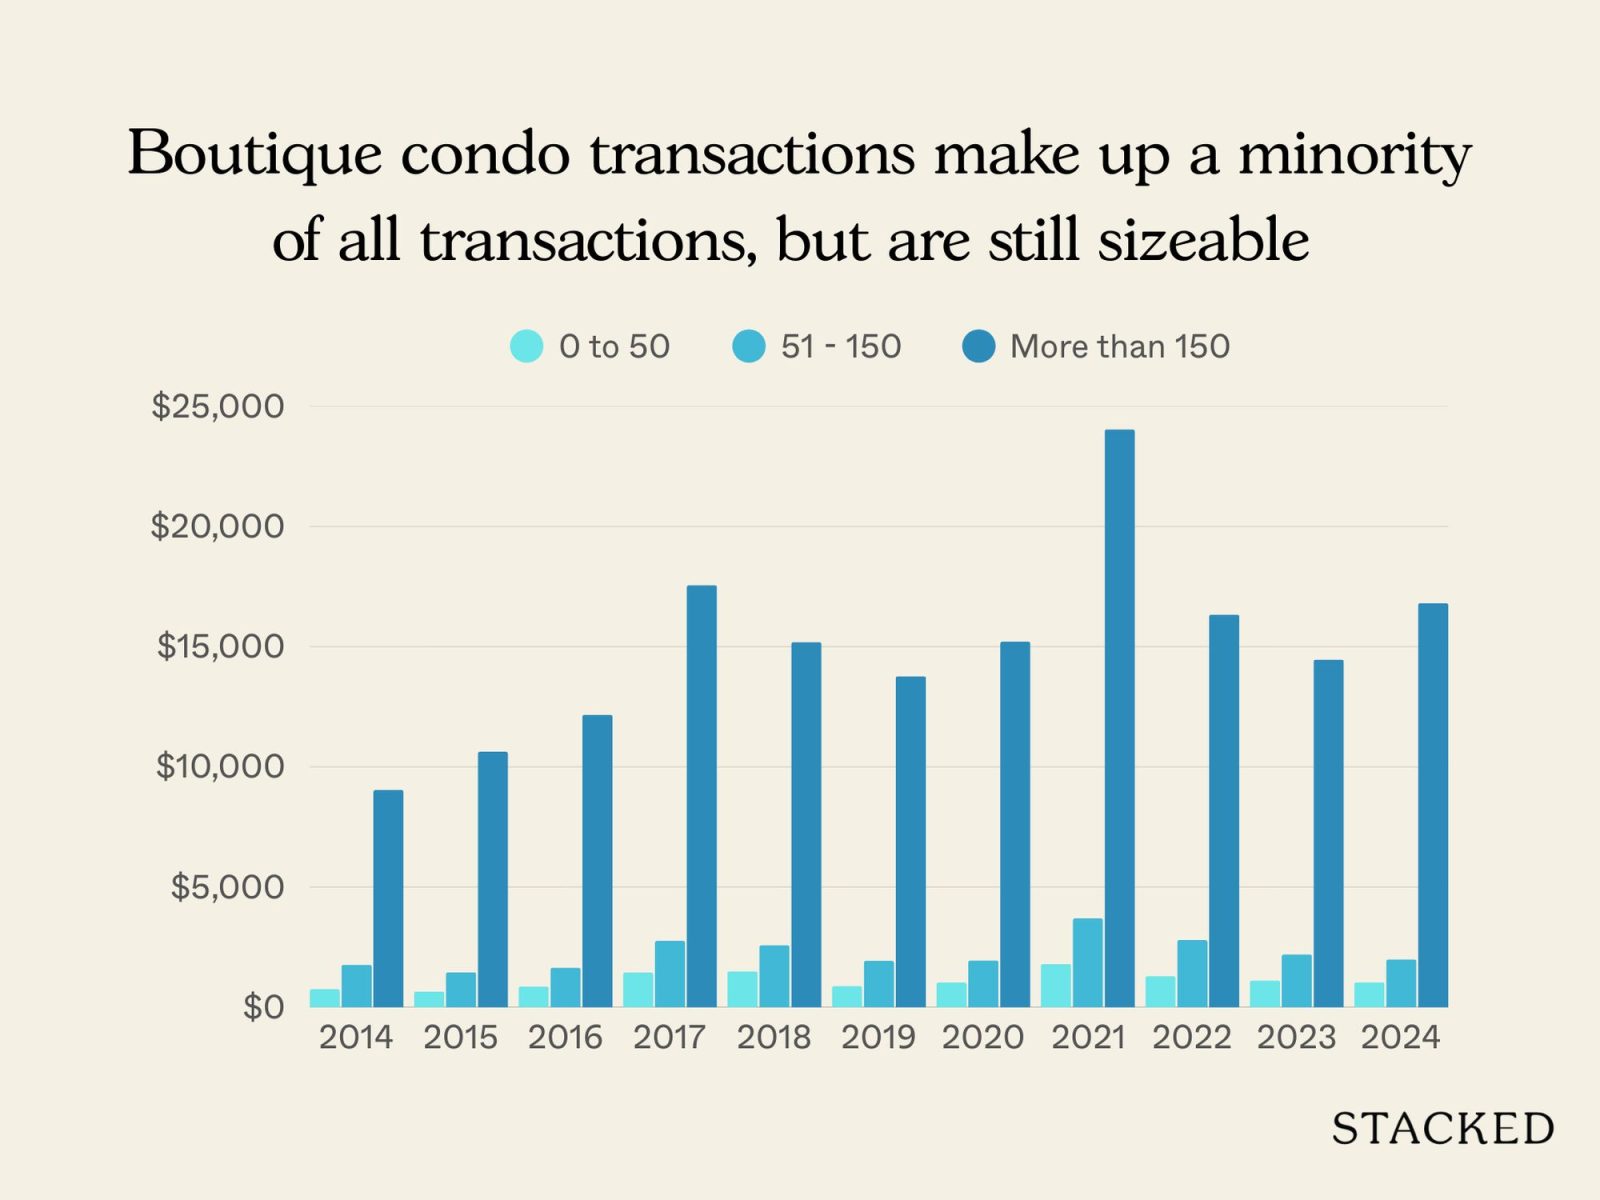
The “50 or fewer” unit condos may not have a lot of transactions individually, but their sheer numbers across the market still add up to a meaningful pool of sales. In fact, these very small condos account for about a third of all boutique condo transactions in Singapore.
That said, we still need to be careful when interpreting data, for the aforementioned reasons. The sale of a better renovated unit, or a sale that happens to be urgent, will still skew the data much more than it would for a full-sized condo.
So now that we know how boutique condos fared across Singapore, here’s a look at the overall gains for boutique condos in D12.
| Year/Units | 0 to 50 | 51 – 150 | More than 150 |
| 2014 | $1,267 | $1,161 | $1,401 |
| 2015 | $1,136 | $1,123 | $1,314 |
| 2016 | $1,110 | $1,132 | $1,302 |
| 2017 | $1,092 | $1,172 | $1,323 |
| 2018 | $1,221 | $1,299 | $1,397 |
| 2019 | $1,200 | $1,224 | $1,399 |
| 2020 | $1,197 | $1,275 | $1,432 |
| 2021 | $1,285 | $1,335 | $1,494 |
| 2022 | $1,392 | $1,447 | $1,611 |
| 2023 | $1,471 | $1,541 | $1,749 |
| 2024 | $1,513 | $1,589 | $1,823 |
| Annualised | 1.79% | 3.19% | 2.67% |
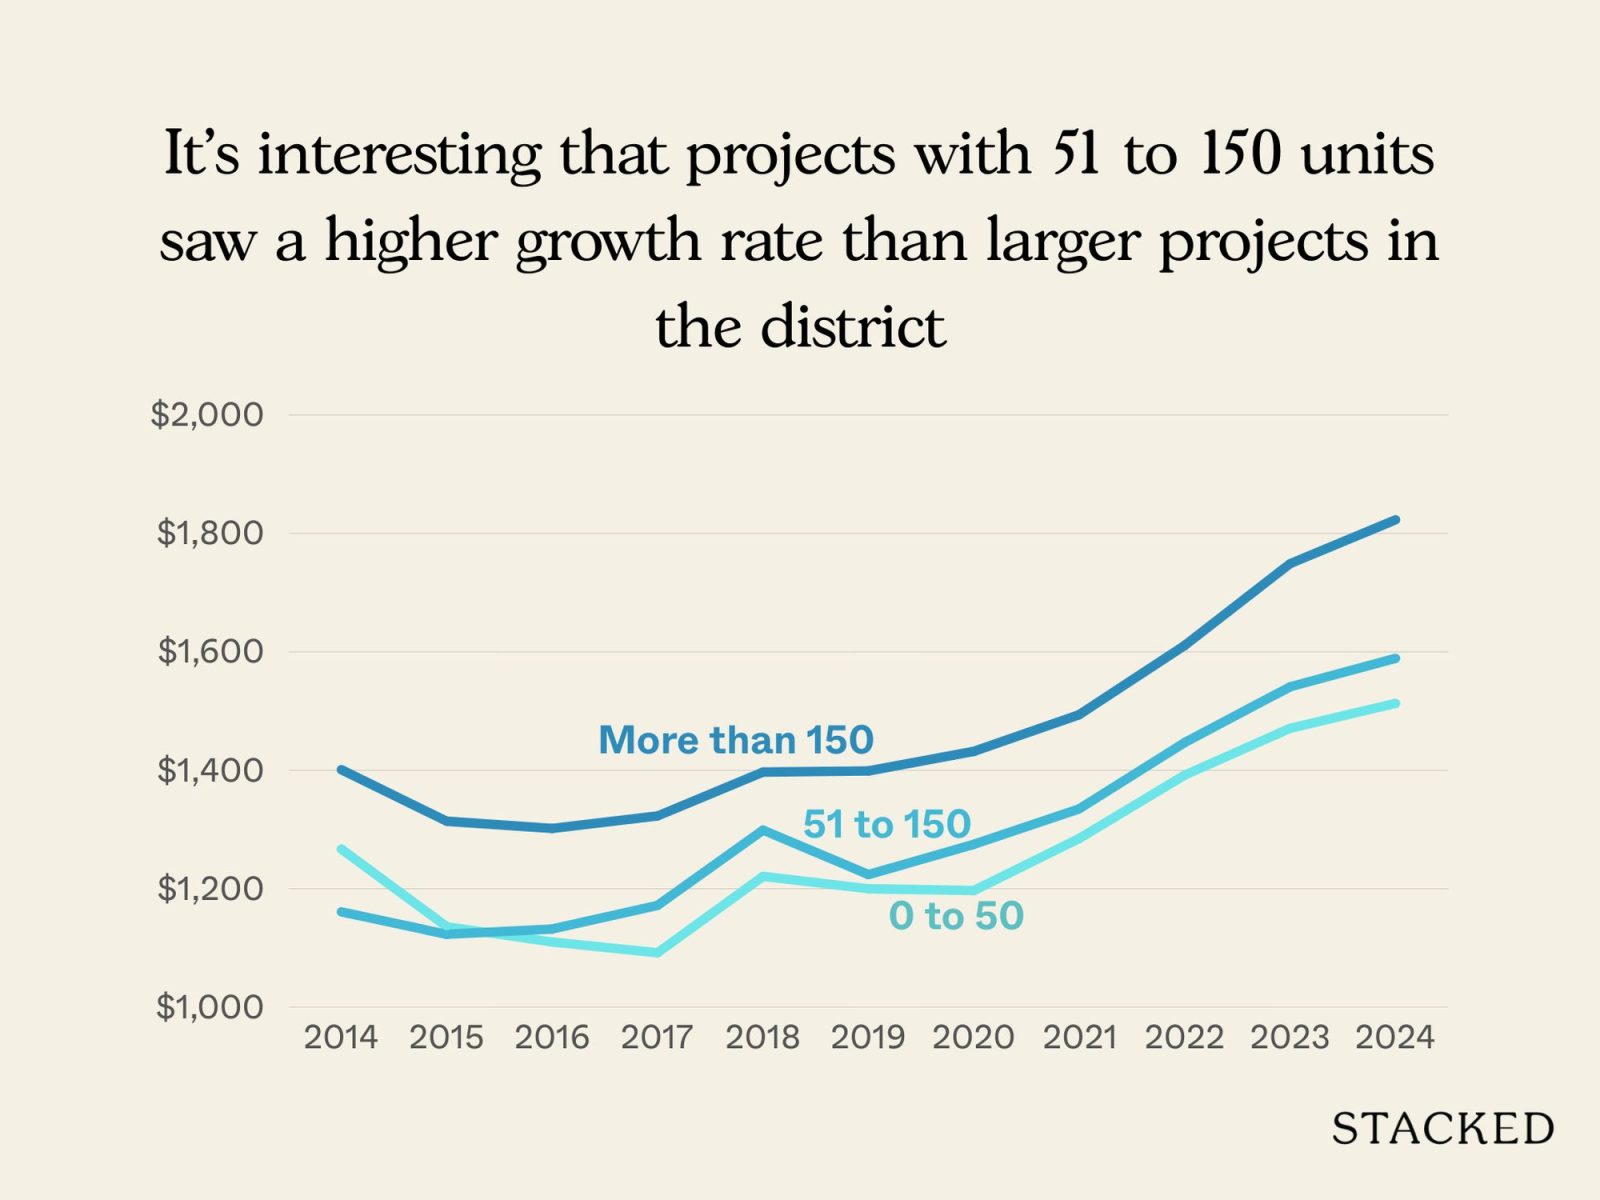
Boutique developments in D12 with 50 or fewer units recorded the lowest annualised growth at 1.79 per cent. Interestingly, those in the 51–150 unit range outperformed both smaller boutiques and even the larger developments, at 3.19 per cent. Larger projects, which usually dominate in performance, came in slightly lower at 2.67 per cent.
In D12, it appears the “mid-sized” boutique segment has struck the sweet spot: small enough to offer exclusivity, but perhaps large enough to hold better facilities or still keep maintenance costs reasonable.
Determining which boutique condos to focus on
We need to narrow the scope to boutique condos with at least one transaction between 2014 and 2016. Otherwise, launches that appeared later in the decade – and which lack resale history – will skew the data.
Likewise, projects that haven’t seen any transactions in the past two years were excluded, as their prices back then would no longer be relevant today.
We also removed condos that had no sales data in both the early (2014/15) and recent (2023/24) periods, since there’s no price movement to track for them.
That said, let’s zoom in on $PSF movement within the same projects, comparing transactions from 2014 and 2015 against those from 2023 and 2024.
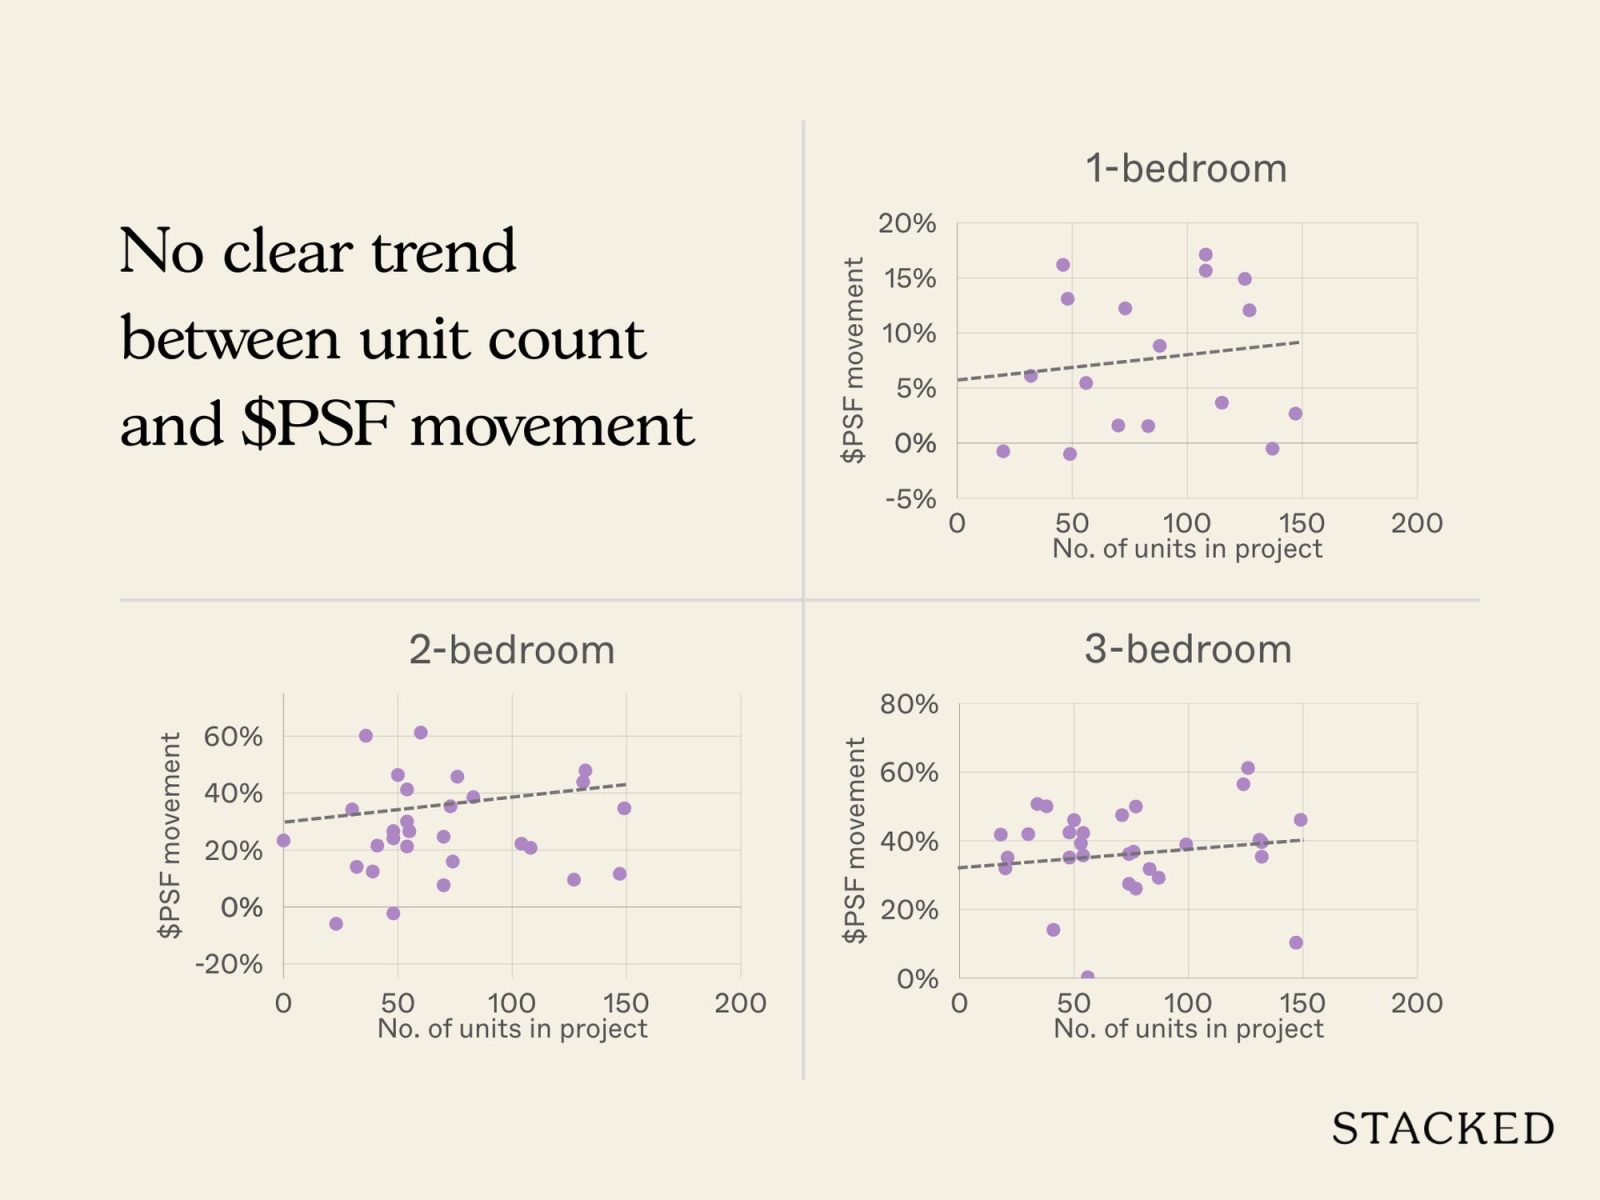
We have excluded the four-bedders as there was just one project with four-bedder transactions.
So far, we don’t really see any clear pattern. The number of units in a development appears to have little bearing on the $PSF change.
Instead, let’s see if the age of the developments has any bearing
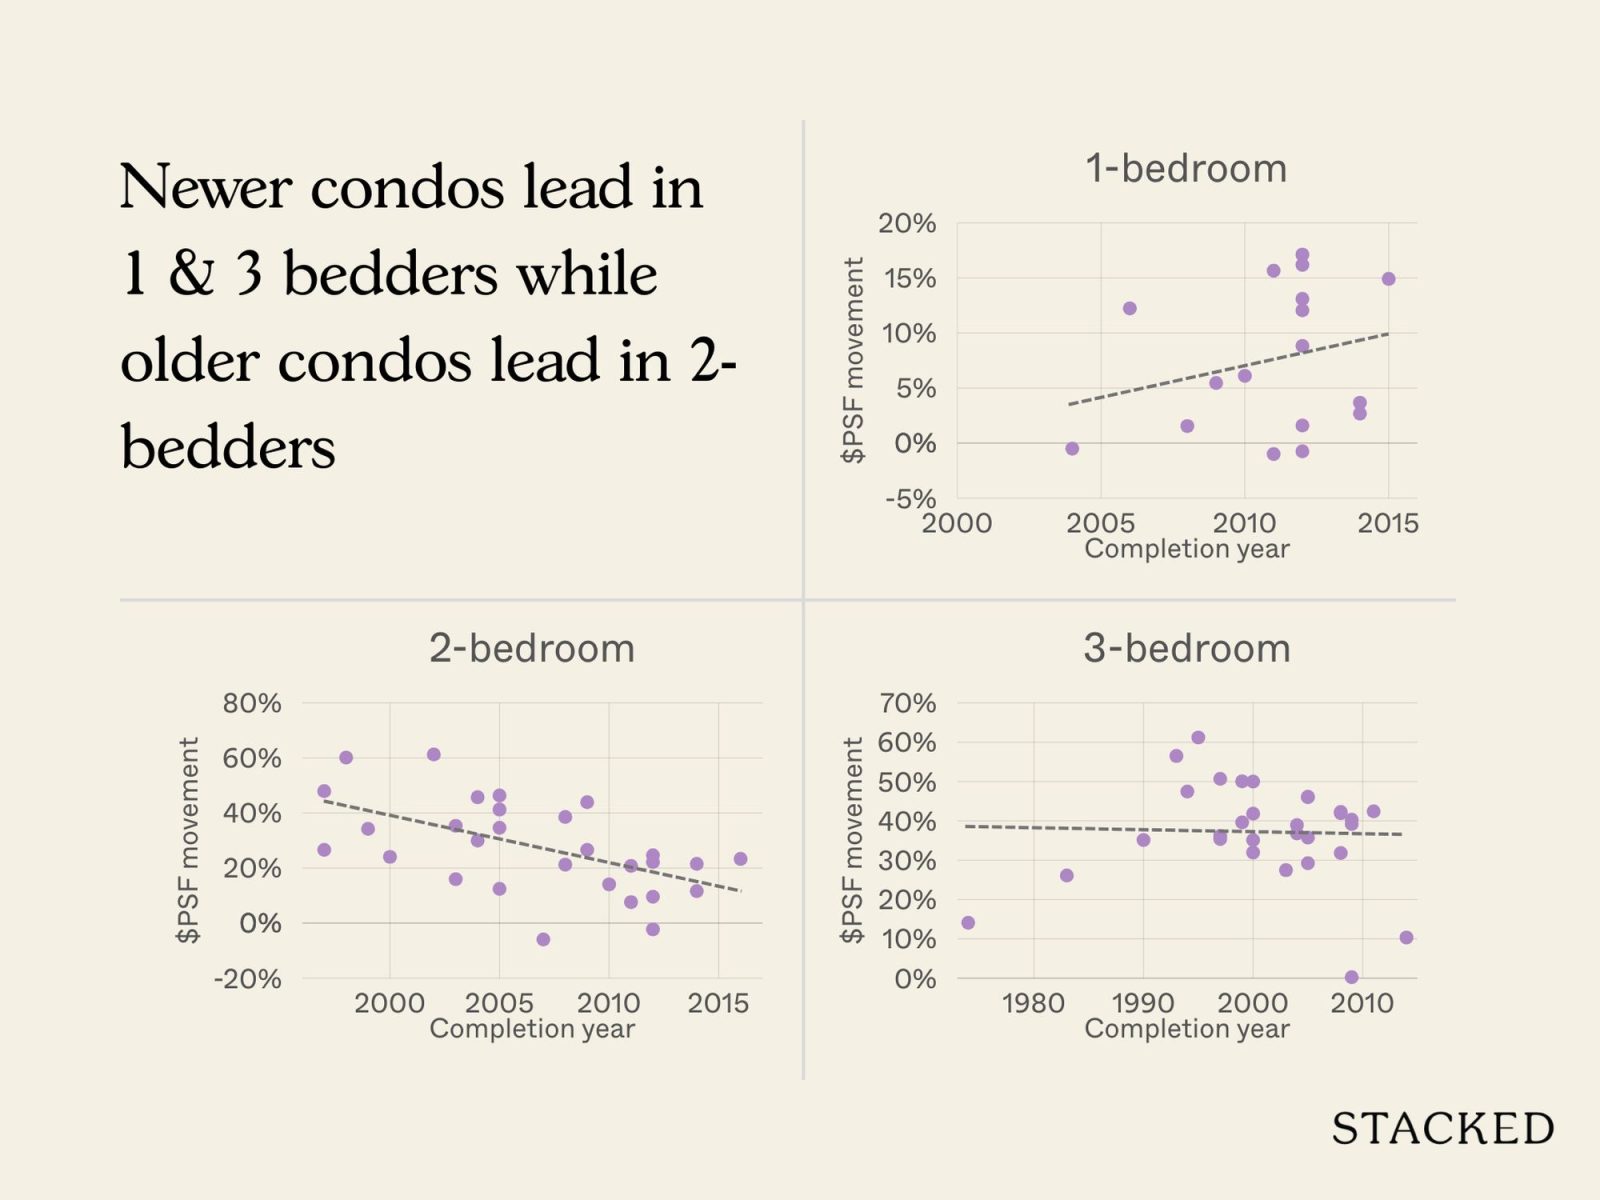
For the one- and three-bedders, newer projects appear to have the upper hand, showing stronger $PSF growth over the past decade.
Interestingly, the two-bedders buck this pattern, with older projects posting better results. It’s hard to be sure there’s any consistent reason though: transaction volumes are low, so we can’t be sure it’s a trend backed by a reason, and not a simple coincidence.
Let’s look at two other factors that may ground the results:
Some boutique condos sit right on the fringe of D11 and fall within walking distance of Novena MRT. Given Novena’s status as a medical and commercial hub, did these edge projects see stronger gains than their counterparts deeper in D12?
It’s also worth testing whether proximity to schools made a difference, particularly CHIJ Primary (Toa Payoh). Did being within that coveted one-kilometre radius translate into a measurable lift in $PSF over the past decade?
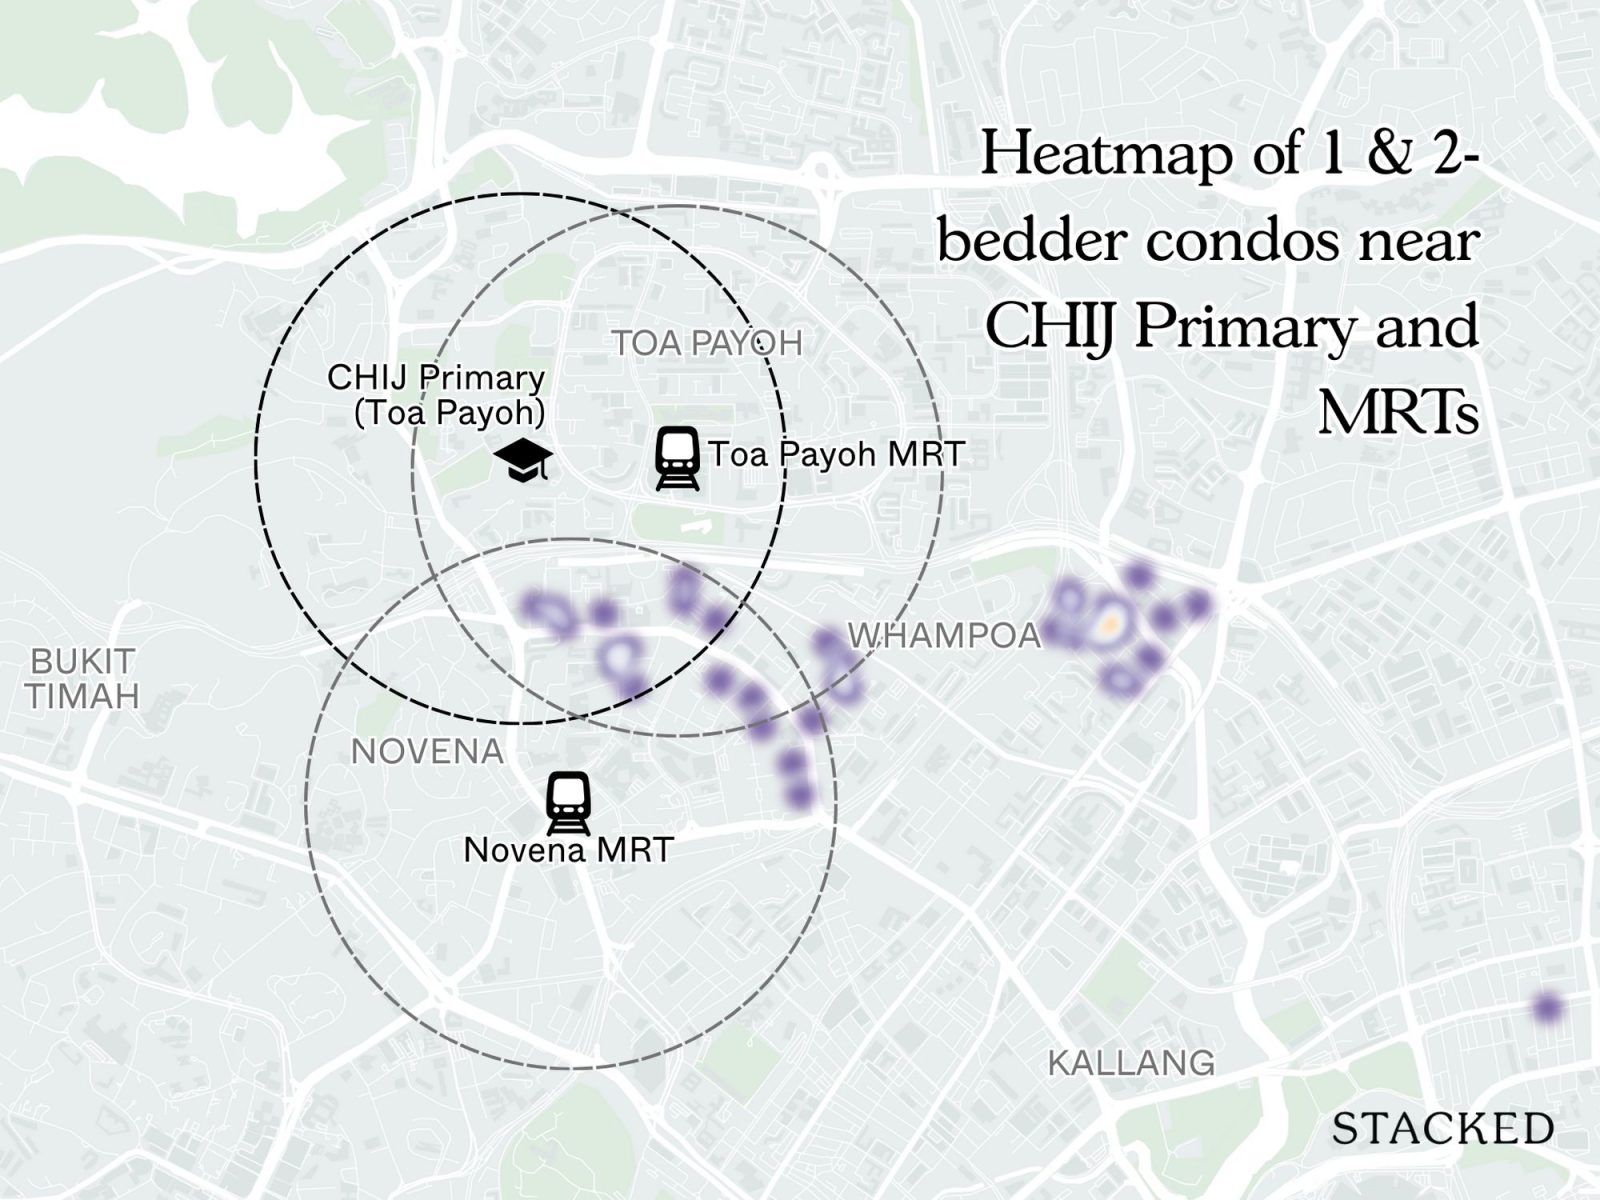
To find out, we can plot the percentage change of each condo onto a map, and we’ll start with the one and two-bedders:
One and two-bedders
Three-bedroom units
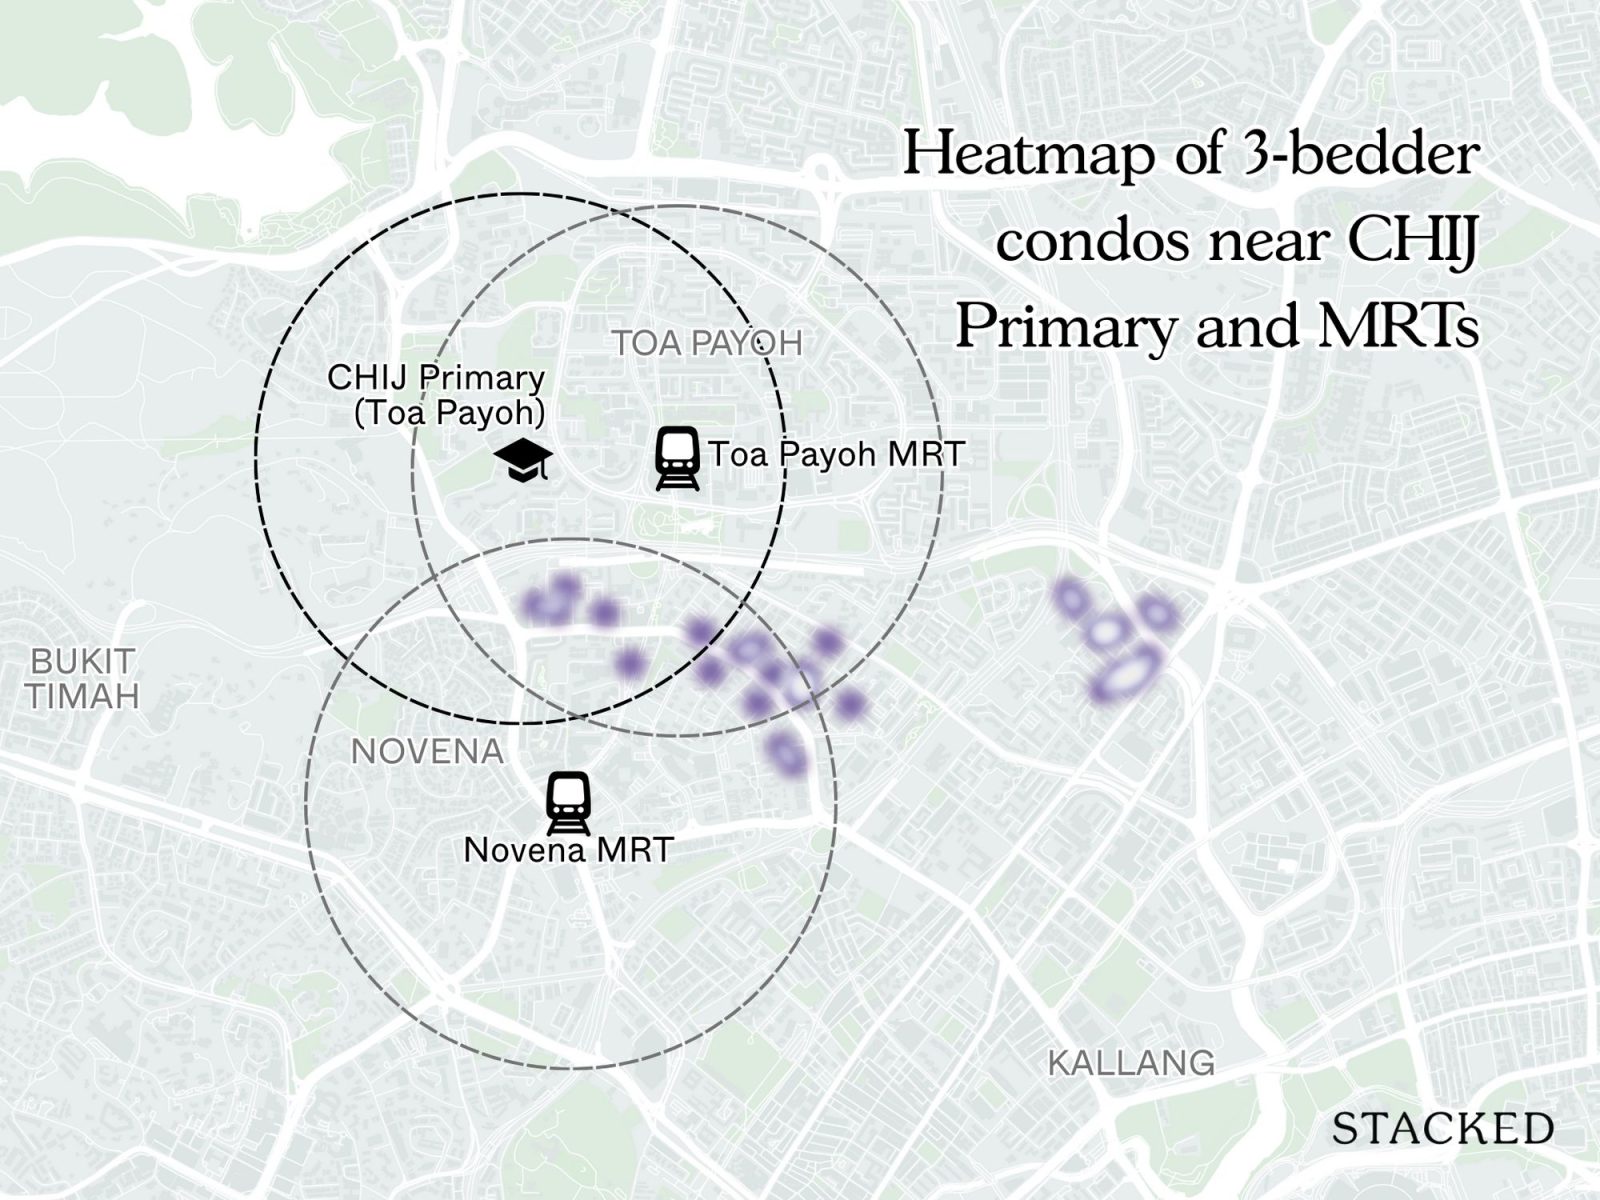
These are heat maps. First, we overlaid projects around one-kilometre radii around Novena MRT, Toa Payoh MRT, and CHIJ Primary (Toa Payoh).
(To keep things simple, the radius was drawn from a single central point rather than the full boundary of the school; to compensate, we added an extra 100 metres)
Note that “Within one kilometre” is a straight-line measure. Real-world walkability depends on crossings, shade, gradients, and detours. In this analysis, we use straight-line distances for consistency, but do remember they are not walk-time equivalents.
On these heat maps, each point represents a condo. The redder the point, the stronger its relative growth within its bedroom category.
Judging from the distribution though, there isn’t a consistent pattern of outsized gains tied to proximity to MRT stations or CHIJ Primary.
In fact, some of the top performers over the past decade – such as St Michael’s Condominium and St Francis Lodge – are located outside all three circles. While there are success stories within a one-kilometre radius, like Scenic Heights, Papillon, and Kim Keat House, the trend isn’t uniform.
This suggests that factors beyond just MRT stations or school proximity – such as project-specific traits, unit mix, or even timing of launches – likely played a bigger role in driving performance.
The map does suggest one consistent pattern: better-performing condos tend to be within one-kilometre of Novena and Toa Payoh MRT stations; but there’s an important caveat:
The tricky part here is that, just because the MRT station is within one-kilometre as the crow flies (i.e., a straight line), doesn’t mean it’s easily walkable; so the correlation does exist, but we shouldn’t read too much into the train station as a factor.
Ritz Mansions and Victory Heights are both near the MRT station, and both have held up well over the past decade. But strong performers can also be found outside the three circles, such as The Richmond, Moonstone View, and St Francis Court – so coupled with the discrepancy between straight distances and actual walkability, proximity to trains clearly isn’t a particularly strong factor.
From the heat map intensity, another pattern emerges: three-bedders seem to be doing better overall than their one- and two-bedder counterparts. This could reflect stronger demand from own-stay buyers, compared to smaller units that are more often rental assets.
Looking at the top and bottom five performers
Top 5 in terms of ROI
| Projects | Tenure | Units | Average of quantum | Average ROI | Volume | Popular School/MRT station |
| AVA TOWERS | Freehold | 124 | $424,367 | 35.25% | 13 | Within 1km of Novena MRT station* |
| SUNVILLE | Freehold | 147 | $332,130 | 29.87% | 10 | None |
| THE ABERDEEN | Freehold | 132 | $374,578 | 27.68% | 5 | None |
| ST FRANCIS LODGE | Freehold | 36 | $316,240 | 26.97% | 5 | None |
| CHELSEA GROVE | Freehold | 23 | $288,680 | 24.86% | 5 | Within 1km of Novena and Toa Payoh MRT stations* |
Bottom 5 in terms of ROI
| Projects | Tenure | Units | Average of quantum | Average ROI | Volume | Popular School/MRT station |
| VETRO | 999-years | 32 | $38,467 | 5.55% | 6 | None |
| SKYSUITES17 | Freehold | 115 | $67,992 | 7.96% | 13 | Within 1km of CHIJ Primary (Toa Payoh), Novena and Toa Payoh MRT stations |
| RIVERBAY | 999-years | 147 | $88,585 | 8.76% | 40 | None |
| THE TIER | Freehold | 48 | $75,998 | 9.91% | 5 | Within 1km of Novena MRT station* |
| AIRSTREAM | Freehold | 70 | $84,001 | 11.09% | 12 | None |
Among the top five performers, we see names like Ava Towers, Sunville, The Aberdeen, St Francis Lodge, and Chelsea Grove. Only two of them – Ava Towers and Chelsea Grove – are within one kilometre of Novena MRT station (NSL). But it’s worth noting that, while they’re within one-kilometre in a straight line, most would consider it too far to walk anyway, because it’s not a straight route. As such, this may be a coincidental correlation.
The bottom five projects – Vetro, Skysuites 17, Riverbay, The Tier, and Airstream – tend to be outside the heart of Balestier. For example, Riverbay and Vetro are positioned along St Michael’s Road, closer to the Kallang River than to Balestier’s main commercial strip.
Skysuites 17 sits deeper in the Whampoa area, away from the immediate conveniences of Balestier Road. Airstream and The Tier, meanwhile, are tucked along Balestier Road’s fringe. Skysuites 17 is within one kilometre of both Novena and Toa Payoh MRT stations as well as CHIJ Primary (Toa Payoh), yet still underperformed. Again, this may be due to the MRT stations being too far to be an easy walk, even if technically within one-kilometre.
So while there is a difference in terms of geography, it doesn’t seem specific to MRT or school issues.
Also note that all of these condos – top and bottom – are freehold/999-years, so tenure isn’t a factor here as well.
A closer look at the most profitable and unprofitable transactions
This will help us check the specific traits common to the various units. Here’s where owners scored their biggest wins:
| Project | Date Bought | Bought At | Date Sold | Sold For | Size | Bed | Gains | ROI (%) | Holding Period | type of sale | Floor | Stack |
| AVA TOWERS | 11/7/17 | $1,080,000 | 31/5/24 | $1,850,000 | 1281 | 3 | $770,000 | 71.30% | 6.9 | Resale to Resale | 8 | 2 |
| AVA TOWERS | 24/1/17 | $1,230,000 | 24/5/24 | $1,930,000 | 1281 | 3 | $700,000 | 56.91% | 7.3 | Resale to Resale | 20 | 2 |
| AVA TOWERS | 26/2/15 | $1,130,000 | 12/4/24 | $1,733,888 | 1227 | 3 | $603,888 | 53.44% | 9.1 | Resale to Resale | 12 | 3 |
| AVA TOWERS | 24/7/18 | $1,350,000 | 11/4/25 | $1,960,000 | 1281 | 3 | $610,000 | 45.19% | 6.7 | Resale to Resale | 12 | 1 |
| AVA TOWERS | 25/10/17 | $1,108,000 | 27/4/22 | $1,560,000 | 1173 | 3 | $452,000 | 40.79% | 4.5 | Resale to Resale | 4 | 4 |
| SUNVILLE | 18/9/15 | $1,060,000 | 23/5/24 | $1,810,000 | 1206 | 3 | $750,000 | 70.75% | 8.7 | Resale to Resale | 2 | 12 |
| SUNVILLE | 27/12/17 | $1,138,000 | 8/9/23 | $1,700,000 | 1130 | 3 | $562,000 | 49.38% | 5.7 | Resale to Resale | 8 | 14 |
| SUNVILLE | 4/9/17 | $1,050,000 | 14/2/22 | $1,438,000 | 1130 | 3 | $388,000 | 36.95% | 4.4 | Resale to Resale | 2 | 14 |
| SUNVILLE | 10/9/18 | $1,268,000 | 18/4/23 | $1,725,000 | 1173 | 3 | $457,000 | 36.04% | 4.6 | Resale to Resale | 6 | 11 |
| SUNVILLE | 3/12/15 | $980,000 | 24/2/23 | $1,300,000 | 947 | 2 | $320,000 | 32.65% | 7.2 | Resale to Resale | 8 | 3 |
| THE ABERDEEN | 30/6/15 | $1,175,000 | 28/8/23 | $1,738,000 | 1109 | 2 | $563,000 | 47.91% | 8.2 | Resale to Resale | 3 | 11 |
| THE ABERDEEN | 19/10/17 | $1,388,000 | 22/7/24 | $1,980,000 | 1302 | 3 | $592,000 | 42.65% | 6.8 | Resale to Resale | 7 | 12 |
| THE ABERDEEN | 11/4/17 | $1,588,000 | 20/2/23 | $2,070,888 | 1765 | 3 | $482,888 | 30.41% | 5.9 | Resale to Resale | 5 | 10 |
| THE ABERDEEN | 7/4/15 | $1,350,000 | 29/12/20 | $1,485,000 | 1302 | 3 | $135,000 | 10.00% | 5.7 | Resale to Resale | 9 | 3 |
| THE ABERDEEN | 28/8/15 | $1,350,000 | 16/10/20 | $1,450,000 | 1302 | 3 | $100,000 | 7.41% | 5.1 | Resale to Resale | 7 | 7 |
| ST FRANCIS LODGE | 29/11/17 | $1,130,000 | 26/7/22 | $1,600,000 | 1216 | 2 | $470,000 | 41.59% | 4.7 | Resale to Resale | 2 | 2 |
| ST FRANCIS LODGE | 3/9/14 | $1,055,800 | 17/6/21 | $1,380,000 | 1238 | 2 | $324,200 | 30.71% | 6.8 | Resale to Resale | 4 | 1 |
| ST FRANCIS LODGE | 25/5/21 | $1,395,000 | 7/8/24 | $1,700,000 | 1216 | 2 | $305,000 | 21.86% | 3.2 | Resale to Resale | 3 | 4 |
| ST FRANCIS LODGE | 30/7/14 | $1,088,000 | 19/11/20 | $1,325,000 | 1227 | 2 | $237,000 | 21.78% | 6.3 | Resale to Resale | 7 | 3 |
| ST FRANCIS LODGE | 22/3/18 | $1,295,000 | 3/6/22 | $1,540,000 | 1238 | 2 | $245,000 | 18.92% | 4.2 | Resale to Resale | 3 | 3 |
| CHELSEA GROVE | 9/2/17 | $1,080,000 | 1/4/25 | $1,454,000 | 980 | 2 | $374,000 | 34.63% | 8.1 | Resale to Resale | 5 | 3 |
| CHELSEA GROVE | 2/7/20 | $1,122,000 | 6/7/23 | $1,500,000 | 958 | 2 | $378,000 | 33.69% | 3.0 | Resale to Resale | 6 | 1 |
| CHELSEA GROVE | 24/11/17 | $1,368,000 | 28/2/22 | $1,700,000 | 1496 | 2 | $332,000 | 24.27% | 4.3 | Resale to Resale | 3 | 1 |
| CHELSEA GROVE | 22/5/15 | $1,192,600 | 28/6/22 | $1,400,000 | 947 | 2 | $207,400 | 17.39% | 7.1 | Resale to Resale | 5 | 2 |
| CHELSEA GROVE | 11/1/18 | $1,060,000 | 18/6/21 | $1,212,000 | 947 | 2 | $152,000 | 14.34% | 3.4 | Resale to Resale | 4 | 2 |
And here is where sellers saw the biggest losses:
| Project | Date Bought | Bought At | Date Sold | Sold For | Size | Bed | Gains | ROI (%) | Holding Period | type of sale | Floor | Stack |
| VETRO | 6/3/15 | $770,000 | 13/2/20 | $710,000 | 614 | 2 | -$60,000 | -7.79% | 4.9 | Resale to Resale | 4 | 2 |
| VETRO | 11/11/14 | $620,000 | 28/6/19 | $585,000 | 474 | 1 | -$35,000 | -5.65% | 4.6 | Resale to Resale | 15 | 1 |
| VETRO | 2/2/15 | $755,000 | 8/2/21 | $742,000 | 614 | 2 | -$13,000 | -1.72% | 6.0 | Resale to Resale | 13 | 2 |
| VETRO | 16/8/18 | $585,000 | 10/11/21 | $645,000 | 474 | 1 | $60,000 | 10.26% | 3.2 | Resale to Resale | 16 | 1 |
| VETRO | 20/4/18 | $730,000 | 13/5/22 | $838,800 | 614 | 2 | $108,800 | 14.90% | 4.1 | Resale to Resale | 11 | 2 |
| SKYSUITES17 | 25/5/15 | $650,000 | 10/7/18 | $635,000 | 366 | 1 | -$15,000 | -2.31% | 3.1 | Resale to Resale | 16 | 4 |
| SKYSUITES17 | 23/4/14 | $660,000 | 11/8/22 | $658,000 | 366 | 1 | -$2,000 | -0.30% | 8.3 | Sub Sale to Resale | 8 | 4 |
| SKYSUITES17 | 13/11/17 | $625,000 | 6/10/21 | $631,900 | 355 | 1 | $6,900 | 1.10% | 3.9 | Resale to Resale | 21 | 2 |
| SKYSUITES17 | 16/6/15 | $1,442,000 | 14/1/21 | $1,498,000 | 1066 | 3 | $56,000 | 3.88% | 5.6 | Resale to Resale | 11 | 3 |
| SKYSUITES17 | 1/8/16 | $580,000 | 26/4/21 | $610,000 | 355 | 1 | $30,000 | 5.17% | 4.7 | Resale to Resale | 18 | 2 |
| RIVERBAY | 2/7/15 | $608,600 | 11/9/20 | $570,000 | 388 | 1 | -$38,600 | -6.34% | 5.2 | New Sale to Resale | 22 | 3 |
| RIVERBAY | 31/7/14 | $729,300 | 14/8/20 | $690,000 | 517 | 1 | -$39,300 | -5.39% | 6.0 | New Sale to Resale | 11 | 2 |
| RIVERBAY | 1/9/14 | $893,760 | 24/7/19 | $850,000 | 657 | 2 | -$43,760 | -4.90% | 4.9 | New Sale to Resale | 11 | 9 |
| RIVERBAY | 2/7/15 | $1,044,650 | 13/8/20 | $1,040,000 | 786 | 2 | -$4,650 | -0.45% | 5.1 | New Sale to Resale | 19 | 6 |
| RIVERBAY | 8/9/14 | $1,027,520 | 2/12/20 | $1,030,000 | 786 | 2 | $2,480 | 0.24% | 6.2 | New Sale to Resale | 23 | 6 |
| THE TIER | 26/2/14 | $830,000 | 19/9/24 | $812,088 | 549 | 1 | -$17,912 | -2.16% | 10.6 | Resale to Resale | 13 | 1 |
| THE TIER | 28/2/14 | $760,000 | 9/9/22 | $828,000 | 538 | 2 | $68,000 | 8.95% | 8.5 | Resale to Resale | 4 | 1 |
| THE TIER | 10/9/14 | $780,000 | 13/12/21 | $870,000 | 538 | 2 | $90,000 | 11.54% | 7.3 | Resale to Resale | 7 | 3 |
| THE TIER | 29/12/16 | $728,000 | 8/6/22 | $828,000 | 538 | 2 | $100,000 | 13.74% | 5.4 | Resale to Resale | 7 | 1 |
| THE TIER | 9/10/15 | $800,000 | 17/12/21 | $939,900 | 646 | 2 | $139,900 | 17.49% | 6.2 | Resale to Resale | 2 | 1 |
| AIRSTREAM | 24/3/14 | $695,000 | 10/3/21 | $640,000 | 474 | 1 | -$55,000 | -7.91% | 7.0 | Resale to Resale | 10 | 7 |
| AIRSTREAM | 28/8/14 | $550,000 | 20/8/21 | $540,000 | 334 | 1 | -$10,000 | -1.82% | 7.0 | Resale to Resale | 3 | 4 |
| AIRSTREAM | 9/9/16 | $680,000 | 2/8/21 | $680,000 | 495 | 1 | $0 | 0.00% | 4.9 | Resale to Resale | 5 | 2 |
| AIRSTREAM | 7/6/18 | $650,000 | 6/1/22 | $655,000 | 474 | 1 | $5,000 | 0.77% | 3.6 | Resale to Resale | 2 | 3 |
| AIRSTREAM | 12/11/15 | $639,988 | 15/1/21 | $658,000 | 495 | 1 | $18,012 | 2.81% | 5.2 | Resale to Resale | 5 | 5 |
The biggest winners are generally the larger units: three-bedders first, then followed by the more spacious two-bedders. At Ava Towers, Sunville, and The Aberdeen, it’s the three-bedroom units that delivered the strongest returns, with owners regularly pocketing gains of 40 to 70 per cent.
In contrast, many of the units that struggled to turn a profit were one-bedders in projects like Vetro, Skysuites 17, Riverbay, and Airstream. It would seem that, besides being further from the heart of Balestier, these projects also saw lower averages because the transactions involved one-bedders.
Here’s a quick breakdown:
Profitable transactions
| No. of bedrooms | Average ROI | Average size (sqft) | Average sale price | No. of projects | No. of tnx |
| 1 | 10.81% | 526 | $795,244 | 16 | 68 |
| 2 | 20.99% | 898 | $1,292,248 | 40 | 117 |
| 3 | 25.09% | 1209 | $1,618,808 | 39 | 115 |
| 4 | 21.39% | 2094 | $2,679,500 | 3 | 4 |
| 5 | 23.65% | 3499 | $3,585,000 | 1 | 2 |
Unprofitable transactions
| No. of bedrooms | Average ROI | Average size (sqft) | Average sale price | No. of projects | No. of tnx |
| 1 | -3.57% | 457 | $675,361 | 8 | 11 |
| 2 | -2.72% | 697 | $929,857 | 5 | 7 |
| 3 | -3.95% | 1367 | $1,410,000 | 1 | 1 |
Notice that, even within the one- and two-bedroom categories, the more profitable transactions tended to involve larger units. For one-bedders, the profitable condos averaged about 526 sq ft, compared to just 457 sq ft for the unprofitable ones.
Among two-bedders, the profitable units averaged 898 sq ft, while the less successful ones came in at around 697 sq ft.
For three-bedders, there was a single unprofitable transaction, and that unit happened to be larger than the average size of profitable three-bedders; but such a one-off case is not really representative.
Overall, the data shows far more profitable three-bedroom transactions than unprofitable ones, underscoring the resilience of family-sized layouts in D12.
This matches a general trend across Singapore, where larger unit types tend to post higher ROI over the long term.
Smaller units often appeal more to investors than homeowners, and their performance is more vulnerable to rental demand, market cycles, and even competition from new launches.
As an aside, realtors have often claimed that the holding period correlates to size, and this also impacts gains. Own-stay buyers tend to buy larger units and sell less frequently, whereas investors are more likely to buy and flip smaller units. The longer holding periods of own-stay buyers can thus end up pushing up their percentage gains.
Conclusion
For D12, the numbers show little correlation between the number of units and profitability. There is also no strong link between age and performance. Proximity to a popular primary school also wasn’t a guarantee of success.
While it certainly doesn’t hurt to be within one kilometre of a school or train station, this may help saleability rather than literal gains (e.g., you might be able to find a buyer sooner, but this doesn’t guarantee they’ll pay much more). In addition, for MRT stations, actual walkability likely matters more than literal distance – so you may need to do a bit of old fashioned legwork and walk the actual routes.
(As an aside, some parents may not like it if their children need to cross multiple roads, even if the walk-time is reasonably short.)
Where clear patterns did emerge was in unit size, and the proximity to Balestier proper:
Larger layouts – particularly three-bedders and more spacious two-bedders – saw greater appreciation, a trend consistent not just in D12 but across Singapore. In addition, the projects further away from the centre of Balestier (but still within D12) tended to fare worse.
So for those buying boutique projects in Balestier, these two qualities could be vital to your checklist, if resale gains are a priority.
The challenge with buying in District 12 isn’t just about being near the MRT or a top school; those are often surface-level considerations that influence speed of sale rather than profitability. The deeper factor, as the numbers show, is whether your unit type and location within the district align with buyer demand.
It’s not about avoiding boutique projects in Balestier altogether; it’s about recognising which ones have the larger layouts and stronger positioning relative to Balestier’s core. Those are the elements that have consistently driven appreciation here.
Curious which specific developments and stacks tick these boxes today? Drop us a message, we’re happy to chat further.
Stay with us on Stacked Pro, as we continue to analyse how smaller boutique projects fare in various districts.


