Prithvi Kalkunte and Mariam Yousuf
The cyclicality of industries and their behavior provide early indications of economic turning points in Texas and the U.S., and where the Texas and U.S. economies are in the business cycle.
The state has a larger share of jobs in low-cyclical sectors—broadly, industries in which employment growth fluctuates less than total employment—relative to the U.S. Meanwhile, moderately cyclical industries in Texas have been a notable source of strength, and normally bellwether high cyclical sectors have not signaled distress.
Overall, the cyclicality breakdown provides information about an economy’s turning points in a timelier manner than other data, which tend to be dated but are widely used to confirm downturns and expansions.
Both national and state employment data are collected and aggregated by industry group, then subsector and then sector. Sectors differ in many ways depending on the characteristics of the underlying firms. Some sectors are composed largely of private firms, such as manufacturing, while others are mainly composed of nonprofits or firms that rely on government funds, such as health or public education. The characteristics of sectors determine not only wages and productivity, but also the pace and variation in employment growth over the business cycle.
Delving beyond headline data
Headline employment numbers often obscure important details regarding the health and direction of the economy. Sectoral employment can provide early directional signs.
In the U.S., education and health services contributed around 40 percent of the jobs created from March 2022 (at the start of the Federal Reserve’s most-recent period of increasing interest rates) to August 2024. On the flip side, manufacturing contributed only 2 percent over the same period. So, what do the weak growth in manufacturing and strong growth in education and health services imply about the economic cycle?
Several economic indicators before the pandemic could reliably project whether the economy was about to enter a recession. These leading indicators included manufacturing new orders and average hours worked.
The pandemic and the years that followed broke the pattern. After a huge spike in goods consumption and supply chain disruptions during the pandemic shutdowns, many of these leading indicators mistakenly signaled an economic downturn. In retrospect, what appeared to be weakness may simply have reflected postpandemic normalization of goods consumption and supply chains.
Traditional measures offer a lagged view
The formal announcement that the economy has entered a contractionary period typically occurs with a significant delay. The National Bureau of Economic Research’s Business Cycle Dating Committee determines the turning points of a U.S. business cycle retrospectively. While the announcement of the March 2020 pandemic recession occurred within a few months, the committee waited a full year to officially announce the start of the 2007–09 recession.
Many people rely on an informal rule of two quarters of contracting gross domestic product (GDP) to signify a recession. Even when using this rule of thumb, one would have to wait at least seven months—two quarters plus a lag of a month—for the data release to determine a recession.
At the state level, there is no official dating committee, and the timing of data releases is even more delayed. State level GDP is released with almost a quarter lag; for example, third quarter GDP is released in December.
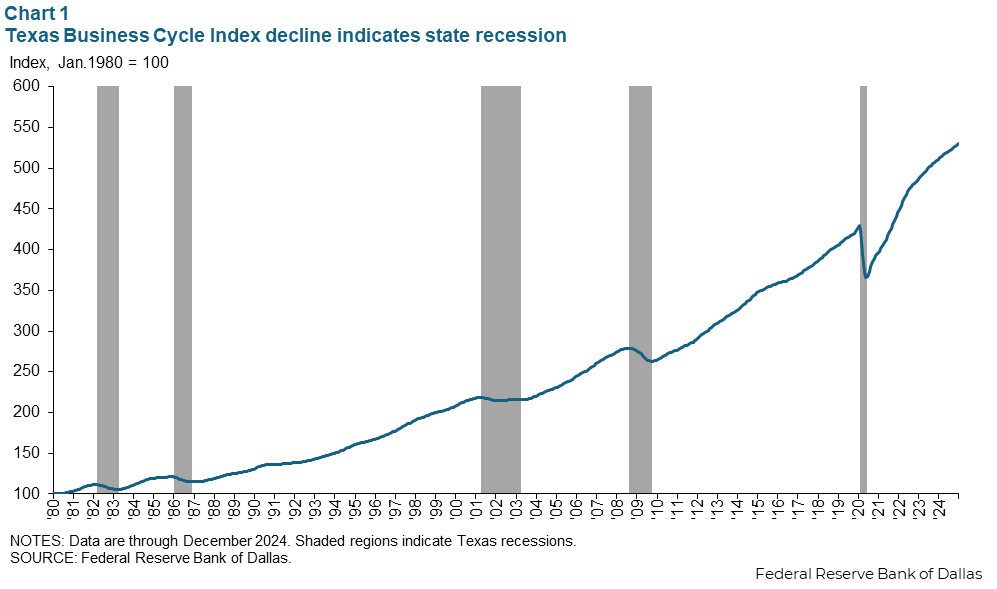
For a timelier understanding of the state economy, the Federal Reserve Bank uses the Texas Business-Cycle Index, a monthly coincident measure that represents both consumption and employment within the state (Chart 1). Generally, when the Texas index consistently declines month over month, it signals a potential recession. While informative, the Texas Business-Cycle Index is imperfect. It incorrectly identified state-level recessions in 1974 and 1991.
While looking retrospectively at the data is helpful, policymakers are focused on the present.
Identifying highly cyclical employment sectors and viewing the behavior of component industries is another method to determine turning points or when a recession begins. Employment data is timelier than GDP, since it is monthly and generally released with a lag of three weeks for state level data.
Besides manufacturing, common boom-and-bust sectors include construction and information, which captures tech services companies and many IT startups. In addition to reflecting where the state currently stands, bellwether highly cyclical sectors can also indicate where the economy is heading in the business cycle.
Texas versus US: same sector cyclicality, different composition of growth
Texas employment cyclicality largely mirrors that of the U.S. (Chart 2). Construction, mining (excluding oil and gas) and information see bigger swings, while government, health care and finance jobs experience less cyclical movement. The vast majority of Texas mining employment is in oil and gas production and oilfield services; mining, excluding oil and gas, refers to coal, metal ore and other mineral mining.
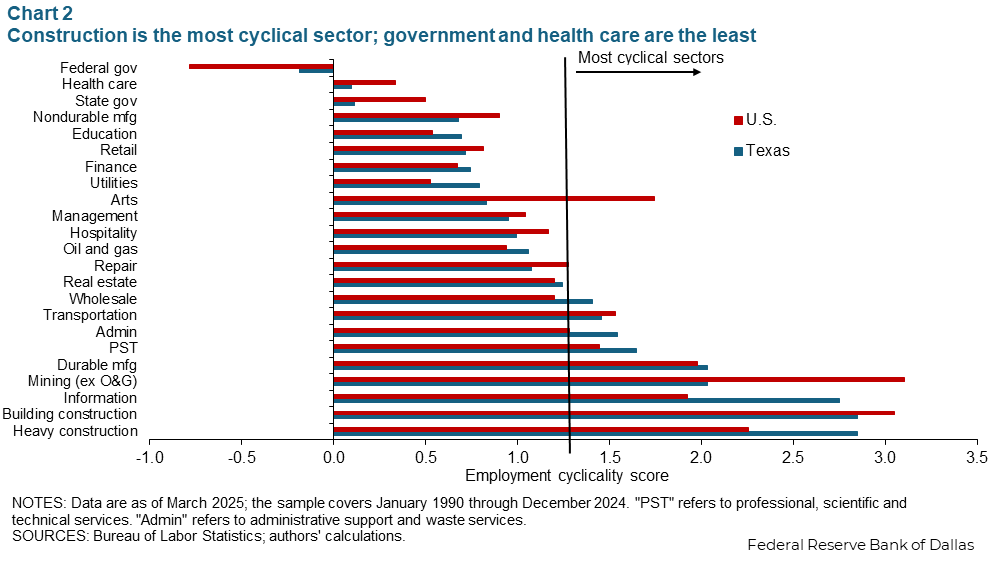
The methodology for determining the sector cyclicality scores was developed by Federal Reserve Bank of Dallas economists Alexander Chudik and Ron Mau. The cyclicality value is obtained as the long-run multiplier from a regression of the sectoral employment growth on total employment growth and lags of both. Monthly Current Employment Statistics data from 1990 to 2024 are used in these regressions, with this vintage benchmarked through the third quarter 2024 (for Texas).
The resulting scores can be broadly categorized into three groups: highly cyclical, the score exceeding 1.2; moderately cyclical, scoring from 0.8 to 1.2; low cyclicality, below 0.8. The scores are relative to the business cycle, with moderately cyclical industries on par with total employment fluctuations. By comparison, low cyclicality sectors are either less sensitive when the score is positive or counter cyclical when the score is negative, meaning they move in the opposite direction to the business cycle.
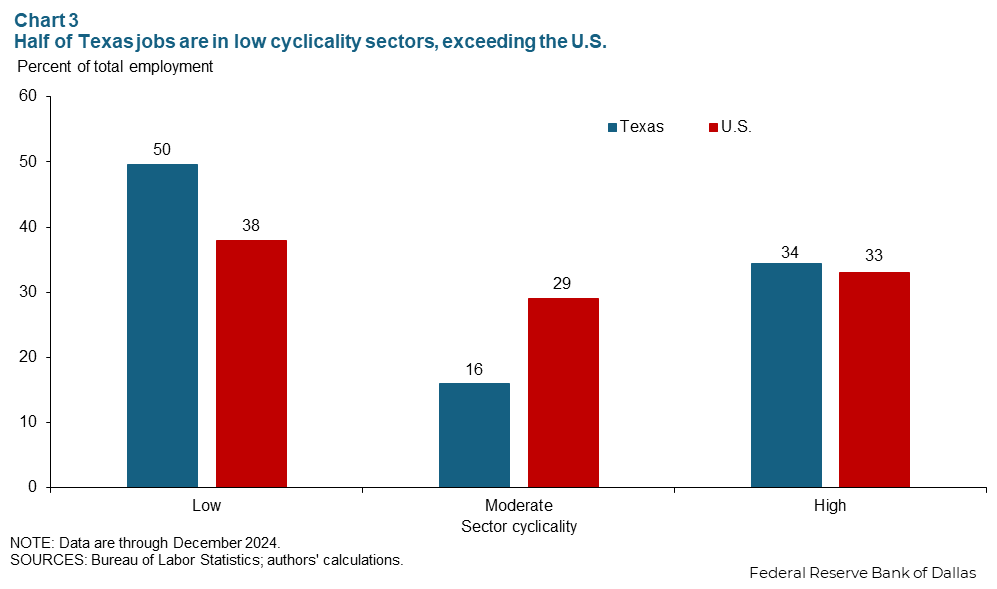
The U.S. has a comparatively even distribution of employment by cyclicality type with roughly one-third of its employment in each group, though the low cyclical sector has a slightly larger share.
By comparison, about half of Texas jobs are in the least-cyclical group, with another third in the most-cyclical classification. Only about 16 percent of jobs are in moderately cyclical sectors (Chart 3).
Low-cyclicality sectors can still be a source of overall growth, as has been the case for U.S. employment, especially after the Fed began policy rate increases in 2022. In Texas, low cyclicality sectors comprised 46 percent employment growth through 2024, driven largely by the health care sector.
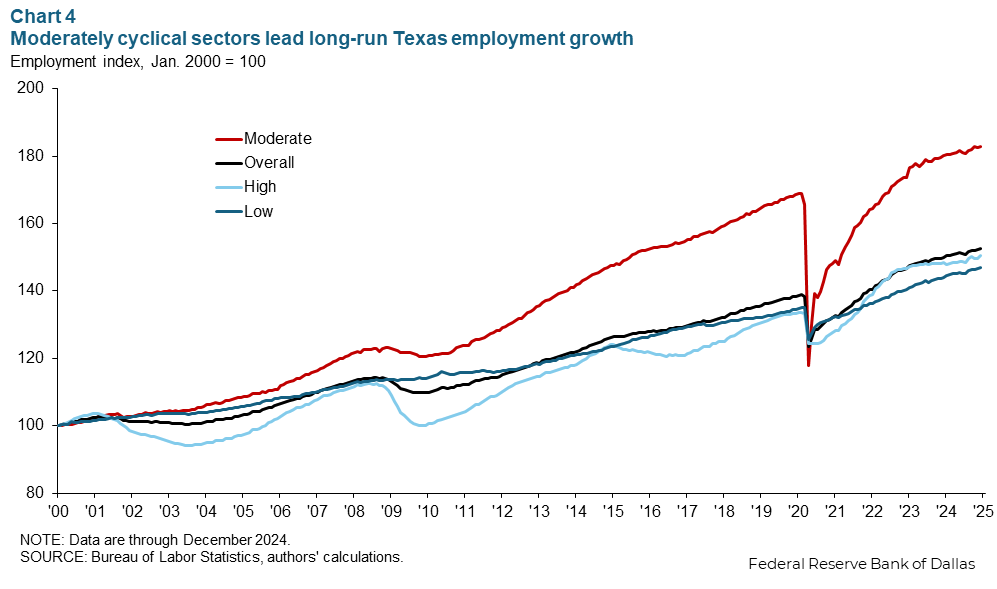
Moderately cyclical sectors in Texas have experienced the strongest growth, a trend that started around the Great Recession. Texas has undergone significant structural changes to its economy that produced faster growth in the moderately cyclical sectors compared with all others.
Texas’ great moderation
Since 2010, moderately cyclical sectors—which, for Texas, include the real estate, accommodation and food services (principally restaurants), and oil and gas—have grown at a faster pace than the remaining sectors and overall total nonfarm employment (Chart 4).
Growth in real estate and accommodation and food services is partly attributable to the population boom Texas has experienced since 2010; the state’s growth rate has consistently been almost double that of the U.S.
Energy employment reflects the shale boom, which advanced during exploration of the Barnett Shale formation around Fort Worth in 2004. Then-new methods of hydraulic fracturing (or fracking) of the underlying rock to extract natural gas (and subsequently oil elsewhere) proved successful. Energy hiring gained momentum, accelerating from 2010–14 when oil prices averaged $90 per barrel . Since 2015, oil and gas employment has trended lower, largely reflecting productivity gains and, more recently, lower prices.
In 1990, moderately cyclical jobs made up about 8 percent of overall employment; by 2024, this grew to 16 percent. The Texas economy became less cyclical over the period as moderately cyclical sectors grew at the expense of highly cyclical ones.
Texas’ highly cyclical jobs picked up in late 2024
Job growth in highly cyclical sectors mark turning points in the Texas Business Cycle Index, which in turn tracks expansions and contractions in the state economy (Chart 5).
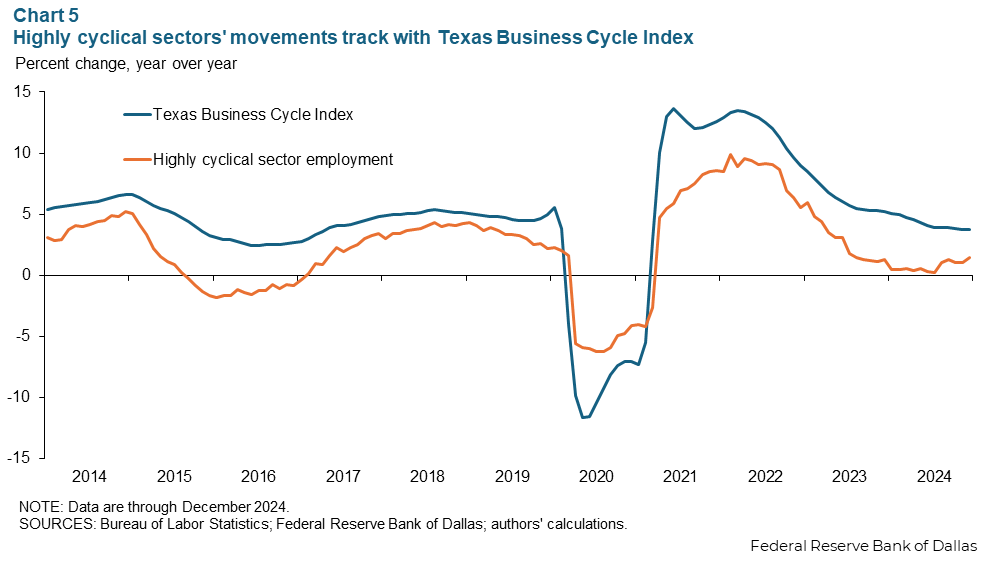
While highly cyclical employment growth slowed significantly at the end of 2023 and remained low throughout 2024, year-over-year growth picked up in the last few months of 2024, signaling that the state economy was likely accelerating and certainly not entering a recession. Over the past decade, a recession has never occurred while year-over-year highly cyclical employment growth remained positive.
However, a contraction wrongly signaled a recession in 2015. This was due to the oil price decline that preceded the 2015–16 oil bust and subsequently diminished employment in highly cyclical industries. Overall job growth in the state was suppressed, slipping below national growth in 2015.
The current and prior two months of highly cyclical sector employment are statistically significant in predicting future behavior of the Texas Business-Cycle Index. This result is derived from regressing the business cycle index (in logs) on highly cyclical sector employment (in logs) with lags and analyzing the lag structure.
This implies that if highly cyclical employment is growing, over the next three months, it is likely the economy will continue expanding. In December, month-over-month growth of highly cyclical employment picked up, suggesting the Texas Business-Cycle Index continued advancing in the first quarter of 2025.
While this relationship is statistically significant and intuitive, it can’t account for revisions to employment data. The Bureau of Labor Statistics updates the prior two months of data every time new monthly data are released and publishes benchmark revisions every March. Thus, while serving as a handy tool, highly cyclical employment should be taken in context with a variety of other economic indicators to accurately portray where the economy is in the business cycle.
About the author

Prithvi Kalkunte
is an economic programmer in the Research Department at the Federal Reserve Bank of Dallas.

Mariam Yousuf
is a business economist in the Research Department of the Federal Reserve Bank of Dallas.
The views expressed are those of the authors and should not be attributed to the Federal Reserve Bank of Dallas or the Federal Reserve System.