In this blog post, we explore the most recent update of MSCI’s data universe of private-capital closed-end funds. We report the performance results for the major asset classes in the second quarter and detail the net cash flows to investors based on fund vintages. We also examine the increase in holding periods for venture capital, buyout, private real estate and infrastructure.
Performance across global asset classes
Venture-capital funds declined 0.4% and have posted negative returns for eight of the last 10 quarters since their 2021 peak. Buyout and expansion-capital funds posted positive quarterly returns of 1.2% and 1.5%, respectively.
Real-asset funds continued to show mixed performance. While natural-resource funds posted a positive return of 2.4% and infrastructure funds returned 2.1%, real-estate funds registered their ninth consecutive quarterly decline amid continued challenges relating to interest rates and office use.
Private credit shines again
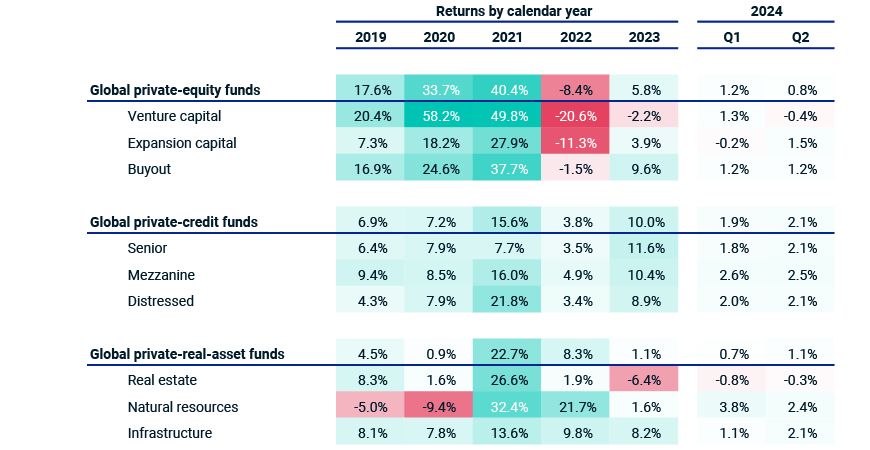
Calendar-year returns represent pooled one-year internal rates of return. Quarterly returns are calculated using the Modified Dietz method and are not annualized. All returns calculated in USD. Data as of Q2 2024.
Evolving net-cash-flow trends
Next, we explore how net cash flows — distributions to investors less contributions — continue to take shape for some key asset classes, as the lack of distributions remains a key topic in the industry. Investors experience private capital through individual vintages. The 2014 funds should be nearing the end of their harvest stage while the 2019 funds will be just beginning this process.[1] Asset owners generally rely upon distributions from mature vintages to fund new commitments.
The exhibit below shows the net-cash-flow curves for some of the key asset classes, with all vintages from 2005 through 2024 included for historical context. The 2014-19 vintages — which are in the distribution parts of their lives — are shown in shades of blue.
Private real assets’ distribution vintages lag historical trend
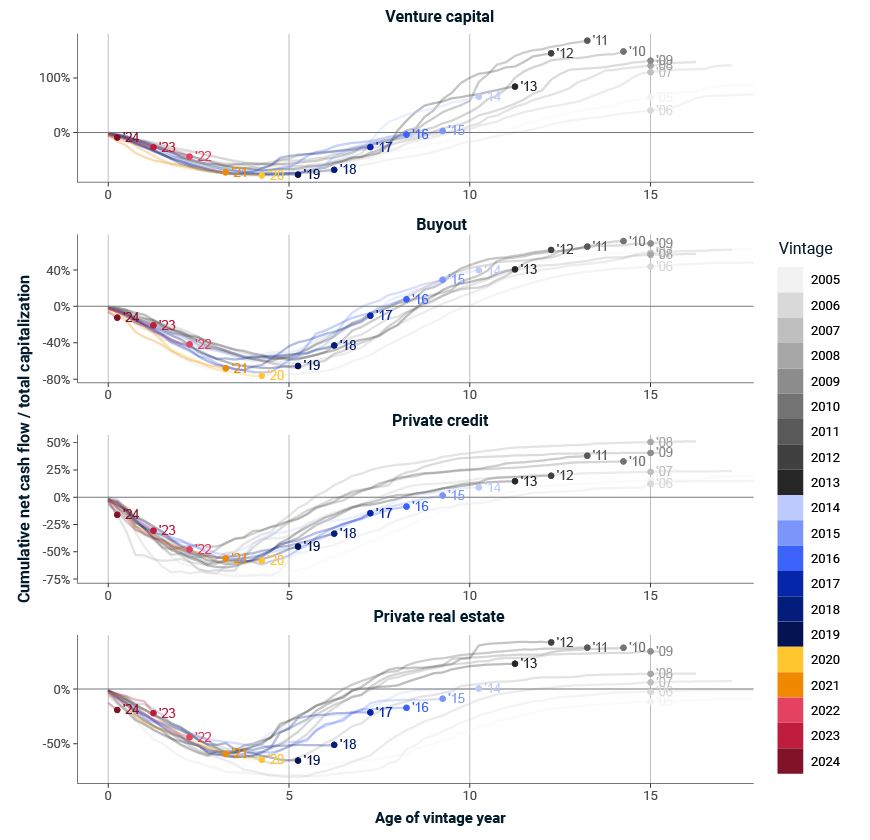
Pooled net cash flow calculated as distributions less contributions and expressed relative to the total capitalization of each vintage year. All figures are calculated in USD. Data as of Q2 2024.
Venture-capital and buyout vintages have seen a slowing of distributions that have brought those vintages back into alignment with historical ranges. For private real estate, however, vintages have almost completely stalled on the distribution front — distribution-year vintages (shown in blue) drift sideways and break out of historical ranges.
Digging deeper than distributions
Going deeper than the general slowdown in distributions at the fund level, we can look at the underlying investment holdings to better understand whether current market dynamics are outside of historical norms — or in just a slight slowdown relative to quarters before COVID-19.
In the exhibit below, we look at the underlying holdings and the age of those holdings (defined as the time since the fund’s initial investment) over time for venture capital, buyout, private real estate and infrastructure. Holding periods have clearly risen from their 2021 lows across all asset classes, although venture capital stands out, as the 5.4 years is the highest registered for this asset class. Further, the weighted average is meaningfully above the median figure, suggesting that the higher-valuation investments are being held for longer.
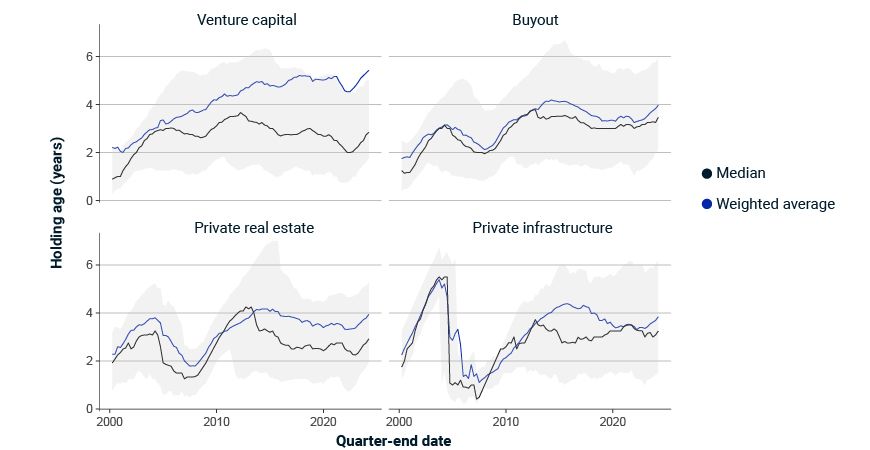
Age of underlying investment holdings as of each quarter-end date. Shaded area represents upper and lower quartiles. Analysis excludes holdings with a valuation of zero. All figures are calculated in USD. Data as of Q1 2024.
While the above exhibit gives context to the overall trends, holding periods are best understood within the context of a vintage year. Switching to that vintage view, we now can better interpret how each individual vintage cohort is evolving.
Faster distributions have declined for buyout
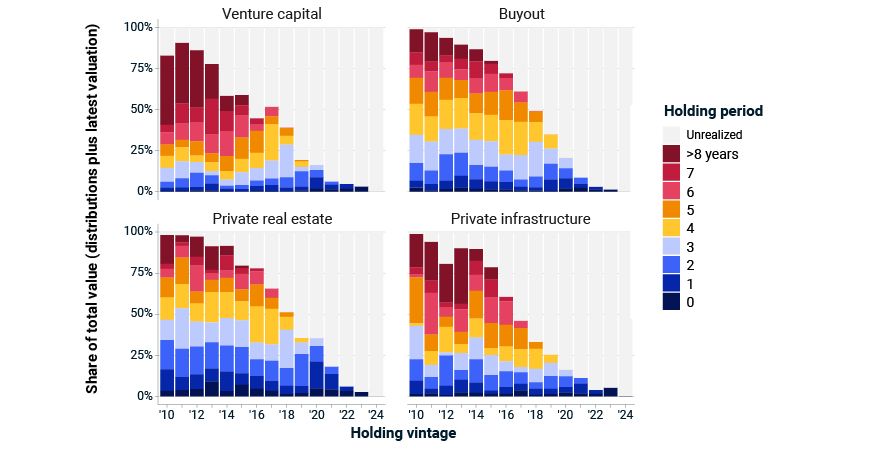
Total value of each holding vintage, with distributions grouped by the age of the investment at the time of distribution. The analysis recognizes interim distributions as having their own holding period — e.g., a buyout investment that distributes USD 100 million of capital at year four and fully exits for another USD 100 million in year six would have USD 100 million allocated to both years. All figures are calculated in USD. Data as of Q1 2024.
Looking back to 2010, we can observe some rise in holding periods. For example, buyout holdings have seen a clear decline in faster distributions, shown in blue, and an increase in later distributions, especially across years four to five, shown in yellow and orange. (The gray portion of each year — largest in the newest vintage years — represents the portion of value that hasn’t been realized yet.) What does this mean for asset managers? Increasing pressure to take write-downs and exit at any pricing that can be achieved.
The exhibit below switches from a vintage view to a calendar view, allowing us to explore how the unrealized value in the previous chart (shown for the latest period only across all vintages) has evolved over time.
The youth of unrealized holdings
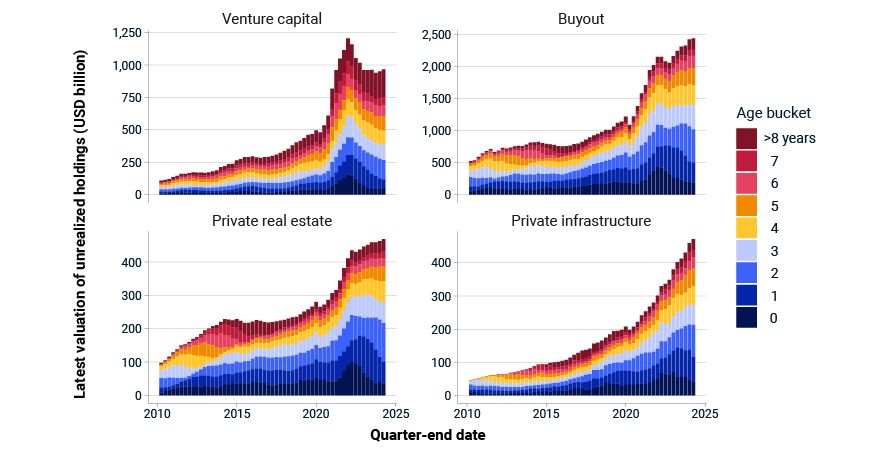
Valuation of underlying investment holdings as of each quarter-end date grouped by the age of the underlying investment. All figures are calculated in USD. Data as of Q1 2024.
With this final view, a few things stand out. First, this is another reminder of the significant growth of the private-capital industry over the last 14 years, with most asset classes quadrupling in size. Second, we can see that a significant portion of the current valuation is in holdings that are less than four years old (shades of blue), from which we would expect few exits. Finally, however, we can note that the value in older holdings (shades of red) has grown on both an absolute and a relative basis: There is more than USD 200 billion in venture-capital holdings that are into the eighth investment year.