In this Stacked Pro breakdown:
Do Mega-Developments Deliver Better Returns Than Mid-Sized Projects?
Comparison
We analysed Affinity at Serangoon (1,052 units) and The Garden Residences (613 units) – two leasehold projects launched in 2018, located just minutes apart, with nearly identical surroundings, to isolate how scale impacts price performance.
Key Insight
Affinity at Serangoon outperformed Garden Residences in annualised gains (2.49% vs. 1.69%) and delivered stronger returns across one- to three-bedroom units, despite starting from a lower price base.
Why This Matters
This case challenges the assumption that mega-developments suffer from resale pressure or underperform due to their scale. Affinity’s listing activity and resale turnover mirrored that of Garden, suggesting that size alone isn’t a limiting factor, and may even offer an edge.
Get the full unit-by-unit breakdown — only in Stacked Pro.
🔓 Check out our case studies on the following mega developments: High Park Residences, Affinity at Serangoon, and Parc Clematis.
When Affinity at Serangoon launched in 2018, it was everything a mega-development was supposed to be – sprawling land size, over 1,000 units, and resort-like amenities.
Just across the road, The Garden Residences offered a stark contrast: smaller, more private, with fewer units and a tighter layout. Both were launched at almost the same time, in the same neighbourhood, to the same pool of buyers.
Fast-forward to 2025, and Affinity at Serangoon has become a compelling case study in how large-scale projects perform, especially when placed side by side with its neighbour and rival, The Garden Residences.
The two projects’ identical lease terms and nearly identical surroundings (about six minutes’ walk from each other) allow us to isolate the impact of scale. For anyone weighing between a mega-development and a mid-sized condo today,
| Project | Affinity at Serangoon | The Garden Residences |
| Tenure | 99 years | 99 years |
| Launch year | 2018 | 2018 |
| Completion year | 2023 | 2021 |
| Number of units | 1,012 condos and 40 landed units | 613 units |
Average prices of both projects by year
| Bedrooms | Year | Affinity at Serangoon | The Garden Residences |
| 1 | 2018 | $778,228 | $782,629 |
| 2019 | $792,645 | $738,939 | |
| 2020 | $799,870 | $792,330 | |
| 2021 | $820,921 | $887,080 | |
| 2022 | $835,652 | $845,500 | |
| 2023 | $893,283 | $818,236 | |
| 2024 | $900,984 | $819,060 | |
| 2025 | $950,934 | $866,472 | |
| 2 | 2018 | $1,038,605 | $1,062,845 |
| 2019 | $1,119,128 | $991,862 | |
| 2020 | $1,130,822 | $1,074,975 | |
| 2021 | $1,097,748 | $1,036,400 | |
| 2022 | $1,213,000 | $1,186,667 | |
| 2023 | $1,271,001 | $1,147,619 | |
| 2024 | $1,250,676 | $1,187,204 | |
| 2025 | $1,249,167 | $1,211,434 | |
| 3 | 2018 | $1,476,910 | $1,418,935 |
| 2019 | $1,468,374 | $1,375,352 | |
| 2020 | $1,498,297 | $1,409,768 | |
| 2021 | $1,594,446 | $1,620,245 | |
| 2022 | $1,681,747 | $1,520,600 | |
| 2023 | $1,765,056 | $1,735,000 | |
| 2024 | $1,806,062 | $1,599,576 | |
| 2025 | $1,907,625 | $1,513,000 | |
| 4 | 2018 | $2,261,375 | $2,107,600 |
| 2019 | $2,285,415 | $1,603,800 | |
| 2020 | $2,283,150 | $1,859,930 | |
| 2021 | $2,326,592 | $2,055,822 | |
| 2022 | $2,292,653 | No Data | |
| 2023 | $2,740,000 | $2,300,000 | |
| 2024 | $2,900,000 | $2,333,333 | |
| 2025 | No Data | 2,220,000 |
Although The Garden Residences was a smaller development, its launch prices were comparable to, and sometimes even higher than, those at Affinity at Serangoon.
However, over time, Affinity at Serangoon’s prices caught up. The data suggests that, overall, Affinity at Serangoon has delivered stronger price performance:
| Year | Affinity at Serangoon | The Garden Residences |
| 2018 | $1,527 | $1,634 |
| 2019 | $1,507 | $1,547 |
| 2020 | $1,560 | $1,585 |
| 2021 | $1,564 | $1,600 |
| 2022 | $1,623 | $1,788 |
| 2023 | $1,774 | $1,790 |
| 2024 | $1,769 | $1,807 |
| Annualised | 2.49% | 1.69% |

This is what the sales uptake looks like:

The Garden Residences had a slow start; just over 25 per cent of its units were sold a year after launch. In contrast, Affinity at Serangoon had already moved more than half of its inventory within the same timeframe.
From the outset, The Garden Residences trailed behind. While both developments sold at a similar pace in 2019, things began to shift noticeably around August 2020.
COVID-19 appears to have played a role in boosting The Garden Residences’ sales and, subsequently, buyer profits.
By 2020, The Garden Residences was selling nearly every unit type, from one- to three-bedders, at prices lower than those at Affinity at Serangoon. This price gap created a more attractive entry point, which helped drive sales and set the stage for stronger appreciation in the years that followed.

This pricing gap was especially pronounced for the 4-bedroom units. In 2018, only one 4-bedder at The Garden Residences was sold, for $2.107 million, already lower than Affinity at Serangoon’s $2.26 million.
But by 2020, the difference had widened significantly. The average 4-bedroom unit at The Garden Residences was going for just $1.859 million, compared to $2.283 million at Affinity, a substantial $423,000 difference.
Looking at the sales volume, price trends, and timeline, it’s clear that 2020 was a good year for buyers at The Garden Residences. Initial pricing may have been too ambitious, leading to slower sales early on. But when COVID-19 hit, the resulting uncertainty drove prices down, making The Garden Residences far more appealing relative to Affinity at Serangoon.
This created a rare window where buyers could enter at a significant discount, setting them up for stronger upside in the years that followed.
So between the two projects, who came out on top – the early Affinity buyers, or the opportunistic Garden Residences buyers of 2020?
Let’s go into more detail by looking at the actual profit and losses of specific layouts, as well as new sales to subsale or resale transactions.
(Note: We’re going to leave out the five-bedders from Garden Residences, as Affinity only has up to four-bedders to compare with. There are also no recorded sub sale-to-resale transactions.)
An important caveat about the timing of purchase
There is an important detail worth adding to the above, and that’s an issue regarding the timing of purchase.
If we compare appreciation in price psf from 2018 to 2024, Affinity at Serangoon has the better performance.
At launch, The Garden Residences had a higher average price of $1,634 psf. This isn’t unusual – regular condos are usually pricier than mega-developments, which have better economies of scale. Additionally, The Garden Residences had a higher proportion of smaller units, which also tend to have a higher price psf.
In both developments, most of the one-bedders were sold first, followed by the two- and three-bedders in later years.
Thanks to its higher starting price, The Garden Residences maintained a higher price psf in the early years. But Affinity at Serangoon gradually caught up, and by 2024, prices for the two projects had almost converged: $1,769 psf for Affinity and $1,807 psf for Garden.
Putting aside price psf, however, we can see that Affinity at Serangoon still beats Garden Residences in terms of annualised returns. Affinity at Serangoon came out ahead with a 2.49 per cent growth rate, compared to just 1.69 per cent for The Garden Residences.
| Year | Units Sold | |
| Affinity at Serangoon | The Garden Residences | |
| 2018 | 279 | 57 |
| 2019 | 341 | 159 |
| 2020 | 208 | 334 |
| 2021 | 162 | 49 |
| 2022 | 59 | 13 |
| 2023 | 125 | 32 |
| 2024 | 120 | 75 |
| 2025 | 39 | 33 |
Another interesting point to note is the sales pattern of The Garden Residences. Between 2019 and 2020 alone, the project sold about 80 per cent of its units. This suggests that most buyers entered early, likely benefitting from lower launch prices or “early bird” discounts commonly offered by developers.
This skews our price performance comparison slightly. If we measure returns from 2018 (when both projects launched), Affinity at Serangoon appears to perform better. However, this overlooks the fact that a large portion of Garden Residences’ buyers only entered in 2020, when prices had already risen somewhat.
To level the playing field, we adjusted the comparison to begin from 2020, the point by which 54 per cent of Garden Residences’ total sales were completed.
From this starting point, the performance gap narrows significantly:
| Year | Affinity at Serangoon | The Garden Residences |
| 2020 | $1,560 | $1,585 |
| 2021 | $1,559 | $1,600 |
| 2022 | $1,615 | $1,788 |
| 2023 | $1,774 | $1,790 |
| 2024 | $1,769 | $1,806 |
| Total ROI (%) | 13.4% | 13.9% |
| Annualised Returns | 3.2% | 3.3% |
Total ROI (2020–2024):
- Affinity at Serangoon: 13.4%
- The Garden Residences: 13.9%
Annualised Returns:
- Affinity at Serangoon: 3.2%
- The Garden Residences: 3.3%
By using 2020 as the baseline, we see that The Garden Residences doesn’t vastly outperform Affinity at Serangoon. Instead, their price appreciation is almost neck-and-neck.
If you’re interested in this phenomenon, we suggest also checking out our study on how early or late purchases can have a significant impact on gains.
Coming back to ROI, let’s look at gains based on the unit sizes in Affinity and Garden Residences
Our earlier data looks only at overall performance, but it’s important to see how units of each layout performed differently as well:
Affinity at Serangoon (Gains by unit sizes)
| Bedrooms | Average gains | Average annualised gains | Average holding period (days) | Average holding period (years) |
| 1 | $106,931 | 2.88% | 1,667 | 4.57 |
| 2 | $177,733 | 3.37% | 1,698 | 4.65 |
| 3 | $300,081 | 4.55% | 1,539 | 4.22 |
| 4 | $393,193 | 4.27% | 1,418 | 3.89 |
The Garden Residences (Gains by unit sizes)
| Bedrooms | Average gains | Average annualised gains | Average holding period (days) | Average holding period (years) |
| 1 | $83,791 | 2.49% | 1,628 | 4.46 |
| 2 | $152,516 | 2.96% | 1,637 | 4.49 |
| 3 | $229,761 | 3.72% | 1,503 | 4.12 |
| 4 | $403,325 | 5.25% | 1,356 | 3.72 |
Here’s a look at the difference in the Return on Investment (ROI):

At a more detailed level, it’s clear Affinity at Serangoon has performed better. Affinity outperforms in both absolute and annualised gain for one to three-bedroom units.
However, The Garden Residences won by a large margin for the 4-bedder. This is due to the low price buyers entered in 2020 as mentioned, where Affinity at Serangoon sold for over $400k more.
Now let’s take a look at the unit layouts, starting with the one-bedders:
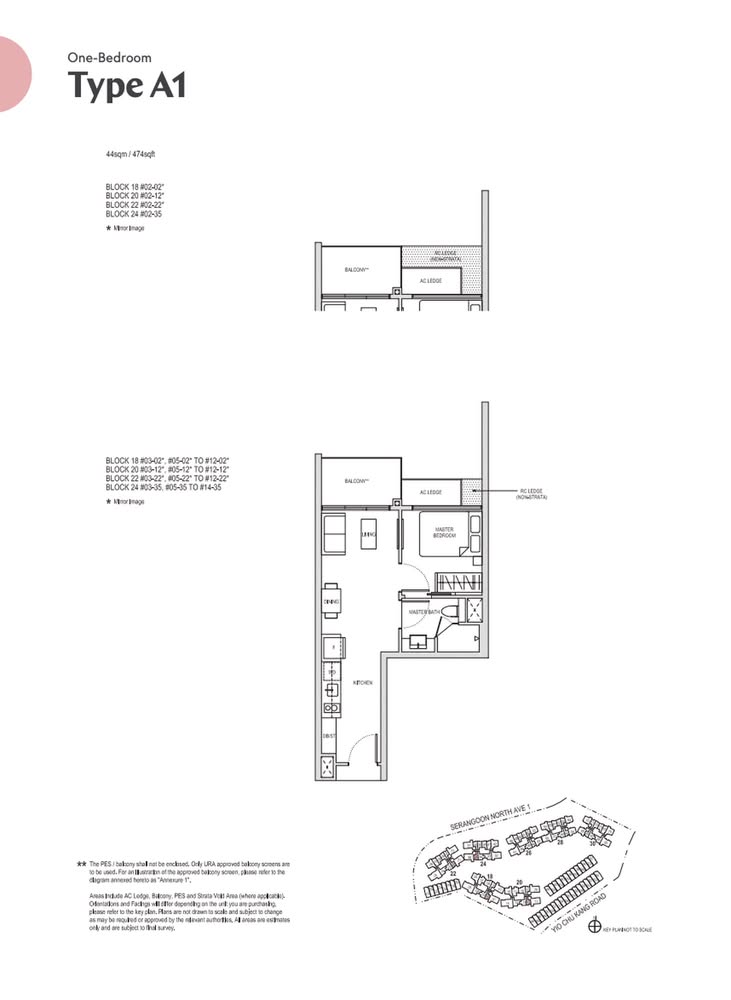
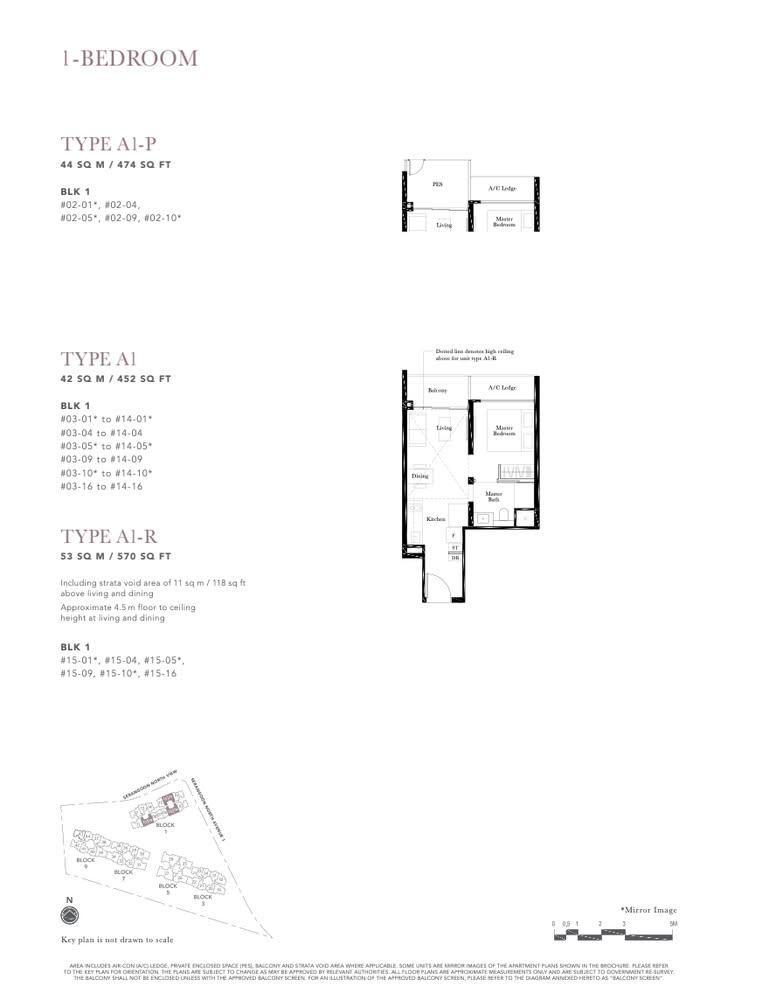
In terms of quantum, Affinity’s one-bedders started off slightly cheaper but subsequently became more expensive, explaining its better performance over The Garden Residences.
| Year | Affinity at Serangoon (474 Sq Ft) | The Garden Residences (452 Sq Ft) |
| 2018 | $723,640 | $736,536 |
| 2025 | $836,678 | $815,222 |
For efficiency, we’d say Affinity at Serangoon has an edge because of its kitchen layout. A longer kitchen zone allows the washer/dryer and fridge to be aligned with the cabinetry, whereas Garden’s one-bedder has a more compact kitchen (appliances are along the opposite wall). This makes Garden’s one-bedders a little more squeezy, and a bit less comfortable for a cooking/food prep workflow.
Two-bedder units:
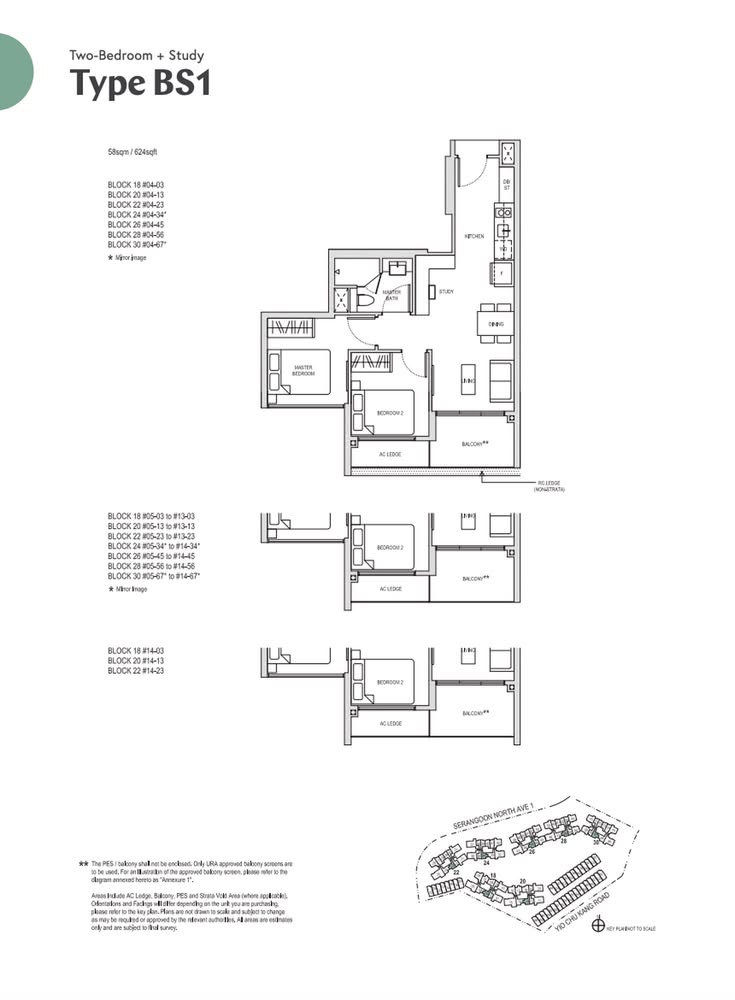
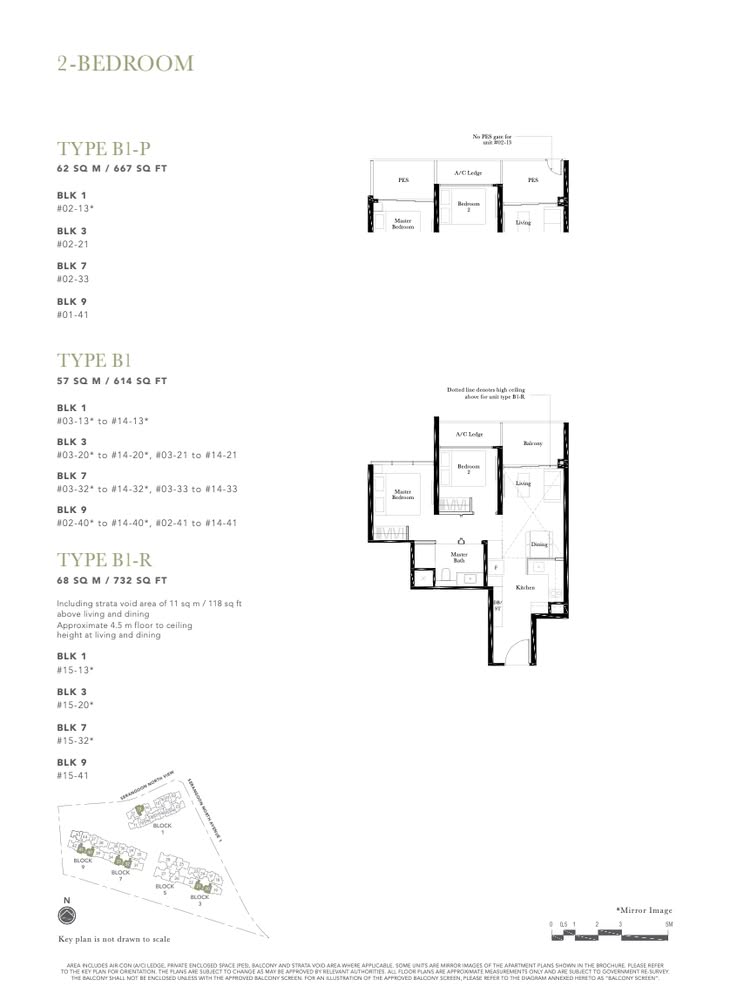
Affinity’s two-bedroom was priced lower than The Garden Residences when it launched. If we compared the smallest sizes, which are just 1 sqm apart, you’ll see what a difference it is:
| Year | Affinity at Serangoon (624 Sq Ft) | The Garden Residences (614 Sq Ft) |
| 2018 | $957,072 | $1,034,700 |
| 2025 | $1,161,000 | $1,116,722 |
However, Affinity at Serangoon came out on top. In the resale market, it made sense that the slightly larger Affinity at Serangoon costs more. On a $PSF basis though, Affinity at Serangoon is more expensive:
| Year | Affinity at Serangoon (624 Sq Ft) | The Garden Residences (614 Sq Ft) |
| 2018 | $1,533 | $1,686 |
| 2025 | $1,860 | $1,820 |
Affinity at Serangoon typically offers a 2 + Study layout, with a longer kitchen and a study nook that can double as a dining area. This time though, we’d say Garden wins out in the kitchen layout. While slightly smaller, its two-bedder kitchens feature a wider L-shaped layout that’s good for workflow and optimises space.
Another win for Garden here is the bathroom access: Affinity’s bathroom isn’t directly connected to the master bedroom, whereas Garden provides a more convenient Jack-and-Jill setup. This makes the bathroom accessible from both the bedroom and the common areas.
So in our opinion, The Garden Residences has a very similar size but a better layout. Yet, Affinity at Serangoon costs more on average. A deeper look at comparable transactions reveals that it could be down to unit-specific attributes:
| Project | Date | Address | Size (Sq Ft) | $PSF | Price |
| Affinity at Serangoon | 20 Feb 2025 | 24 Serangoon North Avenue 1 #14-34 | 624 | $1,890 | $1,180,000 |
| The Garden Residences | 5 Mar 2025 | 1 Serangoon North View #14-13 | 614 | $1,842 | $1,130,000 |
| Project | Date | Address | Size (Sq Ft) | $PSF | Price |
| Affinity at Serangoon | 12 Mar 2025 | 18 Serangoon North Avenue 1 #04-03 | 624 | $1,772 | $1,106,000 |
| The Garden Residences | 4 Mar 2025 | 9 Serangoon North View #04-40 | 614 | $1,793 | $1,100,000 |
For example, two units on the same floor cost $50,000 more in Affinity at Serangoon, while for the fourth floor, it’s just $6,000 more.
Three-bedder units
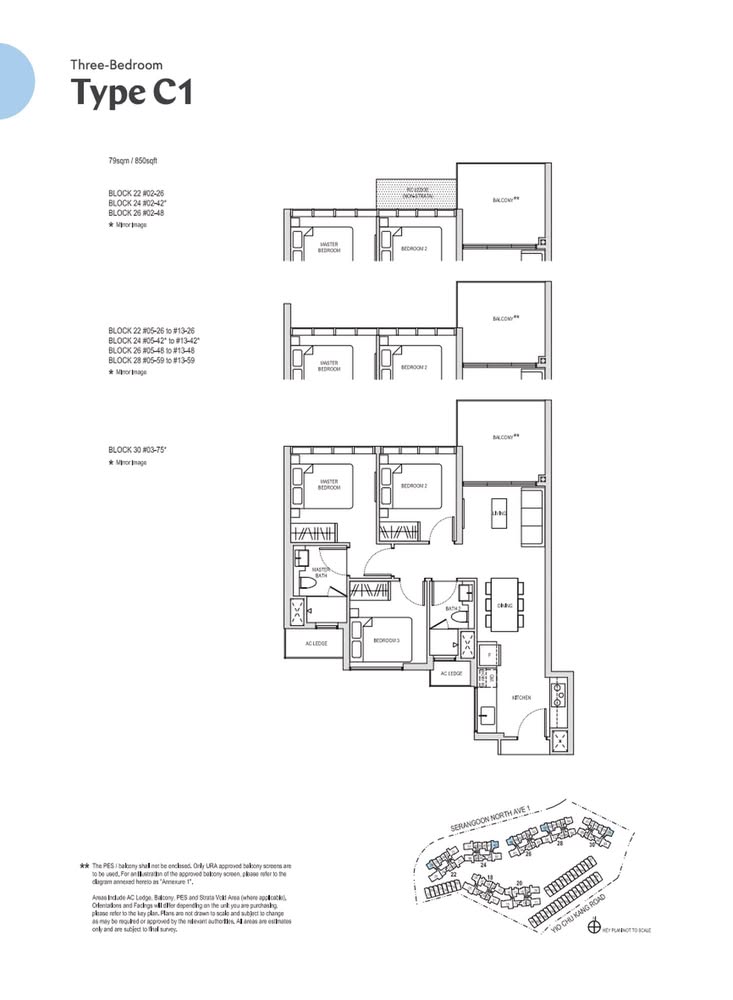
Affinity at Serangoon pulls ahead significantly in this layout category, and Affinity stands out with its larger unit size and stronger capital appreciation. But if we break it down, how does it really compare?
| Affinity at Serangoon (Sq Ft) | 2018 | 2025 | Change |
| 850 | $1,251,043 | $1,585,200 | 26.7% |
| 904 | $1,445,417 | $1,690,000 | 16.9% |
| 1,152 | $1,778,614 | $2,090,600 | 17.5% |
| The Garden Residences | 2018 | 2025 | Change |
| 753 | $1,105,150 | $1,270,000 | 14.9% |
| 786 | $1,257,575 | $1,463,333 | 16.4% |
| 797 | $1,326,600 | $1,426,250 | 7.5% |
| 872 | $1,323,900 | $1,468,000 | 10.9% |
| 904 | $1,508,578 | $1,770,000 | 17.3% |
| 1,119 | $1,903,550 | $2,040,000 | 7.2% |
In the above tables, we segregated the developer’s average prices in 2018 versus prices so far this year.
You can see that the 850 sq. ft. unit at Affinity at Serangoon was sold for almost the same price as the 786 sq. ft. unit in The Garden Residences. Fast forward seven years, and the average price goes for $1.585 million, which is more than the larger 872 sq. ft. unit at The Garden Residences.
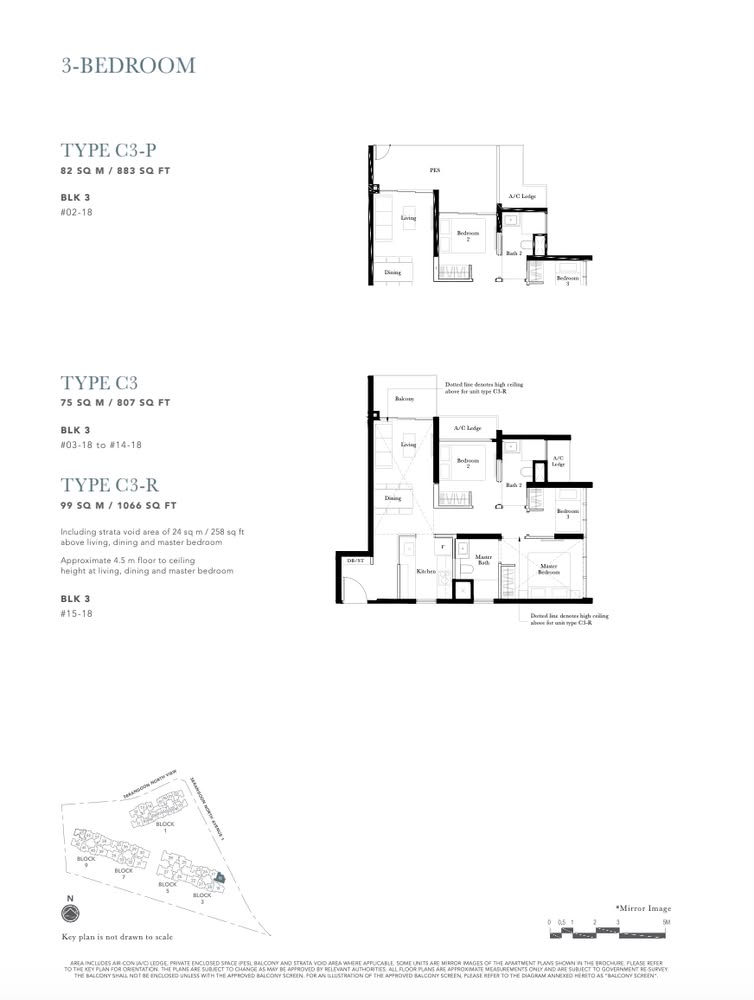
So why does it trade for more despite being slightly smaller? If you look closely at the transactions, you’ll see that the 872 sq. ft. unit at The Garden Residences only applies to specific floors – level two for blocks 3, 7 and 9, and the first level on block 9. This is due to the Private Enclosed Space (PES); it lacks a balcony, but the layout is more functional.
This is what the 872 sq. ft. unit at The Garden Residences looks like:
Do note that for the 872 sq. ft. unit, there is no balcony. Instead, it is a PES area.
It has good privacy at the entranceway since it doesn’t open directly into the living room, and also a ventilated but enclosed kitchen. One of the common bedrooms is quite small, fitting only a single bed.
Now here’s the smaller 850 sq. ft. unit at Affinity at Serangoon:
The layout doesn’t provide much privacy as it opens up to the dining and living area. Moreover, the kitchen layout is less desirable given it’s not enclosed. However, it makes up for it with a more practical common bedroom, which can fit a queen-sized bed.
Which of the two layouts is better? This one isn’t clear-cut as a lot comes down to personal preference, but look at a comparable transaction just one floor apart: Affinity at Serangoon costs $32,000 more for its 850 sq. ft. unit, compared to the 872 sq. ft. unit at The Garden Residences.
The fact that the Affinity unit is a smidgen smaller, yet manages to cost more, might indicate market preference.
| Project | Contractdate | Address | Unit area(sqft) | Price(S$ psf) | Price(S$) |
| Affinity at Serangoon | 21 Jan 2025 | 30 Serangoon North Avenue 1 #03-75 | 850 | $1,752 | $1,490,000 |
| The Garden Residences | 24 Jan 2025 | 7 Serangoon North View #02-35 | 872 | $1,684 | $1,468,000 |
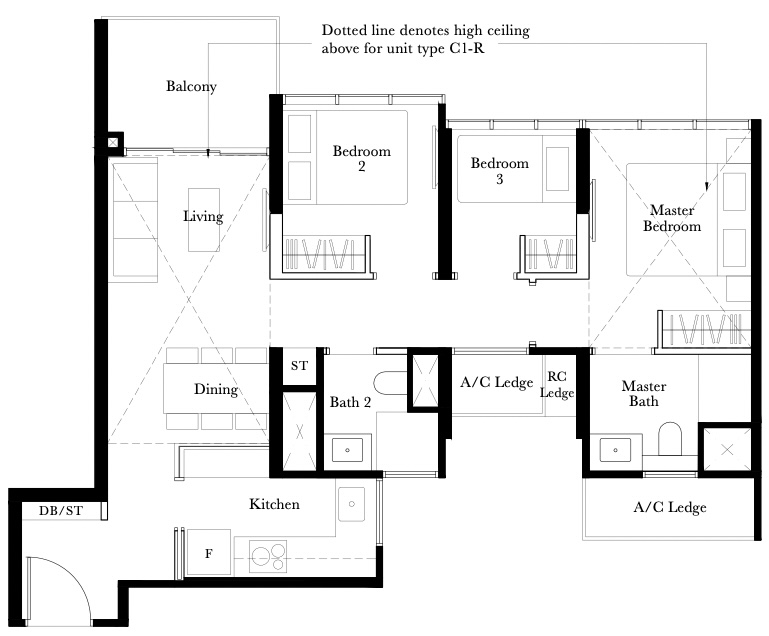
Here, both projects also have units roughly 904 sq. ft. in size.
Here’s the layout at Affinity at Serangoon:
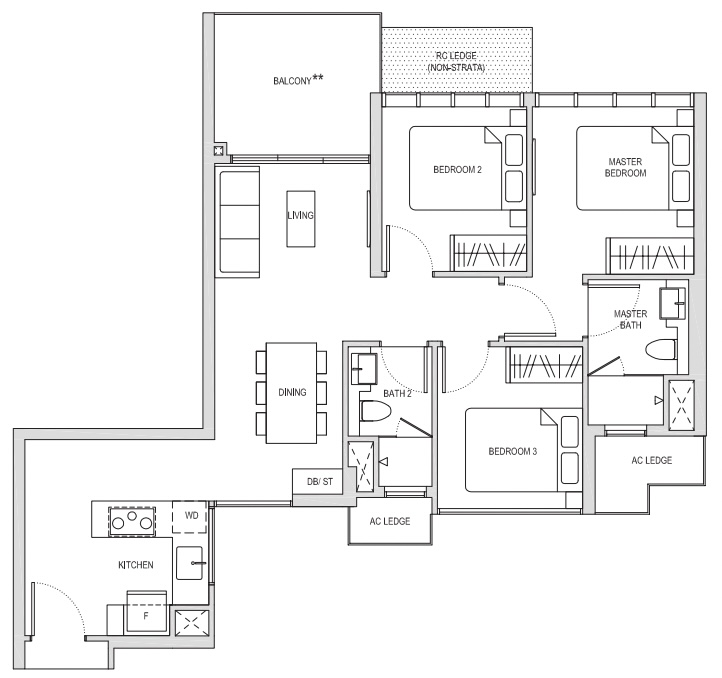
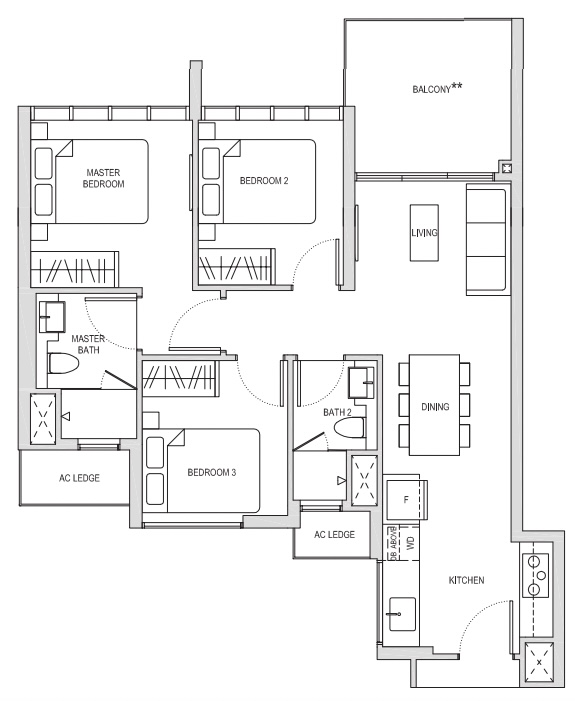
Here’s the one at The Garden Residences:
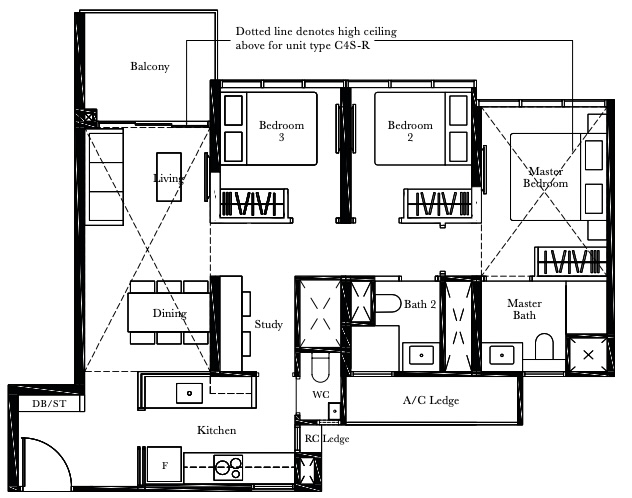
In this case, we’d say the Garden Residences unit has a superior layout. First, it’s a 3+ study, not just a three-bedder. Second, the kitchen is ventilated and enclosed, plus it comes with a WC.
| Year | Affinity at Serangoon (904 Sq Ft) | The Garden Residences (904 Sq Ft) |
| 2018 | $1,445,417 | $1,508,578 |
| 2025 | $1,690,000 | $1,770,000 |
| Change | 16.9% | 17.3% |
In terms of gains though, both these layouts are relatively close in terms of appreciation.
Four-bedders units
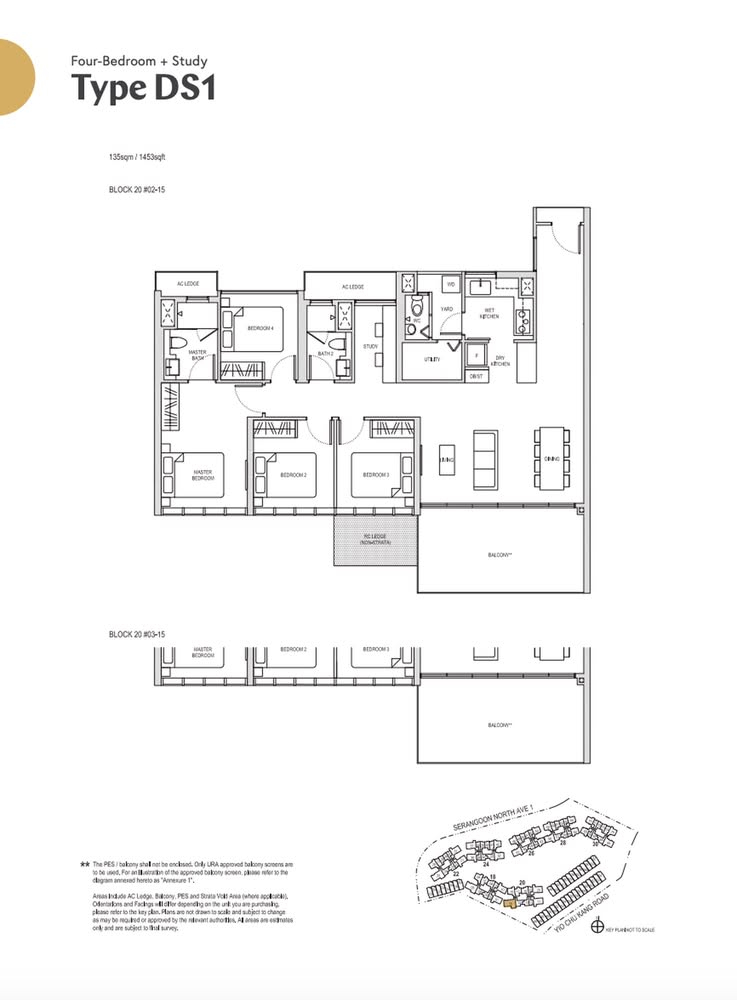
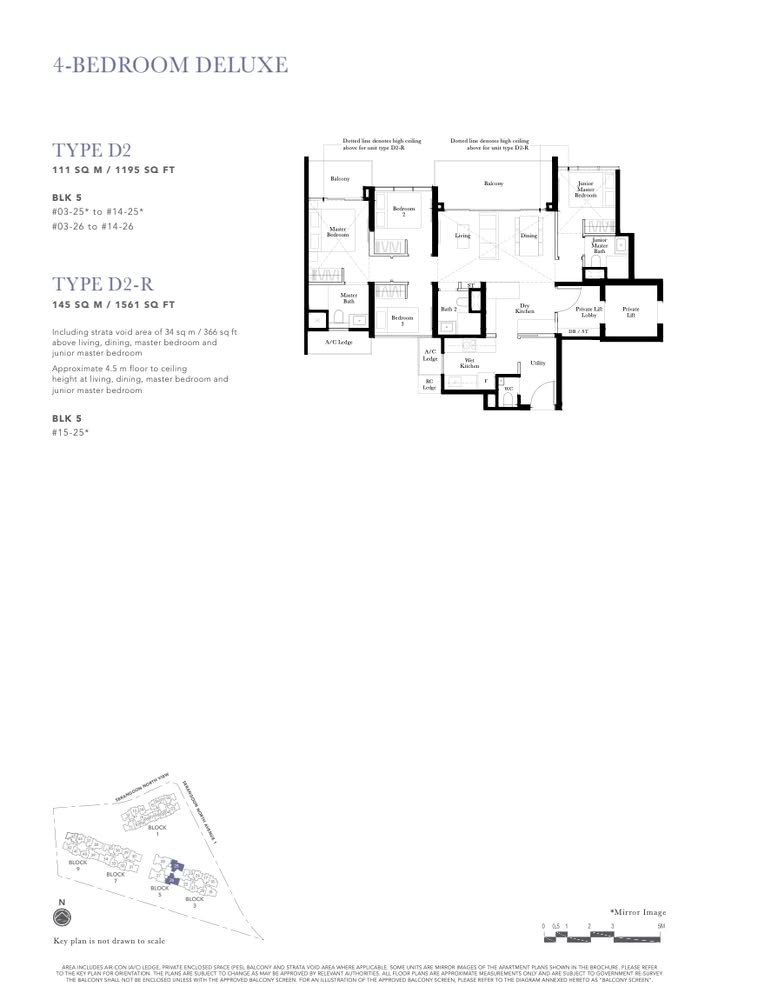
Affinity at Serangoon wins in size, but The Garden Residences comes out ahead in investment performance for this layout. Garden saw an ROI of 21.1 per cent versus Affinity’s 17.1 per cent.
The higher ROI and growth rate at The Garden Residences could be attributed to its lower entry price in 2020, as mentioned before.
Garden’s four-bedders also have, in our opinion, a more space-efficient layout that appeals to a broader buyer pool.
Affinity at Serangoon’s four-bedroom units typically include an additional study room, which adds versatility. However, the layout is a 4-bed, 2-bath configuration with only one ensuite. Garden, by contrast, offers a 4-bed, 3-bath layout, including two ensuite bedrooms. When it comes to larger units (which are typically for multi-generational family living), the extra bathrooms make a big difference.
In terms of outdoor space, Affinity at Serangoon provides a single large balcony, while Garden splits this into two balconies; and one is attached to the master bedroom. For homeowners who appreciate the outdoor space, the second private balcony could be a strong addition (although again, homeowners who dislike balconies would frown at both).
In bedroom usability, Affinity at Serangoon again has a slight edge, in that all four rooms can fit double beds; but in The Garden Residences, the smallest bedroom is for a single bed; but this isn’t enough to stop Garden from being the stronger performer.
As a point of note, The Garden Residences’ four-bedder also has a private lift. This is a feature more common in a higher price bracket, and it can be attractive to some buyers.
Let’s also take a look at the rental yield for the unit layouts:
Affinity at Serangoon rental yields:
| Unit type | Average price | Average rent | Rental yield |
| 1-bedroom | $900,984 | $2,953 | 3.93% |
| 2-bedroom | $1,250,676 | $3,460 | 3.32% |
| 3-bedroom | $1,806,062 | $4,539 | 3.02% |
| 4-bedroom | $2,900,000 | – | – |
The Garden Residences rental yields:
| Unit type | Average price | Average rent | Rental yield |
| 1-bedroom | $819,060 | $2,893 | 4.24% |
| 2-bedroom | $1,185,995 | $3,574 | 3.62% |
| 3-bedroom | $1,608,348 | $4,283 | 3.20% |
| 4-bedroom | $2,333,333 | $5,467 | 2.81% |
*There are no rental leases recorded for four-bedders at Affinity at Serangoon
These numbers are in line with expectations, and nothing really stands out. As we’d expect, the smaller units have the higher gross rental yield, on the basis of their lower quantum. It’s also unsurprising that The Garden Residences has slightly higher yields, as its prices tend to be a bit lower.
We can conclude that Affinity at Serangoon’s stronger performance is unlikely to have anything to do with its rental yields.
Other possible factors contributing to Affinity at Serangoon’s better performance
Let’s address the most glaring difference first: Affinity at Serangoon is a mega-development, and has the characteristic land area to show for it (27,584 sqm). Garden Residences, as a regular condo, is much smaller at 14,605 sqm.
Now let’s consider the site plans:
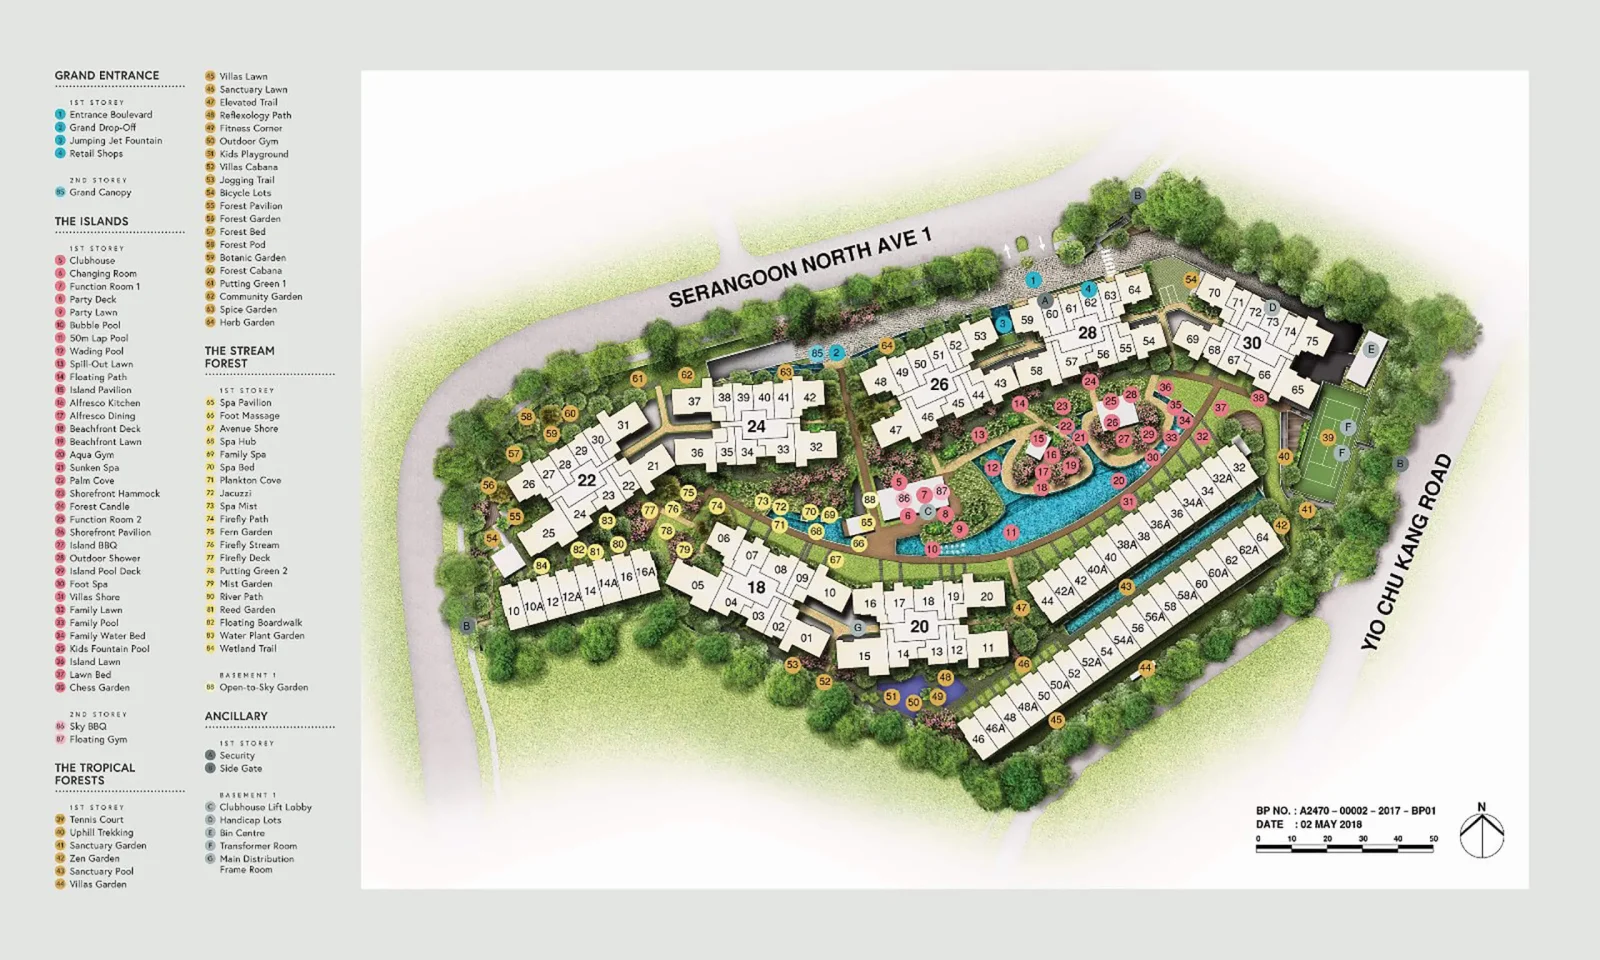
Affinity at Serangoon offers over 80 facilities* spread across themed zones (e.g., Island Pool Zone or Forest Boardwalk), including multiple pools, outdoor dining spaces, a floating gym, and on-site retail shops. This variety caters to a wider range of lifestyles: families with and without children, fitness buffs, and even older folks.
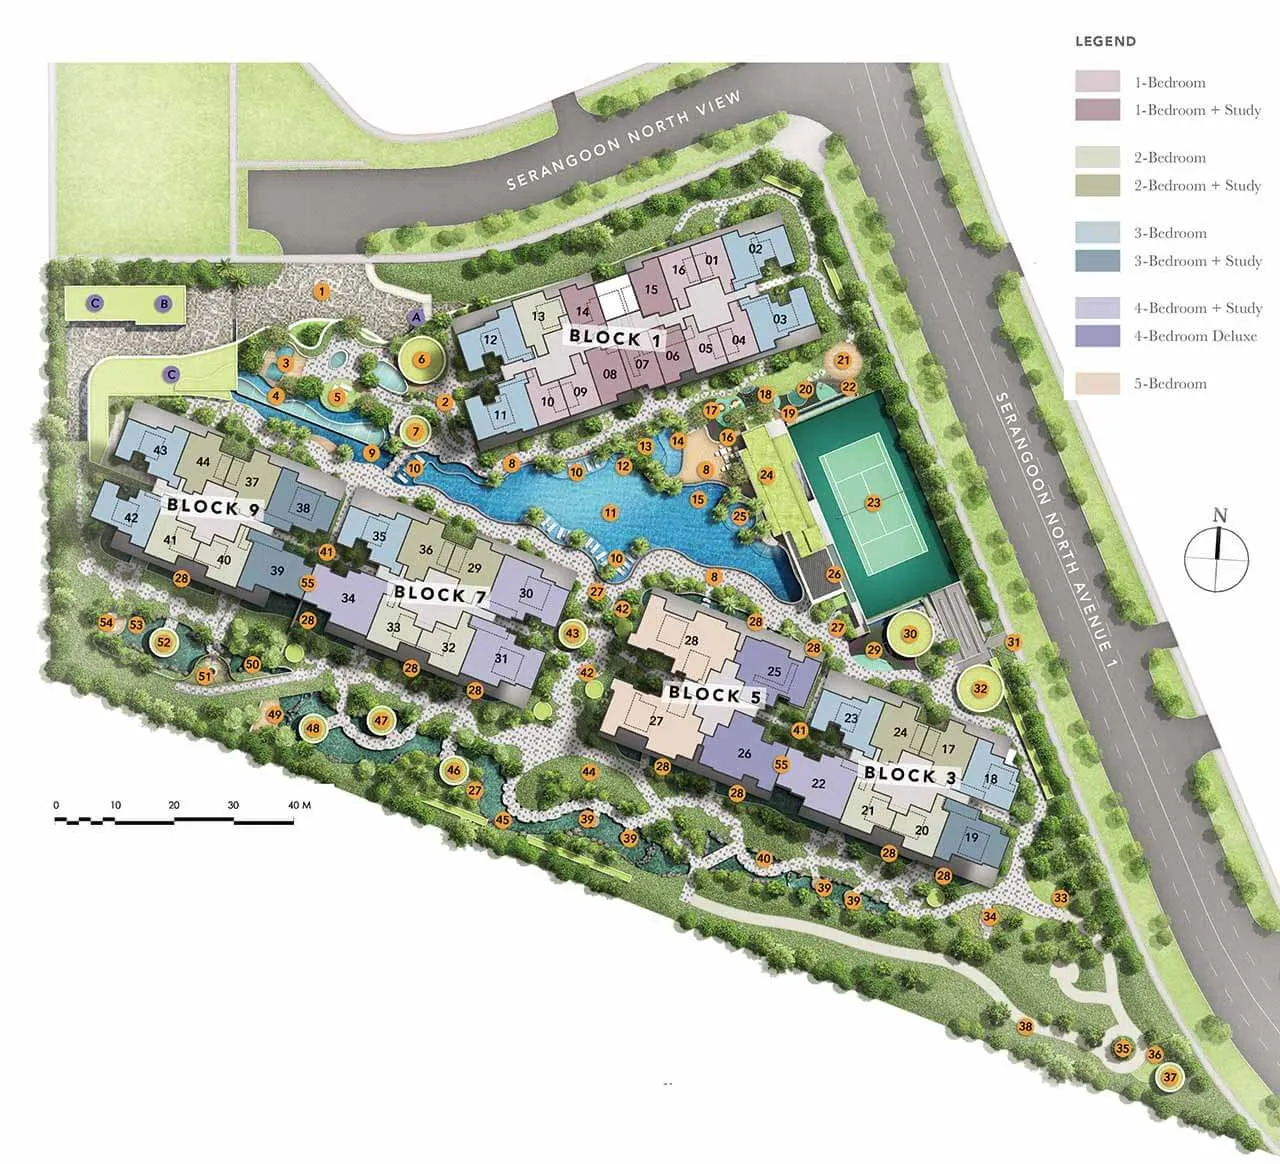
In contrast, The Garden Residences is more compact. While it has quality facilities (i.e., a 75 metre pool, BBQ pavilions, a clubhouse, and even a “Petscape,”) the facilities are more centrally clustered and less varied. It’s excellent compared to another regular condo, but still not a match for Affinity at Serangoon’s resort-like scale.
*We did not count the facilities one by one, but 80 was the developer’s claim.
Now, let’s look at the maintenance fees for the two projects:
| Maintenance fees (approximate): | ||
| Unit type | Affinity at Serangoon | The Garden Residences |
| 1-bedroom | $180 | $250 – $360 |
| 2-bedroom | $214 | $300 – $360 |
| 3-bedroom | $250 | $300 – $360 |
| 4-bedroom | $250 | $350 – $420 |
Another mega-dev advantage kicks in here, with Affinity at Serangoon having much lower maintenance fees despite its more generous facilities.
In theory, a mega-dev should be priced lower due to economies of scale, which should help to boost its performance
Does that hold true for Affinity at Serangoon versus the more regular-sized Garden Residences? Let’s have a look:
Average transacted prices during the launch in 2018
| Unit type | Affinity at Serangoon (in 2018) | The Garden Residences (in 2018) |
| 1-bedroom | $777,437 | $782,629 |
| 2-bedroom | $1,038,605 | $1,062,845 |
| 3-bedroom | $1,476,910 | $1,418,935 |
| 4-bedroom | $2,261,375 | $2,107,600 |
Average transacted prices in 2024
| Unit type | Affinity at Serangoon | The Garden Residences |
| 1-bedroom | $900,984 | $819,060 |
| 2-bedroom | $1,250,676 | $1,185,995 |
| 3-bedroom | $1,806,062 | $1,608,348 |
| 4-bedroom | $2,900,000 | $2,333,333 |
Average unit sizes (sq ft) for units sold in 2024
| Unit type | Affinity at Serangoon | The Garden Residences |
| 1-bedroom | 533 | 469 |
| 2-bedroom | 700 | 662 |
| 3-bedroom | 989 | 873 |
| 4-bedroom | 1711 | 1195 |
Average $PSF in 2024
| Unit type | Affinity at Serangoon | The Garden Residences |
| 1-bedroom | $1,692 | $1,747 |
| 2-bedroom | $1,788 | $1,791 |
| 3-bedroom | $1,831 | $1,839 |
| 4-bedroom | $1,694 | $1,953 |
Based on the 2024 transaction data, it’s not entirely accurate to say that Affinity at Serangoon’s scale makes all the units cheaper; at least not in terms of overall quantum. Affinity units actually have higher overall price tags across every unit type (e.g., $1.8 million for a three-bedder at Affinity vs. $1.6 million at Garden).
However, Affinity at Serangoon units are also significantly larger (e.g., 989 sq. ft. vs. 873 sq. ft. for three-bedders), hence the higher quantum. In terms of simple price psf, Affinity would be cheaper (e.g., three-bedders: $1,831 psf vs. $1,839 psf).
In this sense (price psf), one could argue Affinity at Serangoon is cheaper than Garden Residences, even though the price difference is not huge.
What about the drawbacks of excessive competition?
It almost invariably comes up that mega-devs have too many units, and hence, too much competition at the time of resale. If so, it should be a drawback that hinders Affinity’s performance, so let’s take a closer look:
| Number of units on sale at the moment (on PropertyGuru) | ||
| *Given that some units may have multiple listings, let’s use 85% of the total number of listings | ||
| Affinity at Serangoon | The Garden Residences | |
| Total number of listings on PropertyGuru | 154 | 86 |
| 85% of the total | 131 | 73 |
| % of the project that is on the market | 12.44% | 11.92% |
| No. of resale transactions in recent years | ||
| Affinity at Serangoon | The Garden Residences | |
| 2023 | 125 | 32 |
| 2024 | 120 | 72 |
| % of the project sold in 2024 | 11.41% | 11.75% |
Here we see another reason why Affinity at Serangoon may be faring so well. The fear of excessive competition, due to its unit count, hasn’t seemed to pan out.
At the time of writing, about 12.44 per cent of Affinity’s units are listed for sale versus 11.92 per cent for The Garden Residences, a negligible difference of just 0.52 percentage points. Resale activity in 2024 also tells a similar story: 11.41 per cent of Affinity units changed hands, compared to 11.75 per cent at Garden.
So, despite its much larger size, Affinity doesn’t appear to suffer from significantly higher listing pressure, or a glut of supply. If anything, the comparable turnover rates suggest that demand is more than healthy enough to absorb the larger inventory.
Mind you, we cannot claim that this will be the case for all mega-developments. But we can see that the expected drawback didn’t manifest for Affinity at Serangoon, which likely contributed to its performance.
Most property advice in Singapore falls into two categories: overly simplistic or heavily sales-driven.
What we’ve shared today is neither; it’s a data-backed, side-by-side analysis of two comparable projects, grounded in real transaction trends and on-the-ground context.
We can’t cover every nuance in a single piece, but this is the kind of insight we build Stacked Pro around – breaking down what drives capital appreciation across different property types, layouts, and launch timings.
If you’re serious about buying or investing in the next 6 to 12 months, let’s have a conversation about how scale, unit mix, and launch timing could impact your specific investment outcome.
In our next analysis, we’ll be breaking down Parc Clematis, to see if a mega-development can outperform in a highly competitive area like Clementi. We’ll also reveal performance differences by unit layout and key advantages or drawbacks, so this will help you if you’re also considering buying or selling at the project.
If you’re currently shortlisting condos or trying to time your exit, let’s talk about how this framework can be applied to your specific situation here.