A rare ‘death cross’ appeared on the US stock market this week, sparking fears that further downturn is on the horizon.
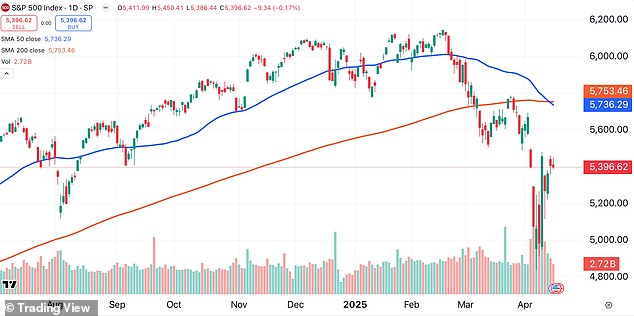
A death cross is when the 50-day moving average of an stock index drops below the 200-day average — indicating momentum is weakening.
A moving average is the average range of prices of an asset over a given period of time.
The pattern effectively tells investors that prices have deteriorated in a short period of time. The sign has appeared before several major crashes including in 2008 and 1929.
Since the lows of the financial crisis in March 2009, the S&P 500 has endured seven notable death cross events – and this week marked the eighth.
On Monday, the S&P 500 saw a death cross, spooking investors after weeks of market volatility as a result of Donald Trump’s sweeping tariff proposals.
A similar crossover then occurred several days later on the tech-heavy Nasdaq Composite Index.
On Thursday, the Dow Jones Industrial Average was set to become the latest major index to experience a death cross, marking the first time the ominous signal has appeared on the index since 2023.

On Monday, the S&P 500 saw a death cross, spooking investors after weeks of market volatility as a result of Donald Trump’s sweeping tariff proposals
‘As the name implies, a death cross is viewed as a bearish technical development and is often used as an indicator pointing to more downside ahead,’ said Bret Kenwell, US Investment Analyst at eToro.
Many investors are already concerned about the possible effect of Trump’s tariff plans on the economy.
Billionaire Larry Fink said earlier this month that he thinks the economy has already weakened, and may already be in decline.
‘I think we’re very close, if not in, a recession now,’ the BlackRock CEO told CNBC.
Although Trump has put larger levies on hold for now, a 10 percent baseline tariff on goods from 60 countries is still in place, which is concerning both investors and regular Americans.
But Kenwell warns investors not to panic about the death cross indicator popping up in the stock market.
Looking back on historical data implies that it may not be as ominous as it sounds, he said.
‘Looking back over the seven other instances since 2009, we found that one month later, the S&P 500 was lower four times with a median decline of 0.9 percent. However, three months later, the index was higher six times with a median return of 5.9 percent.
‘When looking at six and 12 months later, the data points to a similarly improving situation where the S&P 500 was higher five and six times, respectively, with median gains of 10.1 percent and 15.5 percent, respectively.’

‘As the name implies, a death cross is viewed as a bearish technical development and is often used as an indicator pointing to more downside ahead,’ said Bret Kenwell, US Investment Analyst at eToro

The Nasdaq Composite saw a rare death cross this week

The death cross has sparked fears the US economy is heading toward a downturn
In almost half of the instances (three out of seven), the S&P 500 had already made its low for that particular pullback by the time the death cross had occurred, Kenwell added.
Additionally, the largest decline that occurred after the death cross was less than 7 percent in five of the seven instances.
But he does note that in two instances in 2018 and 2022 the index suffered a further drawdown of 11.1 percent and 14.5 percent, respectively.
And in 2022 the death cross occurred on March 14, but the S&P 500 did not bottom until almost seven months later on October 13.
‘The most recent death cross statistics of the last 15 years are not necessarily bullish, but they hardly represent the frightening premonition that the name seems to imply,’ Kenwell said.
‘It’s clear that this lagging indicator did not, even somewhat consistently, show that stocks are bound to fall off a cliff.’
That does not mean that markets cannot deteriorate from current levels, especially due to ongoing macroeconomic issues, he said.
But ‘a technical death cross for the S&P 500 is not the end-all, be-all knockout that it may seem to be.’