
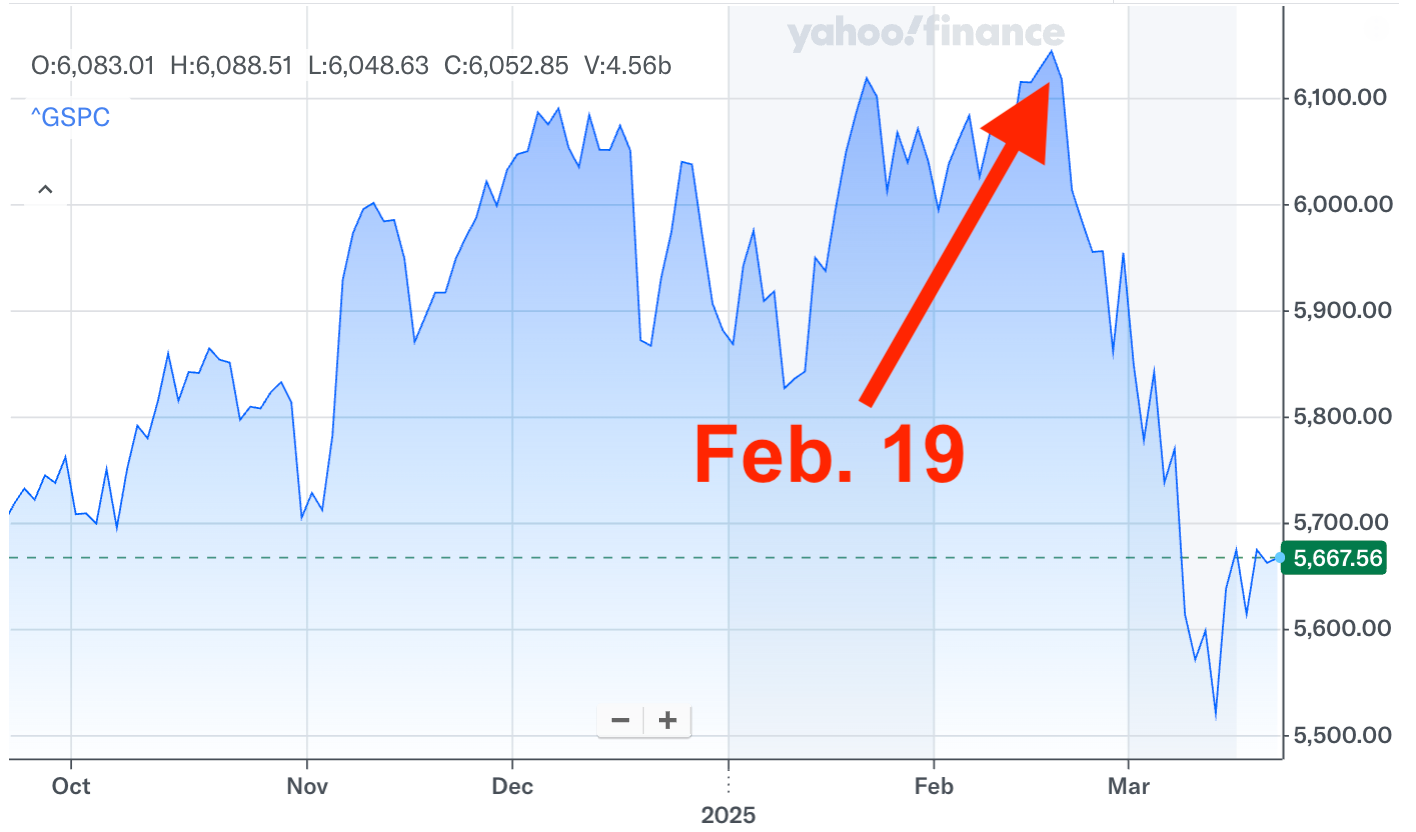
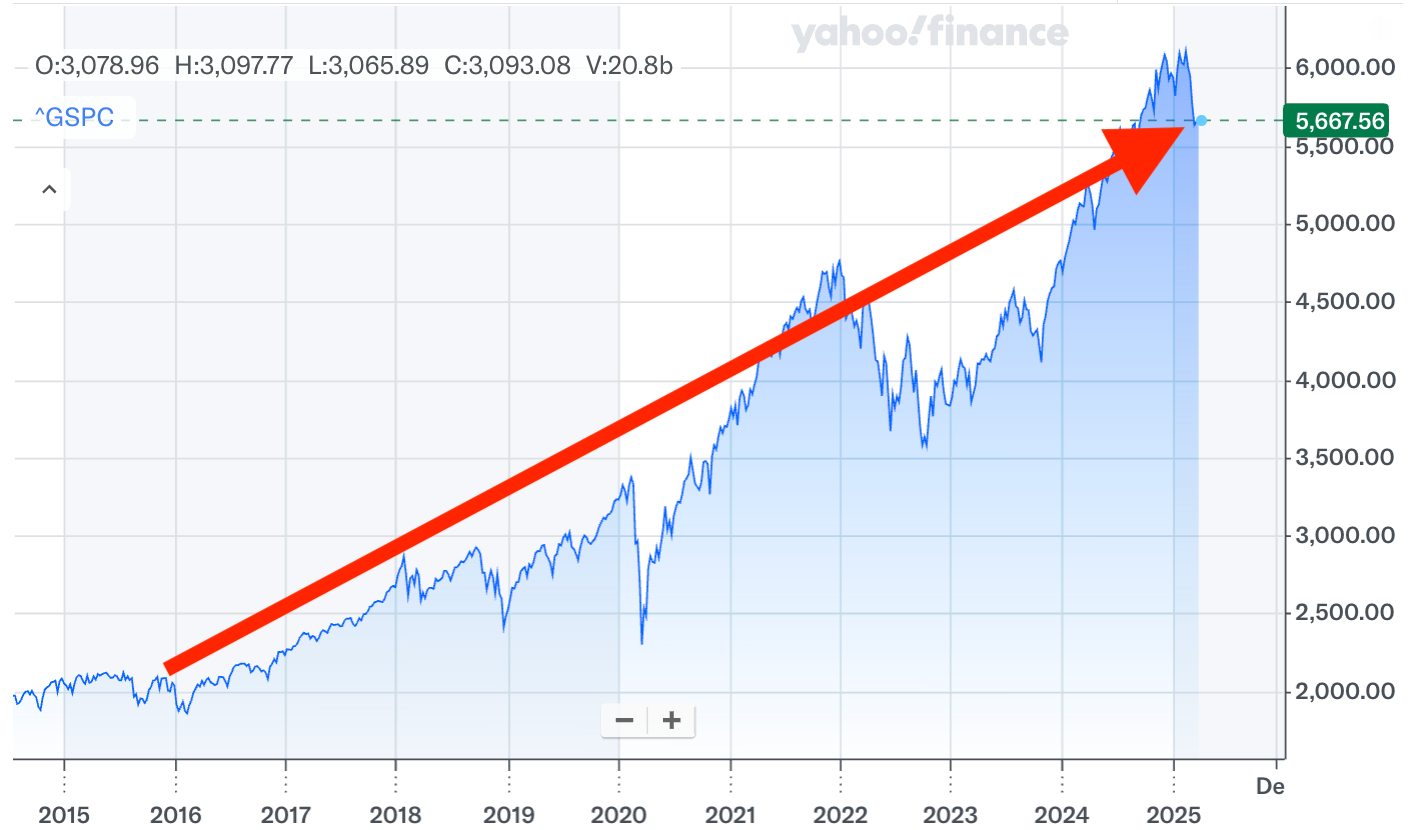
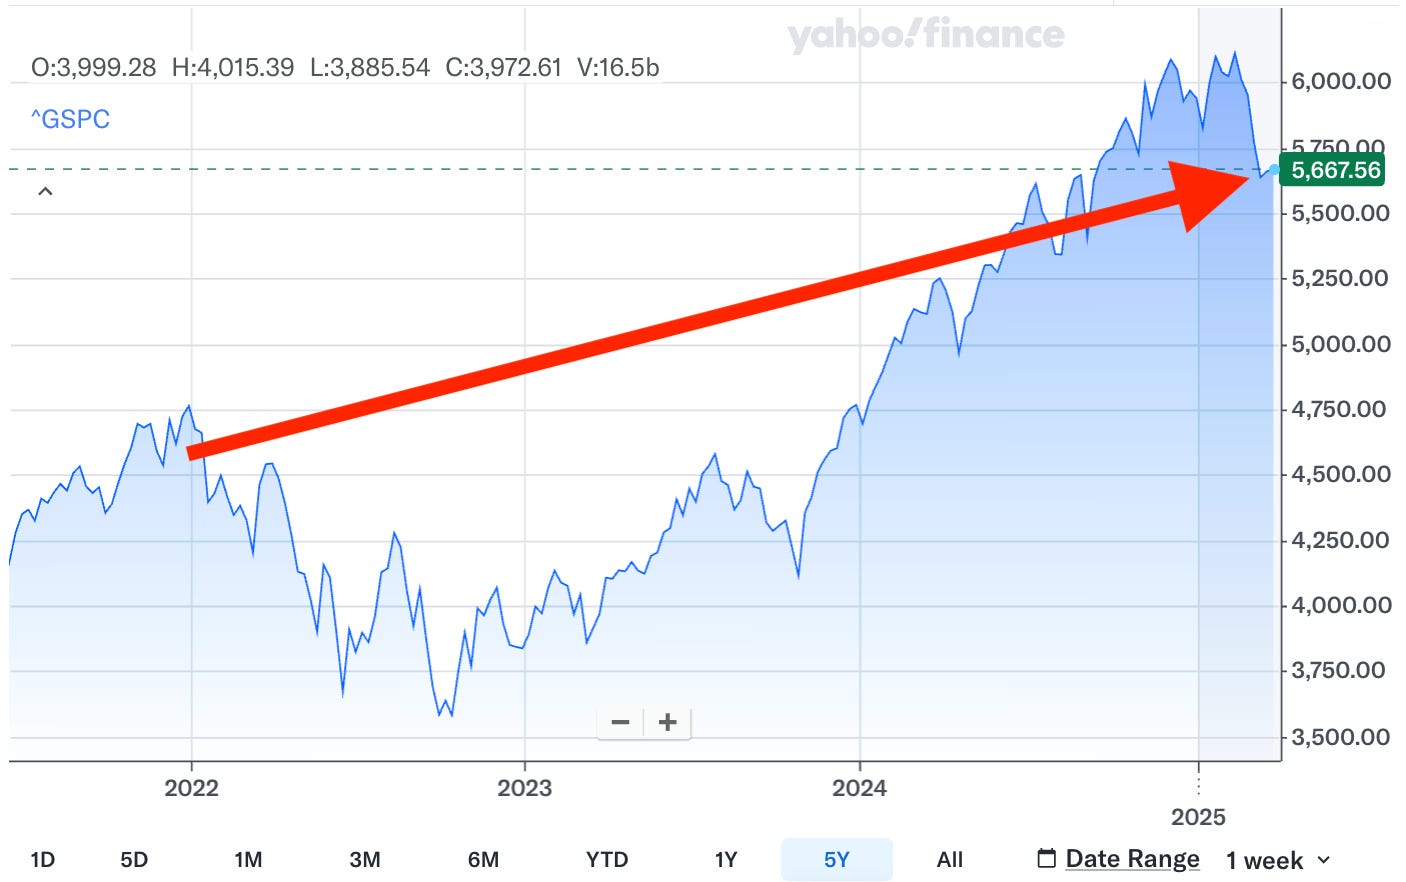
📈 The stock market climbed, with the S&P 500 rising 0.5% last week to close at 5,667.56. It’s now down 7.7% from its February 19 closing high of 6,144.15 and up 58.4% from its October 12, 2022 closing low of 3,577.03. For more on market moves, read: Investing in the stock market is an unpleasant process 📉
–
Like most people who invest in the stock market, I too get nervous when prices are going down. When the selling gets protracted, muscle knots sometimes form in my neck and upper back.
To cope, I do my best to remember that history teaches us big sell-offs are what stock market investing is all about, and that the path to long-term riches in the stock market is riddled with stomach-churning volatility. And importantly, “time in the market beats timing the market.”
With that said, let me tell you about a recent personal experience that confirmed to me that I’m the unluckiest market timer I know.
I consider myself lucky in many ways — except when it comes to timing the stock market.
To be clear, I do not trade actively much at all. But on rare occasions outside of regular periodic contributions to my retirement accounts, I’ve had the good fortune of having some extra cash to put to work.
I recently had one of those occasions.
On Feb. 13, I met with my accountant to do my 2024 tax returns. I learned I had some room to lower my taxable income. And one of the actions I took was contributing more to my self-employed 401(k) plan.
Wasting no time, I transferred cash to that account. And on Feb. 18, I added to my S&P 500 index fund position. The trade confirmation came in on Feb. 19.
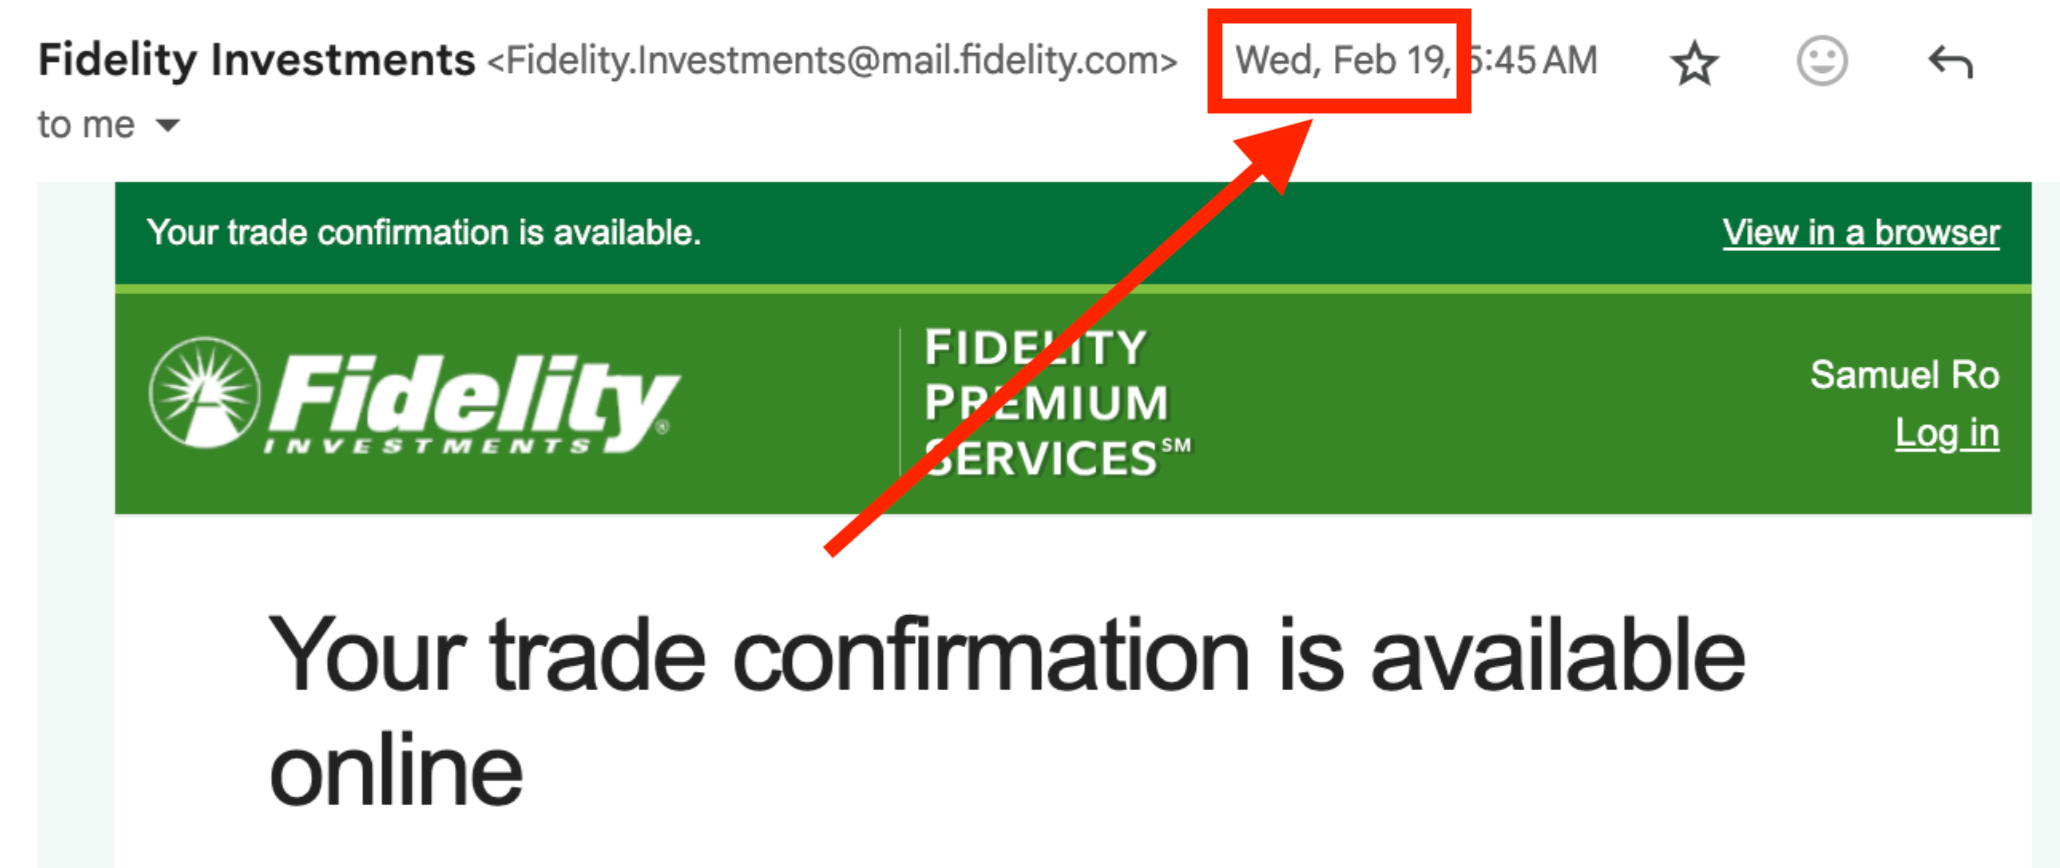
Coincidentally, Feb. 19 was when the S&P 500 last touched a record high before rapidly tumbling into the correction we are living today.
This was not a small amount of money I put to work.
Was it poorly timed? Yes.
Was it a mistake? No.
You’re probably thinking that I should’ve dollar-cost-averaged into the market.
I actually already engage in dollar-cost averaging because of the way my income comes in. But on these unusual occasions, I prefer to make lump sum purchases. I still have 20-30 years until retirement, so I’m not much of a “cash on the sidelines” kind of guy. Also, I’ve read Nick Maggiulli’s piece “Dollar Cost Averaging vs Lump Sum,“ so I understand the kind of risk I’m taking.
I signed up for this.
And now I’m living TKer Stock Market Truth No. 2: You can get smoked in the short-term.
This is not the first time I found myself with some cash to put to work.
As I wrote in the March 6, 2022 TKer, I faced similar situations in late 2015 and late 2021. Both times, I made lump sum purchases into S&P 500 index funds.
And both times, those purchases were almost immediately followed by steep sell-offs.
The 2015 purchase happened while the S&P was on the precipice of a 14% correction. The 2021 purchases happened right as the market was entering a bear market, which saw the S&P fall 25% before bottoming in October 2022.
I am literally the unluckiest market timer I know.

Fortunately, my full-time job is researching the data and writing about having exposure to stocks during the market’s ups and downs. It’s helped me keep my investment decisions very informed.
I also have a carefully thought-out personalized financial strategy that takes into account the risk of big drawdowns. Importantly, I have a time horizon that allows me to ride out the downturns as I build wealth for the long run.
Thanks to having good financial information and a good financial plan, I held on.
And today, those older very poorly timed trades are in the black, and they’re helping me get closer to achieving my long-term financial goals.
The S&P 500 is up about 170% since my late 2015 purchase.
And it’s up about 20% since my late 2021 and early 2022 purchases.
As Bespoke’s Paul Hickey says: “Time heals in the markets.“
Like billionaire investor Warren Buffett, I don’t claim to be good at timing the stock market. (Buffett receives praise for writing a widely circulated op-ed titled “Buy American” during the global financial crisis. Though, he published it in Oct. 2008 before the S&P fell another 26%.)
Fortunately, you don’t have to be a good market timer to be a successful investor. You just have to be able to put in the time.
Investing in the stock market will continue to be an unpleasant process as we cope with two conflicting realities: In the long-run, the stock market usually goes up; but in the short-run, anything and everything can go very badly.
As you do your best to keep your emotions in check, I suggest you remember the lessons from history. You can read all about them in TKer’s archives.
–
Related from TKer:
The stock market will test an investor’s mettle. Below is an excerpt from the January 23, 2022, TKer:
…Investing in the stock market is a challenging mental exercise.
Among other things, investors have to cope with two seemingly conflicting realities: In the long-run, things almost always work out for the better; but in the short-run, anything and everything can go very badly.
In an environment where news headlines seem overwhelmingly alarming, I think it’s helpful for investors to see what history says about the market implications of comparable events. And as you’ll read on TKer, there’s nothing that the stock market couldn’t overcome given enough time.
HOWEVER, it can’t be reiterated enough that 5% pullbacks and 10% corrections happen more often than not in any given year. Bear markets, where stocks fall by more than 20% from their highs, are less frequent, but they are something that long-term investors are likely to confront during their investment time horizons.
Unfortunately, it is incredibly difficult to predict when stocks will fall. And exiting stocks in an attempt to avoid short-term losses can prove incredibly costly to long-term returns.
So, whether or not you can comprehensively identify and balance all of the potential bullish and bearish market catalysts, it’s probably a good idea to just always be prepared for stocks to experience some big dips on their long upward journey…
Read the rest at: Coping with two conflicting realities 🧸🐂
There were several notable data points and macroeconomic developments since our last review:
🏛️ The Fed keeps rates unchanged as expected. In its monetary policy announcement on Wednesday, the Federal Reserve left its target for the federal funds rate unchanged at a range of 4.25% to 5.5%.
From the Fed’s policy statement: “Recent indicators suggest that economic activity has continued to expand at a solid pace. The unemployment rate has stabilized at a low level in recent months, and labor market conditions remain solid. Inflation remains somewhat elevated. The Committee seeks to achieve maximum employment and inflation at the rate of 2% over the longer run. Uncertainty around the economic outlook has increased. The Committee is attentive to the risks to both sides of its dual mandate.”
The committee also reduced its projections for GDP growth while raising projections for inflation in the near-term.
For more on the impact of monetary policy, read: ‘How many times will the Fed cut rates?’ is not the right question for stock market investors 🔪
🛍️ Shopping ticks higher. Retail sales increased 0.2% in February to $722.7 billion.
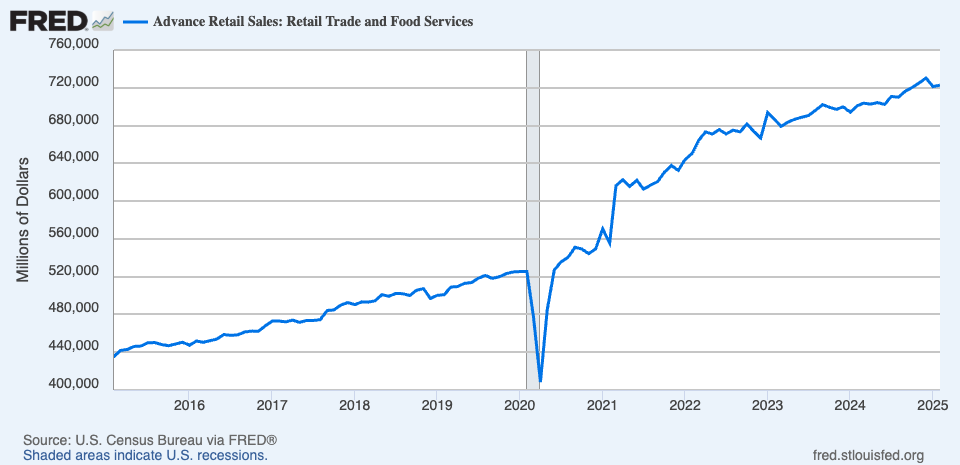
For more on consumer spending, read: Americans have money, and they’re spending it 🛍️ and 9 once-hot economic charts that cooled 📉
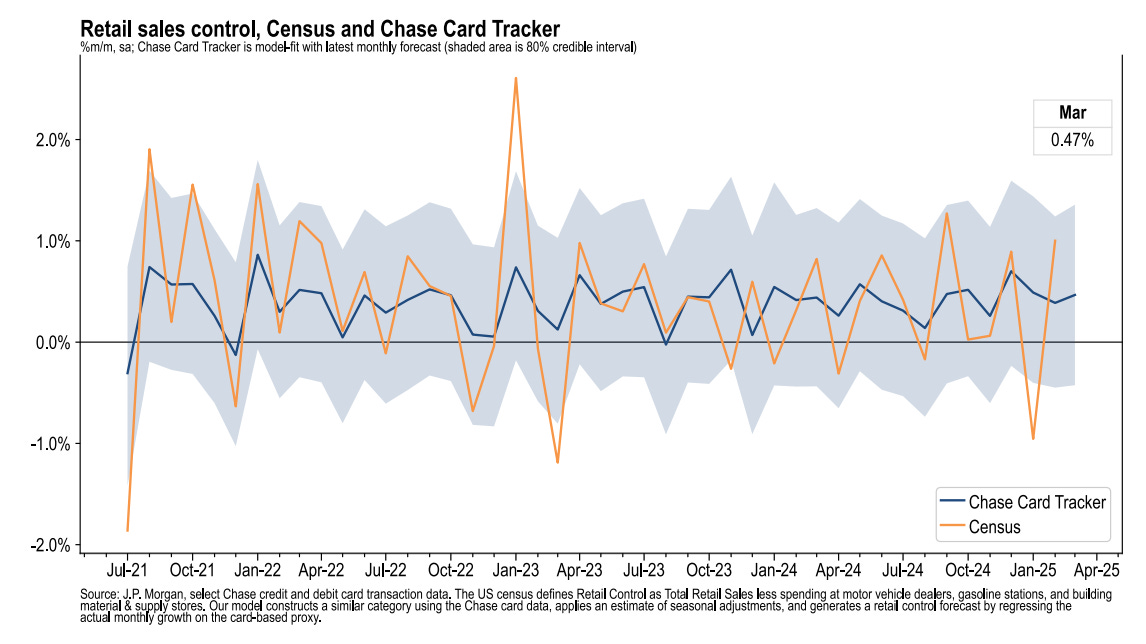
💳 Card spending data is holding up. From JPMorgan: “As of 14 Mar 2025, our Chase Consumer Card spending data (unadjusted) was 2.5% above the same day last year. Based on the Chase Consumer Card data through 14 Mar 2025, our estimate of the US Census March control measure of retail sales m/m is 0.47%.”
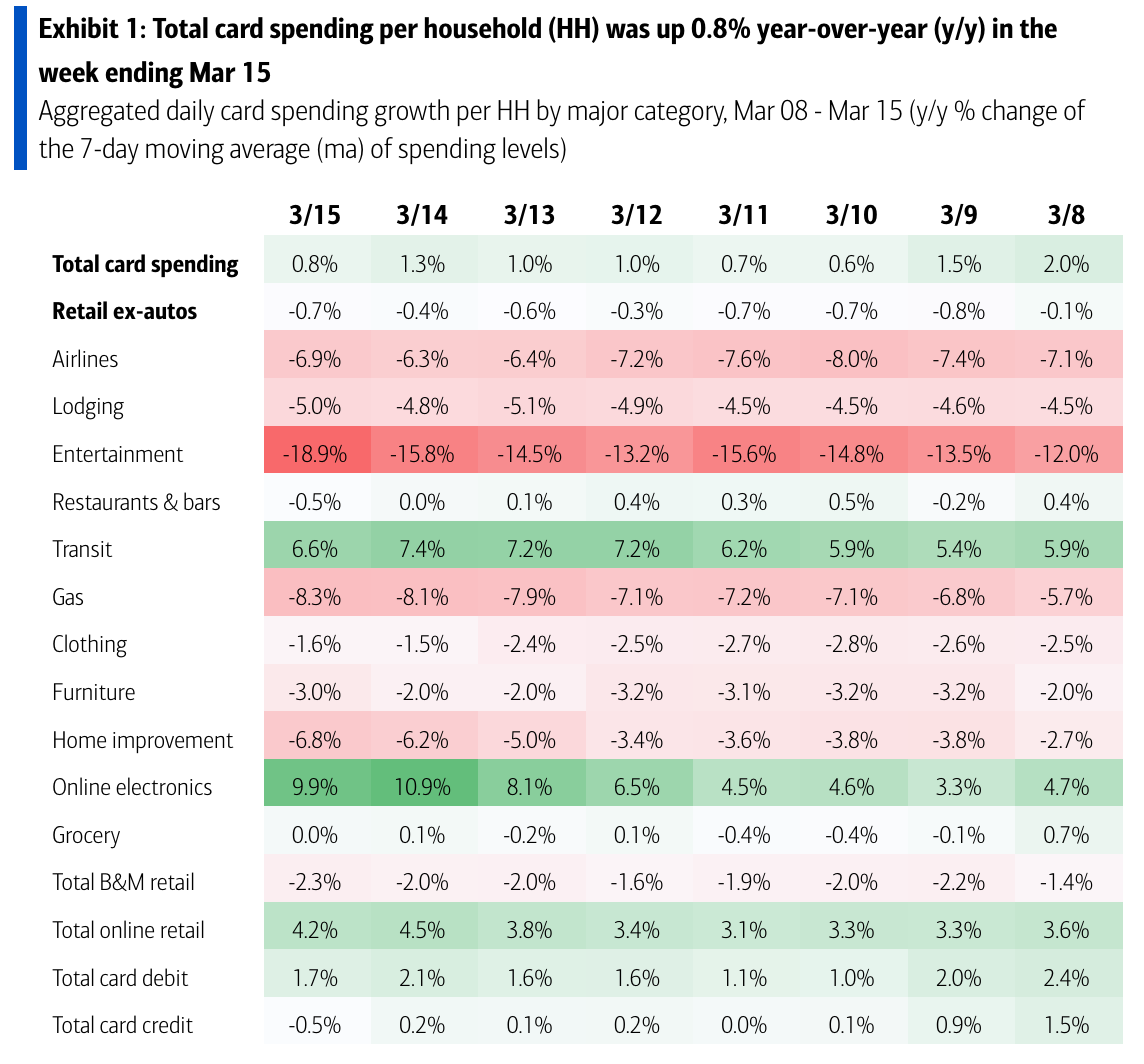
From BofA: “Total card spending per HH was up 0.8% y/y in the week ending Mar 15, according to BAC aggregated credit & debit card data. Among the categories we show, the biggest slowdowns relative to the week ending Mar 8 were in entertainment and HI. Meanwhile, the biggest gain was in online electronics.“
For more on the consumer, read: Americans have money, and they’re spending it 🛍️
⛽️ Gas prices tick higher. From AAA: “After weeks of little movement, the national average for a gallon of gas increased by about 4 cents since last week to $3.12. Even though the price of crude oil remains below $70 a barrel, prices at the pump are going up as more refineries make the seasonal switch to summer-blend gasoline. Summer-blend gas is less likely to evaporate in warmer temperatures and is more expensive to produce.”
For more on energy prices, read: Higher oil prices meant something different in the past 🛢️
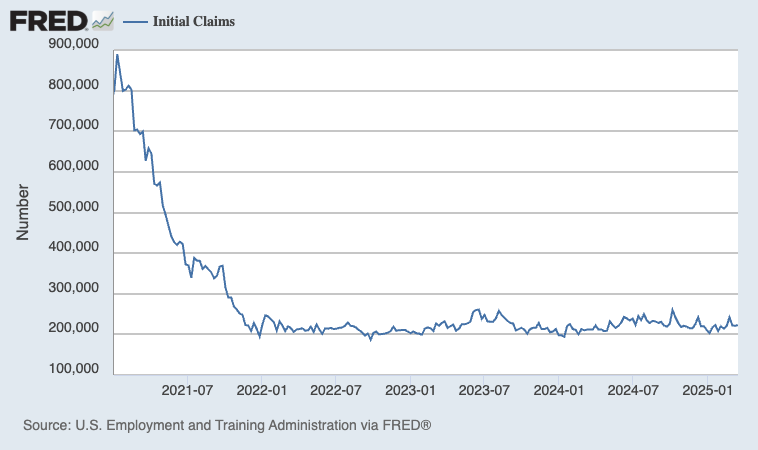
💼 Unemployment claims tick higher. Initial claims for unemployment benefits rose to 223,000 during the week ending March 15, up from 221,000 the week prior. This metric continues to be at levels historically associated with economic growth.
Federal layoffs brought by the Trump administration’s Department of Government Efficiency appear making their way into the data. Initial claims filed by federal employees came in at 1,580 in the week ending March 1.
For more context, read: A note about federal layoffs 🏛️ and The labor market is cooling 💼
🏚 Home sales rise. Sales of previously owned homes increased by 4.2% in February to an annualized rate of 4.26 million units. From NAR chief economist Lawrence Yun: “Home buyers are slowly entering the market. Mortgage rates have not changed much, but more inventory and choices are releasing pent-up housing demand.“
💸 Home prices rise. Prices for previously owned homes increased from last month’s levels and year ago levels. From the NAR: “The median existing-home sales price for all housing types in February was $398,400, up 3.8% from one year ago ($383,800). All four U.S. regions registered price increases.”
🏠 Mortgage rates tick higher. According to Freddie Mac, the average 30-year fixed-rate mortgage rose to 6.67% from 6.65% last week. From Freddie Mac: “The 30-year fixed-rate mortgage has stayed under 7% for nine consecutive weeks, which is helpful for potential buyers and sellers alike.”
There are 147 million housing units in the U.S., of which 86.6 million are owner-occupied and 34 million (or nearly 40%) of which are mortgage-free. Of those carrying mortgage debt, almost all have fixed-rate mortgages, and most of those mortgages have rates that were locked in before rates surged from 2021 lows. All of this is to say: Most homeowners are not particularly sensitive to movements in home prices or mortgage rates.
For more on mortgages and home prices, read: Why home prices and rents are creating all sorts of confusion about inflation 😖
🏠 Homebuilder sentiment falls. From the NAHB’s Carl Harris: “Builders continue to face elevated building material costs that are exacerbated by tariff issues, as well as other supply-side challenges that include labor and lot shortages.”
🔨 New home construction starts rise. Housing starts grew 11.2% in February to an annualized rate of 1.5 million units, according to the Census Bureau. Building permits ticked down 1.2% to an annualized rate of 1.46 million units.
🏢 Offices remain relatively empty. From Kastle Systems: “Peak day office occupancy was 62.9% on Tuesday last week, down half a point from the previous week. Most cities experienced more losses than gains, as three out of five days had lower overall occupancy than last week. Washington, D.C., however, saw higher occupancy every day of the week, matching its post-pandemic record high of 63.1% on Tuesday. And Chicago had higher occupancy on four out of five days, peaking at 71.8% on Tuesday. The average low was on Friday at 36.4%, the same as last week.”
For more on office occupancy, read: This stat about offices reminds us things are far from normal 🏢
🛠️ Industrial activity ticks higher. Industrial production activity in February rose 0.7% from the prior month. Manufacturing output increased 0.9%.
For more on economic activity cooling, read: 9 once-hot economic charts that cooled 📉
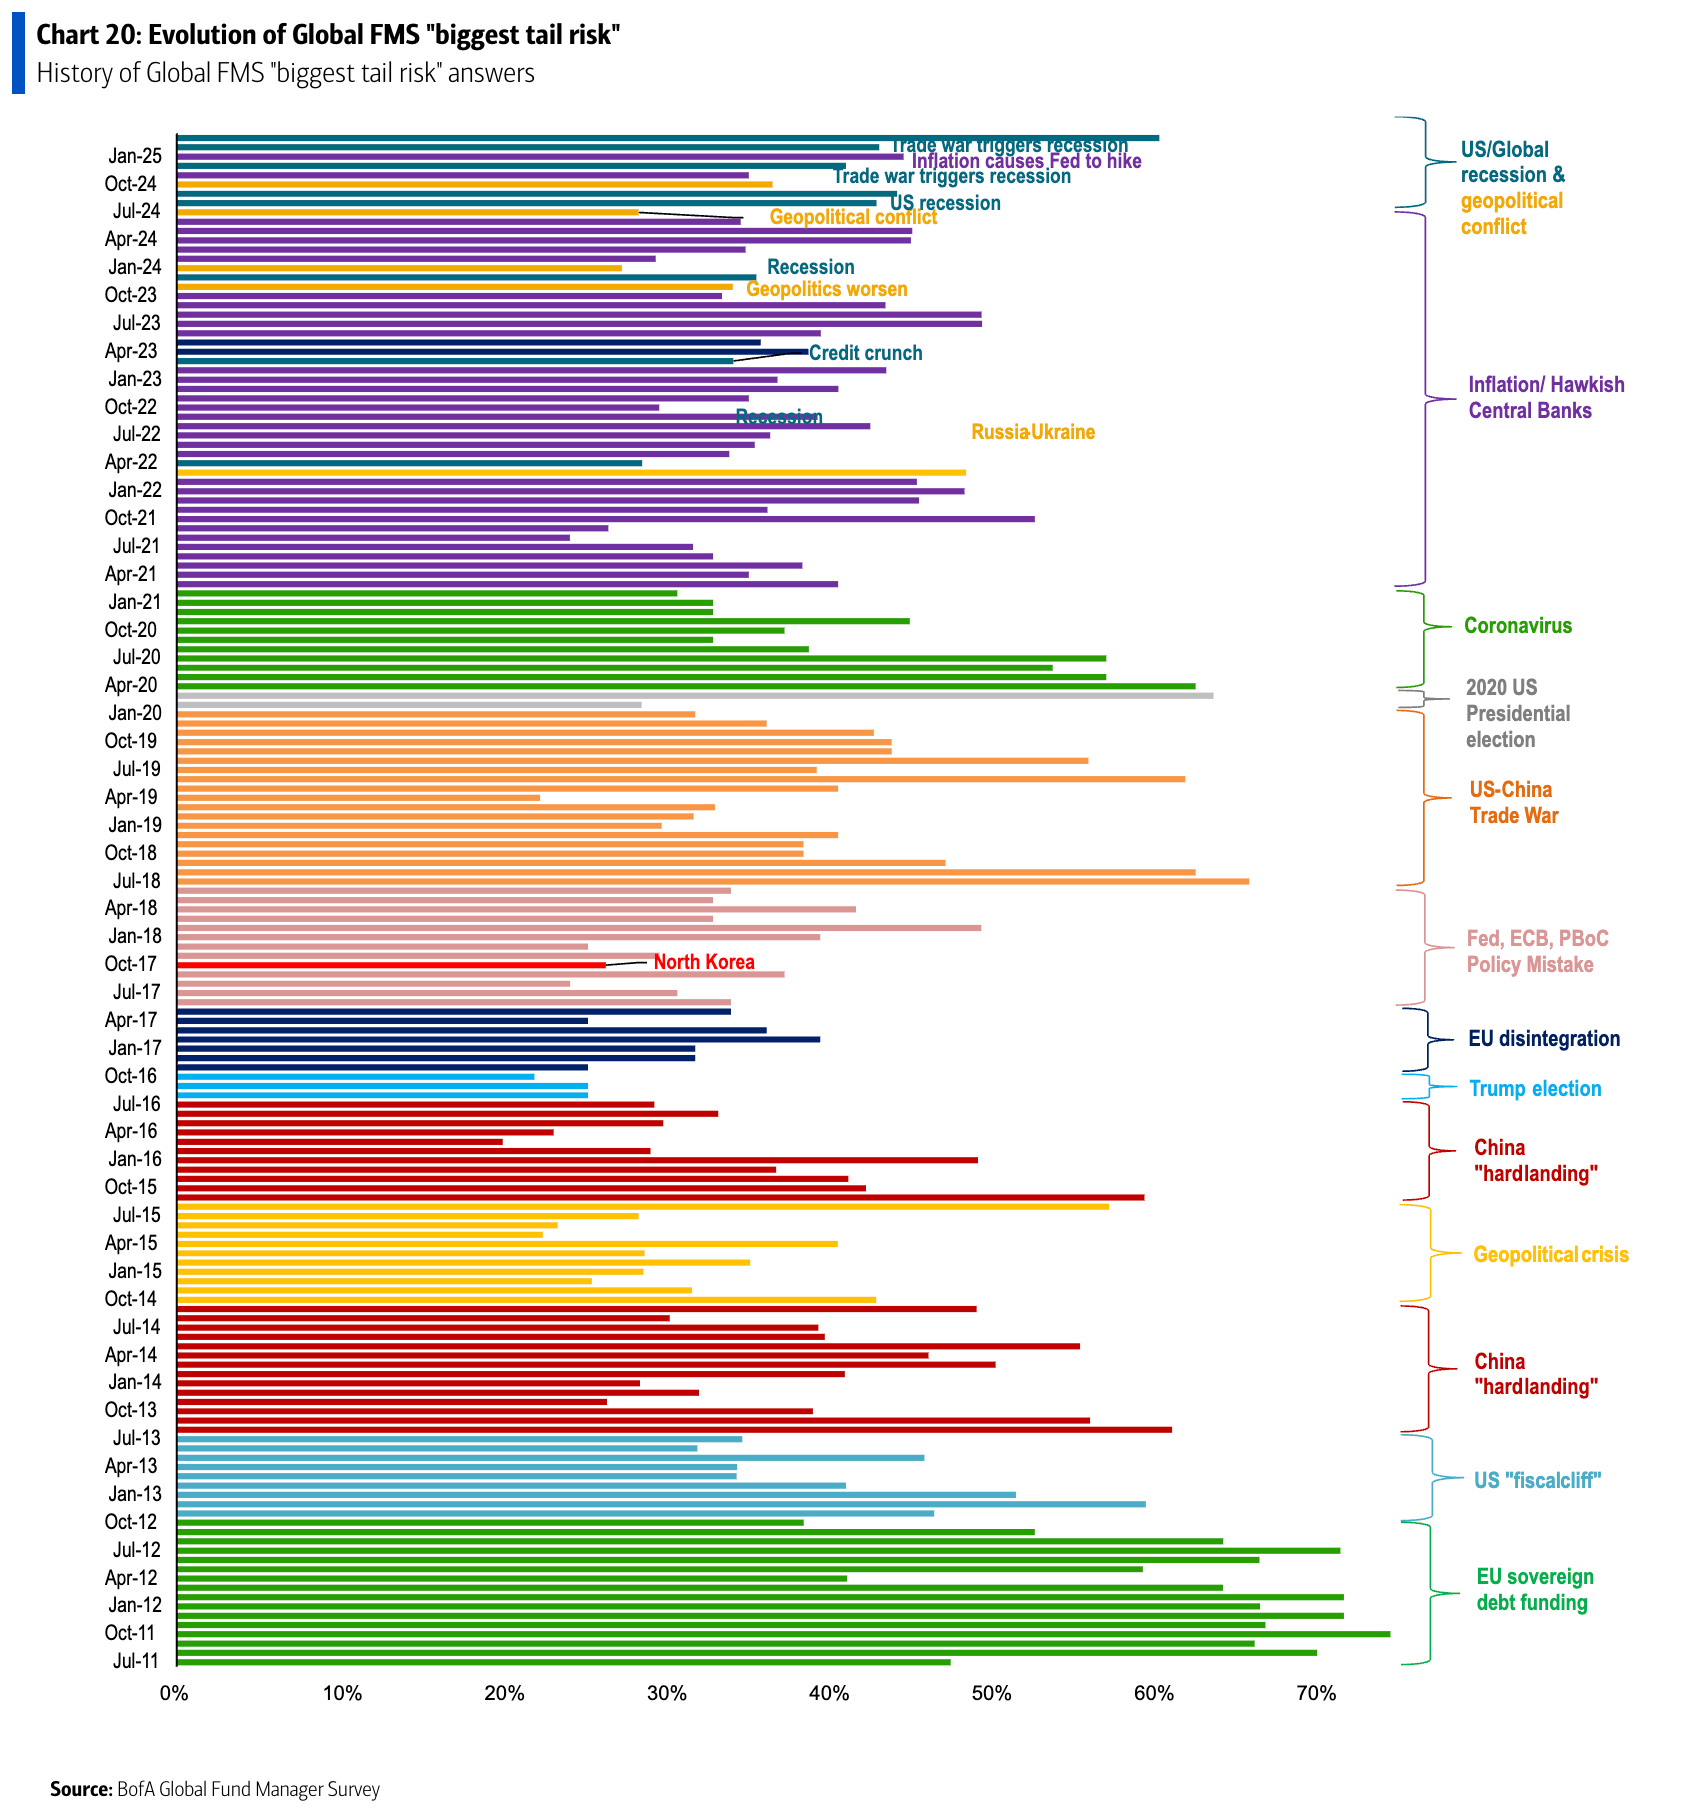
😬 This is the stuff pros are worried about. According to BofA’s March Global Fund Manager Survey: “On tail risks…55% of March FMS investors say a recessionary trade war is the biggest ‘tail risk’, the highest ‘tail risk’ conviction since “Covid resurgence” in Apr’20.”
For more on risks, read: When uncertainty becomes unambiguously high 🎢, Three observations about uncertainty in the markets 😟 and Two times when uncertainty seemed low and confidence was high 🌈
📉 Near-term GDP growth estimates are tracking negative. The Atlanta Fed’s GDPNow model sees real GDP growth declining at a 1.8% rate in Q1.
Matthew C. Klein cautions against reading too much into the recent drop in the GDPNow model. This metric incorporates the uptick in gold imports, which is not included in the BEA’s official calculation of GDP.
For more on the economy, read: 9 once-hot economic charts that cooled 📉
Earnings look bullish: The long-term outlook for the stock market remains favorable, bolstered by expectations for years of earnings growth. And earnings are the most important driver of stock prices.
Demand is positive: Demand for goods and services remains positive, supported by strong consumer and business balance sheets. Job creation, while cooling, also remains positive, and the Federal Reserve — having resolved the inflation crisis — has shifted its focus toward supporting the labor market.
But growth is cooling: While the economy remains healthy, growth has normalized from much hotter levels earlier in the cycle. The economy is less “coiled” these days as major tailwinds like excess job openings have faded. It has become harder to argue that growth is destiny.
Actions speak louder than words: We are in an odd period given that the hard economic data has decoupled from the soft sentiment-oriented data. Consumer and business sentiment has been relatively poor, even as tangible consumer and business activity continue to grow and trend at record levels. From an investor’s perspective, what matters is that the hard economic data continues to hold up.
Stocks look better than the economy: Analysts expect the U.S. stock market could outperform the U.S. economy, thanks largely due to positive operating leverage. Since the pandemic, companies have adjusted their cost structures aggressively. This has come with strategic layoffs and investment in new equipment, including hardware powered by AI. These moves are resulting in positive operating leverage, which means a modest amount of sales growth — in the cooling economy — is translating to robust earnings growth.
Mind the ever-present risks: Of course, this does not mean we should get complacent. There will always be risks to worry about — such as U.S. political uncertainty, geopolitical turmoil, energy price volatility, cyber attacks, etc. There are also the dreaded unknowns. Any of these risks can flare up and spark short-term volatility in the markets.
Investing is never a smooth ride: There’s also the harsh reality that economic recessions and bear markets are developments that all long-term investors should expect to experience as they build wealth in the markets. Always keep your stock market seat belts fastened.
Think long term: For now, there’s no reason to believe there’ll be a challenge that the economy and the markets won’t be able to overcome over time. The long game remains undefeated, and it’s a streak long-term investors can expect to continue.
For more on how the macro story is evolving, check out the previous review of the macro crosscurrents »
Here’s a roundup of some of TKer’s most talked-about paid and free newsletters about the stock market. All of the headlines are hyperlinked to the archived pieces.
The stock market can be an intimidating place: It’s real money on the line, there’s an overwhelming amount of information, and people have lost fortunes in it very quickly. But it’s also a place where thoughtful investors have long accumulated a lot of wealth. The primary difference between those two outlooks is related to misconceptions about the stock market that can lead people to make poor investment decisions.
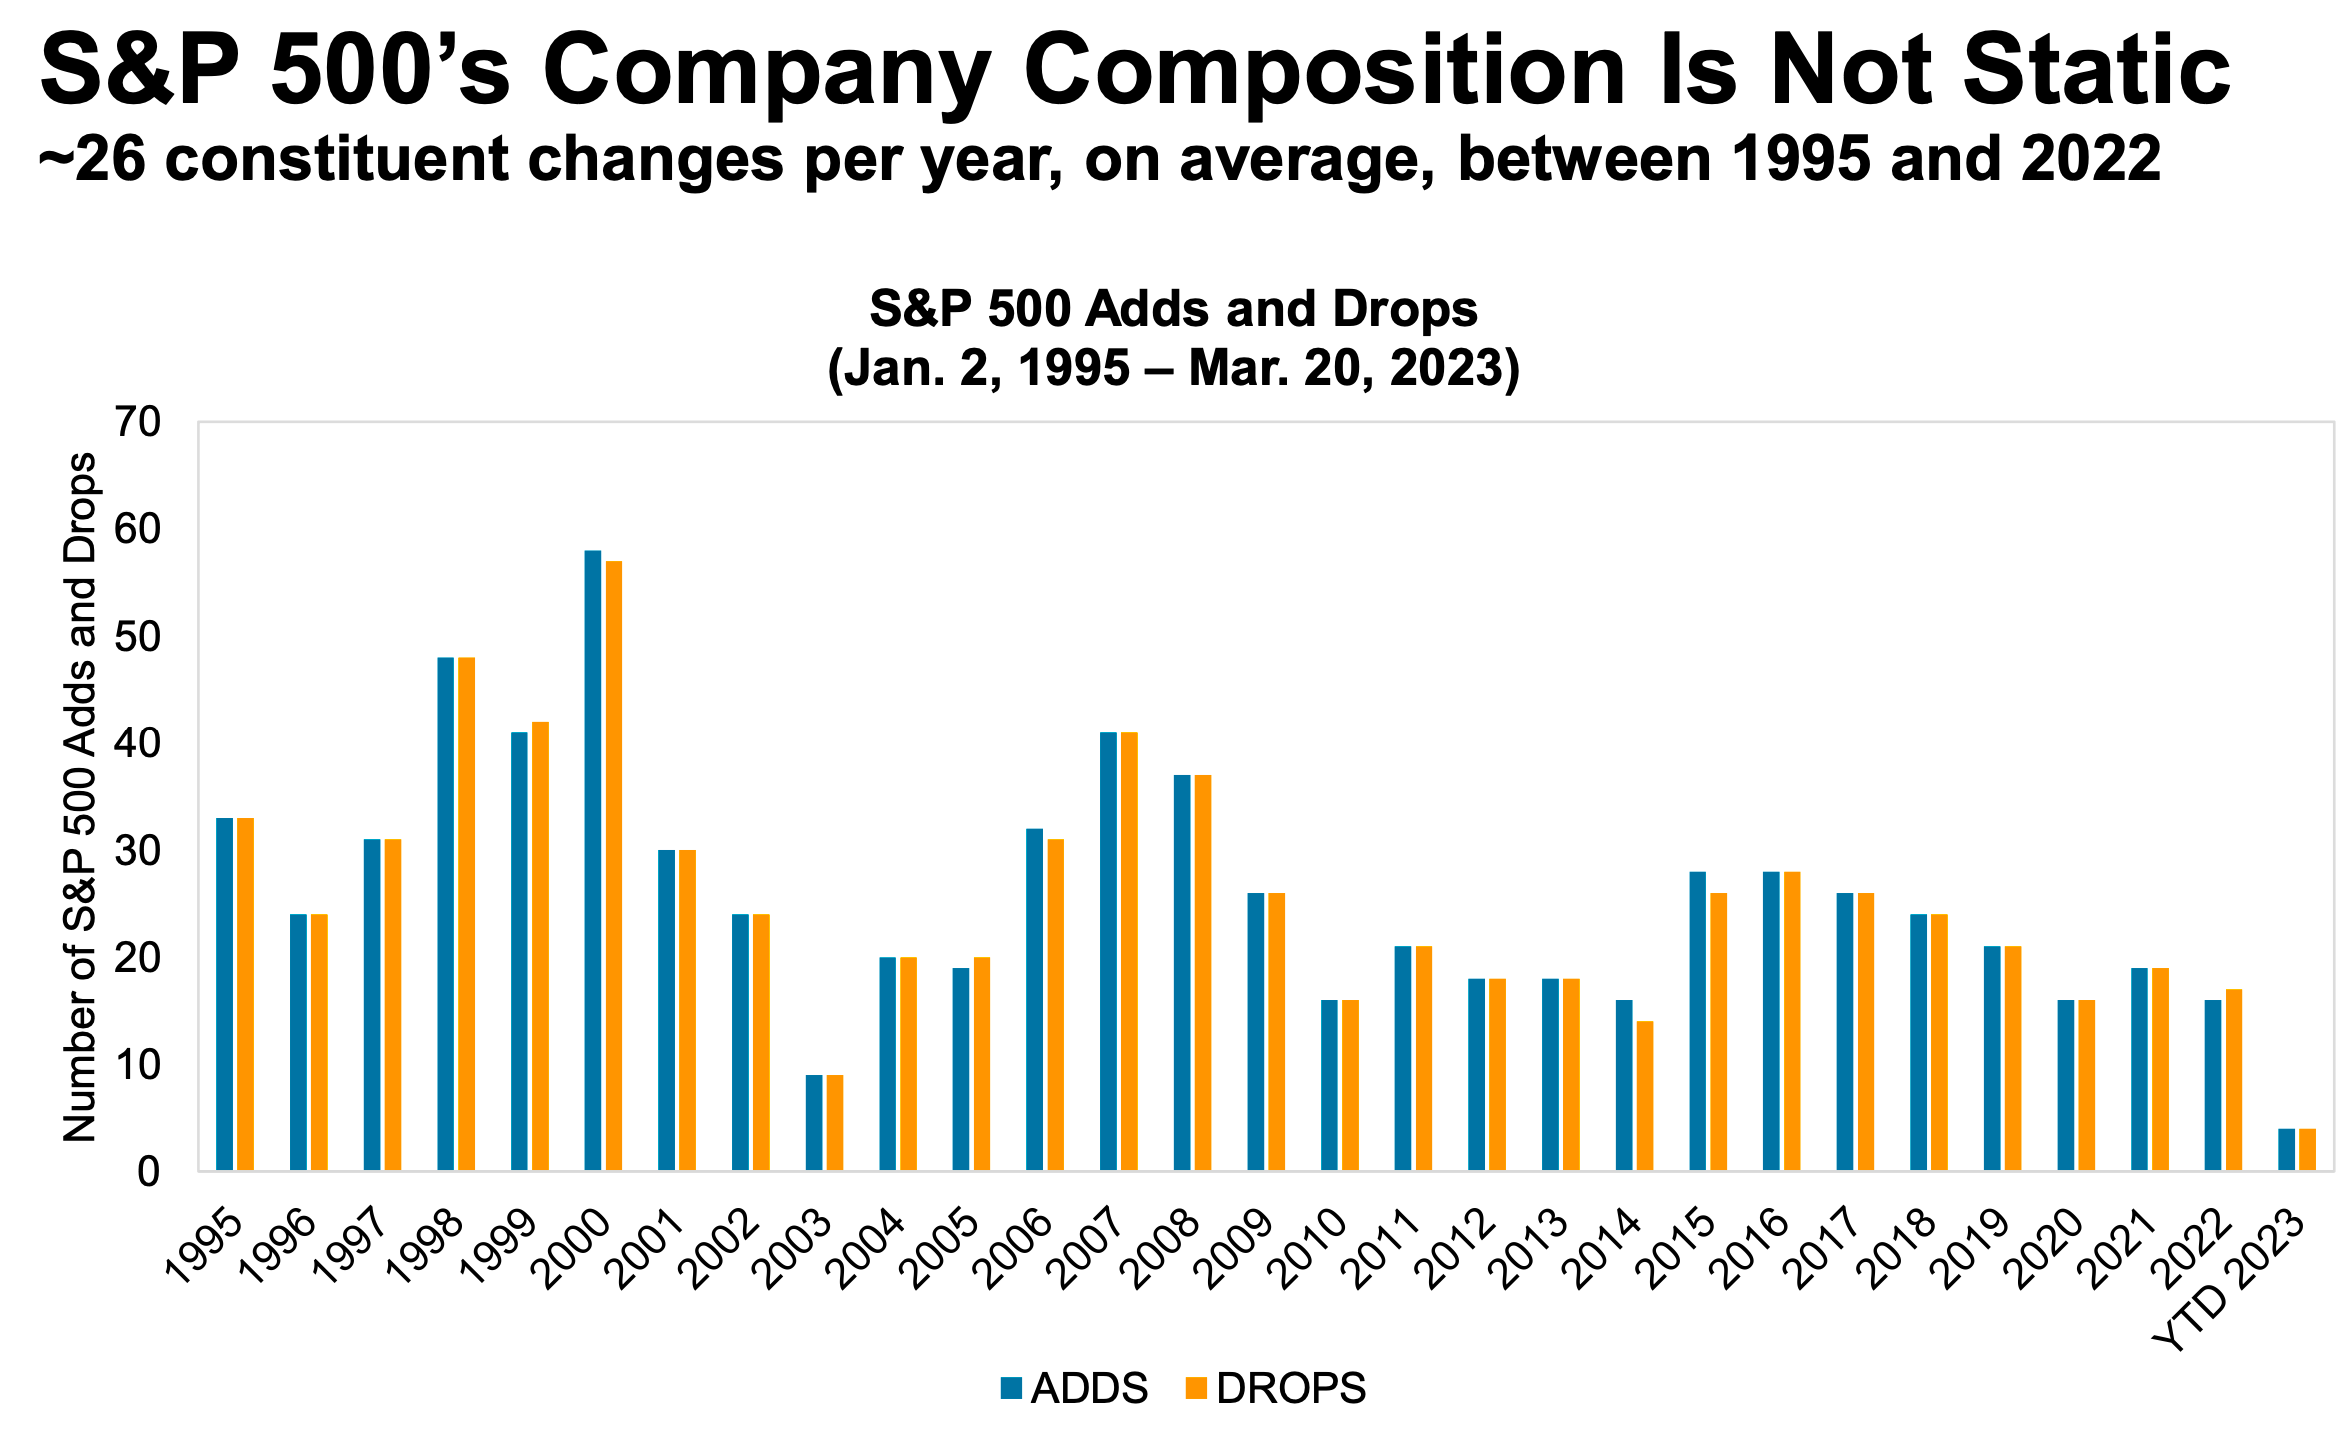
Passive investing is a concept usually associated with buying and holding a fund that tracks an index. And no passive investment strategy has attracted as much attention as buying an S&P 500 index fund. However, the S&P 500 — an index of 500 of the largest U.S. companies — is anything but a static set of 500 stocks.
For investors, anything you can ever learn about a company matters only if it also tells you something about earnings. That’s because long-term moves in a stock can ultimately be explained by the underlying company’s earnings, expectations for earnings, and uncertainty about those expectations for earnings. Over time, the relationship between stock prices and earnings have a very tight statistical relationship.

Investors should always be mentally prepared for some big sell-offs in the stock market. It’s part of the deal when you invest in an asset class that is sensitive to the constant flow of good and bad news. Since 1950, the S&P 500 has seen an average annual max drawdown (i.e., the biggest intra-year sell-off) of 14%.

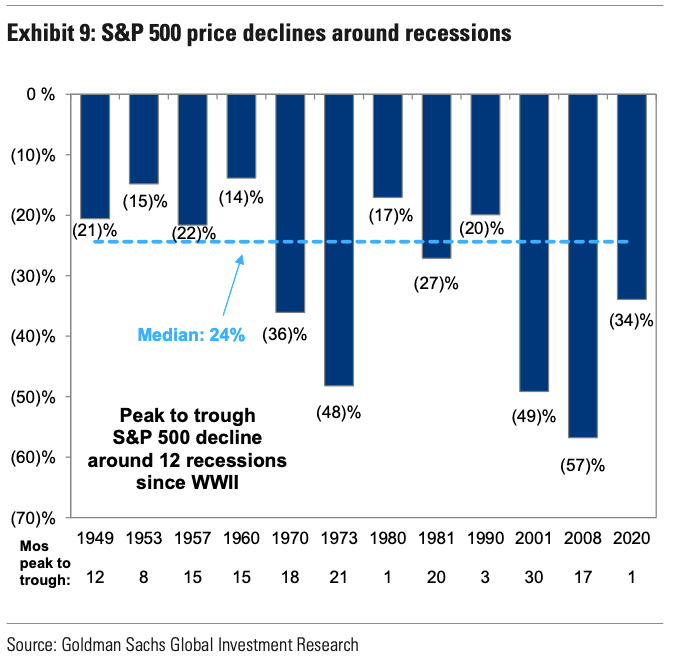
Every recession in history was different. And the range of stock performance around them varied greatly. There are two things worth noting. First, recessions have always been accompanied by a significant drawdown in stock prices. Second, the stock market bottomed and inflected upward long before recessions ended.
Since 1928, the S&P 500 generated a positive total return more than 89% of the time over all five-year periods. Those are pretty good odds. When you extend the timeframe to 20 years, you’ll see that there’s never been a period where the S&P 500 didn’t generate a positive return.
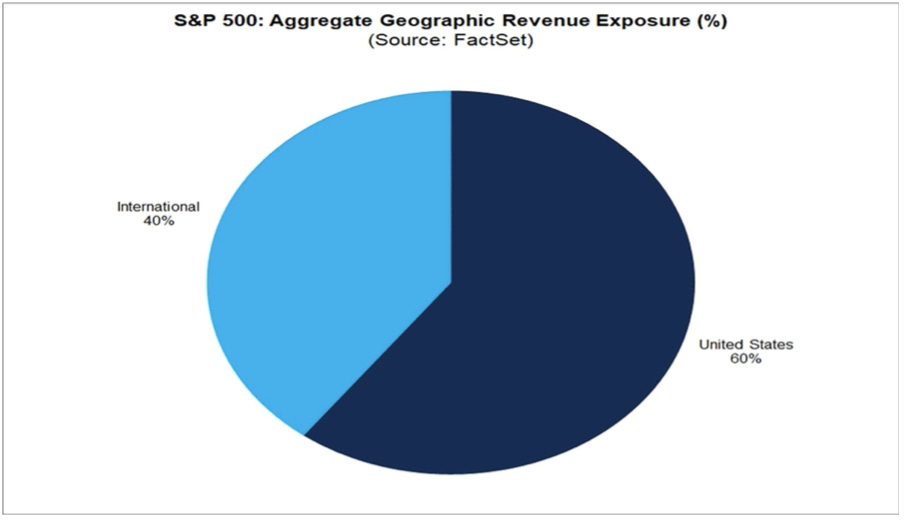
While a strong dollar may be great news for Americans vacationing abroad and U.S. businesses importing goods from overseas, it’s a headwind for multinational U.S.-based corporations doing business in non-U.S. markets.
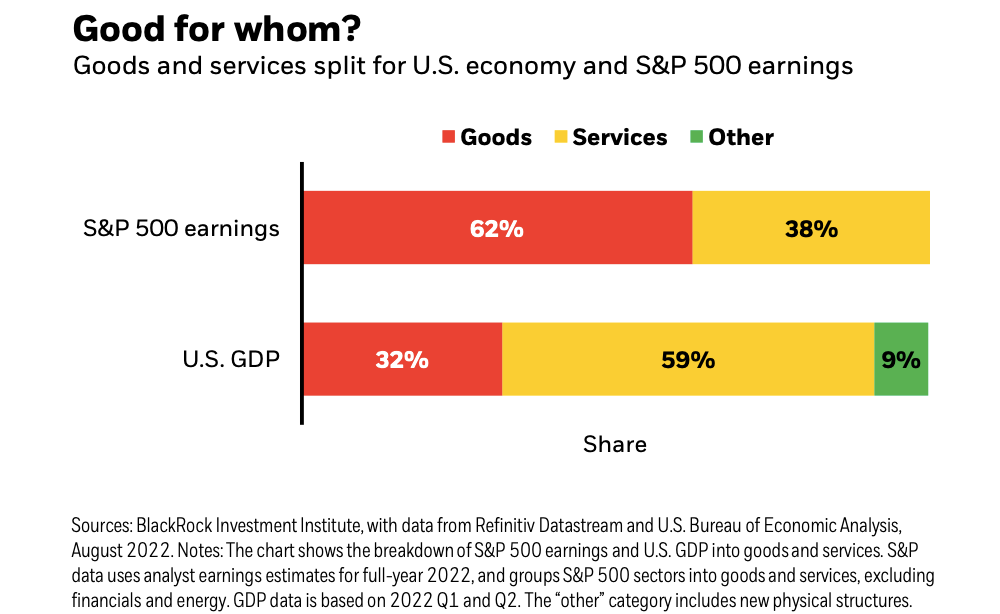
The stock market sorta reflects the economy. But also, not really. The S&P 500 is more about the manufacture and sale of goods. U.S. GDP is more about providing services.
…you don’t want to buy them when earnings are great, because what are they doing when their earnings are great? They go out and expand capacity. Three or four years later, there’s overcapacity and they’re losing money. What about when they’re losing money? Well, then they’ve stopped building capacity. So three or four years later, capacity will have shrunk and their profit margins will be way up. So, you always have to sort of imagine the world the way it’s going to be in 18 to 24 months as opposed to now. If you buy it now, you’re buying into every single fad every single moment. Whereas if you envision the future, you’re trying to imagine how that might be reflected differently in security prices.
Some event will come out of left field, and the market will go down, or the market will go up. Volatility will occur. Markets will continue to have these ups and downs. … Basic corporate profits have grown about 8% a year historically. So, corporate profits double about every nine years. The stock market ought to double about every nine years… The next 500 points, the next 600 points — I don’t know which way they’ll go… They’ll double again in eight or nine years after that. Because profits go up 8% a year, and stocks will follow. That’s all there is to it.
Long ago, Sir Isaac Newton gave us three laws of motion, which were the work of genius. But Sir Isaac’s talents didn’t extend to investing: He lost a bundle in the South Sea Bubble, explaining later, “I can calculate the movement of the stars, but not the madness of men.” If he had not been traumatized by this loss, Sir Isaac might well have gone on to discover the Fourth Law of Motion: For investors as a whole, returns decrease as motion increases.
According to S&P Dow Jones Indices (SPDJI), 65% of U.S. large-cap equity fund managers underperformed the S&P 500 in 2024. As you stretch the time horizon, the numbers get even more dismal. Over a three-year period, 85% underperformed. Over a 10-year period, 90% underperformed. And over a 20-year period, 92% underperformed. This 2023 performance follows 14 consecutive years in which the majority of fund managers in this category have lagged the index.

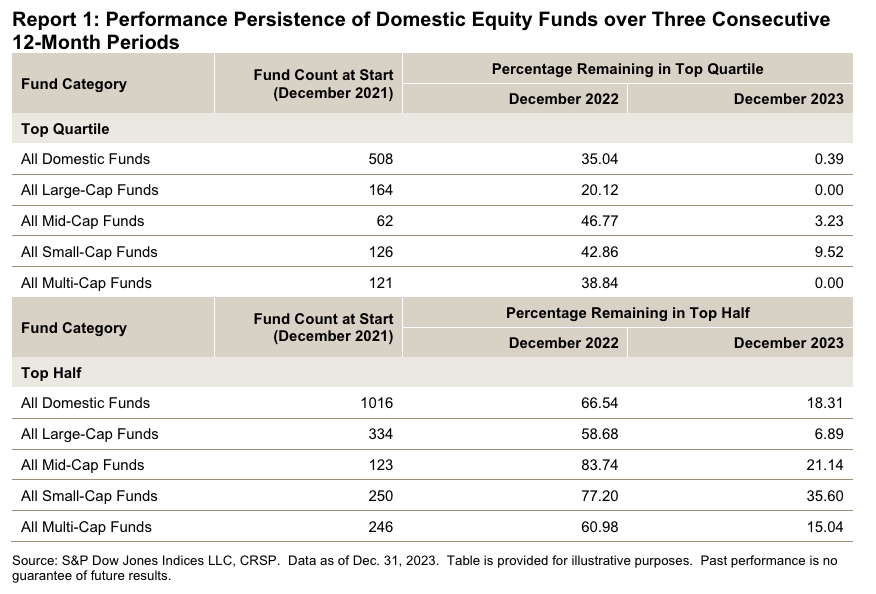
S&P Dow Jones Indices found that funds beat their benchmark in a given year are rarely able to continue outperforming in subsequent years. For example, 334 large-cap equity funds were in the top half of performance in 2021. Of those funds, 58.7% came in the top half again in 2022. But just 6.9% were able to extend that streak through 2023. If you set the bar even higher and consider those in the top quartile of performance, just 20.1% of 164 large-cap funds remained in the top quartile in 2022. No large-cap funds were able to stay in the top quartile for the three consecutive years ending in 2023.
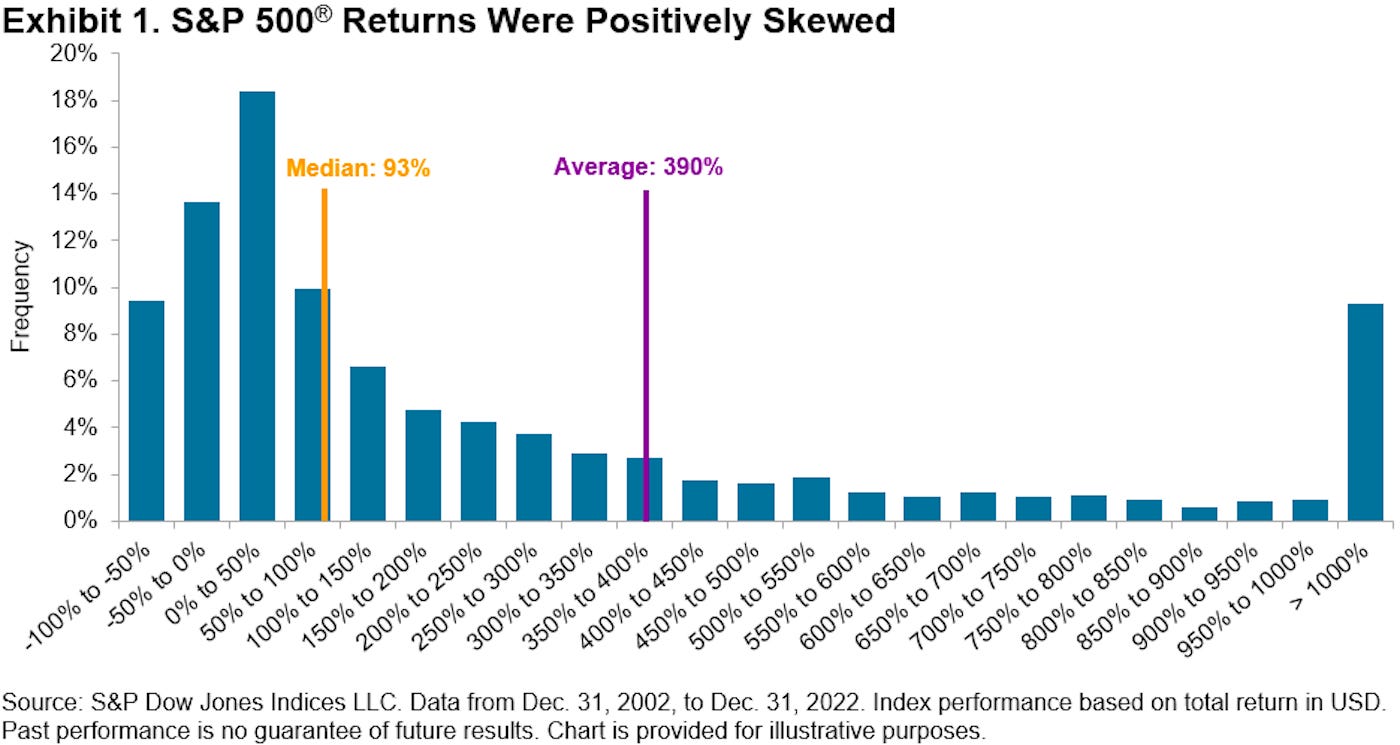
Picking stocks in an attempt to beat market averages is an incredibly challenging and sometimes money-losing effort. In fact, most professional stock pickers aren’t able to do this on a consistent basis. One of the reasons for this is that most stocks don’t deliver above-average returns. According to S&P Dow Jones Indices, only 24% of the stocks in the S&P 500 outperformed the average stock’s return from 2000 to 2022. Over this period, the average return on an S&P 500 stock was 390%, while the median stock rose by just 93%.