In this Stacked Pro breakdown:
Comparison
We analysed the price movements of two-bedroom units in District 10 from 2014 to 2024, comparing new launch, sub sale, and resale transactions. We also examined specific developments like 19 Nassim, Grange 1866, and Perfect Ten alongside resale mainstays like D’Leedon, Spring Grove, and Dynasty Garden.
Key Insight In this Stacked Pro breakdown:
While District 7 recorded the highest price gap in 2024, District 10’s 28.6 per cent premium remains one of the largest among core prime districts; and raises considerations about liveability value versus launch pricing.
Why This Matters
With a growing number of one-bedder buyers struggling to stretch into two-bedder territory, and upgraders weighing three- versus four-bedder options, D10’s widening price gaps spotlight a deeper affordability issue – but also reveal where hidden value still exists.
🔓 Read the full analysis, only on Stacked Pro.
Already a subscriber? Log in here.
District 10 is one of Singapore’s best known prime districts, and names like Tanglin, Bukit Timah, and Holland V are synonymous with luxury estates. So whilst anyone looking for a condo here is probably braced for high prices, the recent gap between new launch and resale prices ought to give many pause for thought.
A notable issue with District 10 is that, due to the high prevalence of freehold land, you tend to find many older condos in this area. These are projects that might date all the way back to the 1980s; and whilst they’re still in a prime area, their sheer age difference can result in significant price gaps compared to newer condos. As of 2024, the average price gap between a new and resale two-bedroom unit in D10 stands at a staggering $687,151, or 28.6 per cent. That makes it the second-largest price gap for new versus resale two-bedders anywhere in Singapore. Due to this situation, a big question for buyers in District 10 today is: are the new launch premiums still worth paying? Let’s take a look:
Let’s start by looking at the price gap between new and resale condos in District 10, over the years:
Average price

| Year | New sale | Subsale and resale | Price gap | % Difference |
| 2014 | $1,824,053 | $1,768,360 | $55,694 | 3.15% |
| 2015 | $1,692,409 | $1,723,992 | -$31,583 | -1.83% |
| 2016 | $2,317,678 | $1,709,908 | $607,770 | 35.54% |
| 2017 | $1,764,244 | $1,892,367 | -$128,123 | -6.77% |
| 2018 | $1,994,884 | $1,864,874 | $130,009 | 6.97% |
| 2019 | $2,303,165 | $1,926,608 | $376,557 | 19.55% |
| 2020 | $1,927,988 | $1,879,980 | $48,008 | 2.55% |
| 2021 | $1,956,093 | $1,986,262 | -$30,169 | -1.52% |
| 2022 | $2,159,308 | $1,985,024 | $174,285 | 8.78% |
| 2023 | $2,397,031 | $2,084,782 | $312,249 | 14.98% |
| 2024 | $3,088,110 | $2,400,959 | $687,151 | 28.62% |
Average size
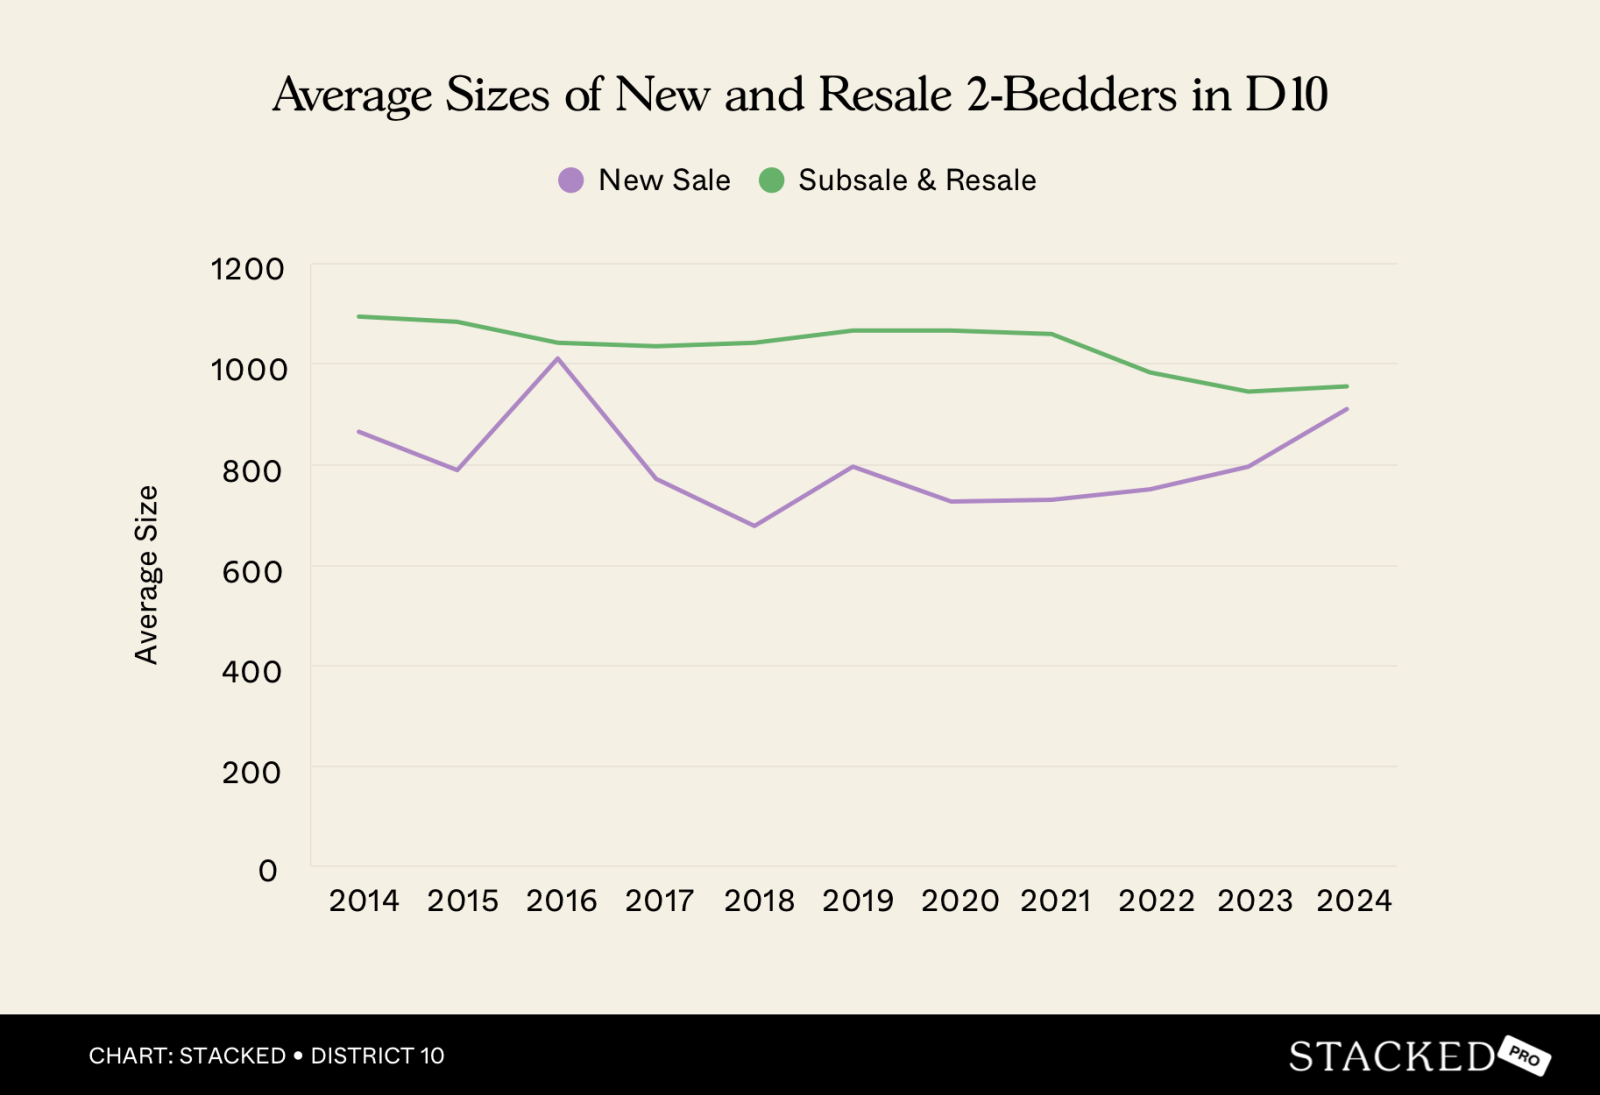
| Year | New sale | Subsale and resale | Size Difference |
| 2014 | 865 | 1095 | -231 |
| 2015 | 789 | 1086 | -297 |
| 2016 | 1012 | 1042 | -30 |
| 2017 | 772 | 1037 | -265 |
| 2018 | 679 | 1044 | -364 |
| 2019 | 797 | 1068 | -271 |
| 2020 | 728 | 1069 | -341 |
| 2021 | 731 | 1060 | -329 |
| 2022 | 751 | 984 | -233 |
| 2023 | 797 | 946 | -149 |
| 2024 | 911 | 955 | -44 |
The price gap fluctuated in earlier years, but a clear trend has emerged since 2022: new launch prices are now accelerating at a much faster pace than resale counterparts. In 2022, the price gap stood at $174,285 (8.78 per cent); by 2024, it had widened to $687,151 (28.6 per cent).
Meanwhile, resale units continue to offer more space despite a slight narrowing of the size gap in recent years. In 2018, the average new launch two-bedder was just 679 sq ft, compared to 1,044 sq ft for resale units, a difference of 365 sq ft. In 2024, resale units still averaged 955 sq ft versus 911 sq ft for new launches (in this instance, the bigger units at 19 Nassim formed the bulk of the transactions, hence the bigger average). In several past years, such as 2015 and 2020, the size difference exceeded 300 sq ft, making resale options substantially more spacious for the price.
Now let’s take a look at transactions in 2024, to make some comparisons
New launches sold
| Project | Tenure | Average price | Average $PSF | Smallest unit size | Largest unit size | Average unit size | No. of units sold |
| 19 NASSIM | 99-year | $3,202,234 | $3,402 | 807 | 1109 | 940 | 33 |
| BOULEVARD 88 | Freehold | $5,301,300 | $4,037 | 1313 | 1313 | 1313 | 2 |
| GRANGE 1866 | Freehold | $2,608,500 | $3,189 | 710 | 1012 | 819 | 10 |
| JERVOIS PRIVE | Freehold | $2,133,000 | $3,002 | 710 | 710 | 710 | 1 |
| PERFECT TEN | Freehold | $2,736,070 | $3,494 | 753 | 797 | 783 | 4 |
| WILSHIRE RESIDENCES | Freehold | $2,055,000 | $2,727 | 753 | 753 | 753 | 1 |
There are two important points of note, when we consider the new launch two-bedders sold in 2024.
First, Boulevard 88 has skewed the apparent new launch / resale price gap. It is far more expensive than other condos in the dataset, with a quantum of over $5.3 million, versus counterparts in the $2 million to $3.2 million range. This is because its “two-bedder” is not truly a two-bedder, but a 1,300+ sq ft unit.
If we were to exclude Boulevard 88 from this current calculation, the average price for new launches here falls to around $2.55 million; that’s much closer to the resale/subsale average of $2.4 million.
As such, we’ll need to exclude Boulevard 88 as an outlier, in subsequent comparisons.
It is also important to consider volume: two of the projects recorded just one transaction each, meaning their average prices may not be reliable indicators of the broader trend; but low transaction volumes are common among the many high-priced, small and boutique condos in District 10 – so we’ll have to make do with what we can.
A second consideration: none of these new launches were freshly launched in 2024. All six projects were originally launched between 2019 and 2021, meaning they have been on the market for several years. This would further skew the price gap, because it’s a standard developer tactic to raise prices in later sale phases.
(For more on why this happens, check out this article on developer pricing strategies.)
More practically, two of the developments on this list, Jervois Prive and Wilshire Residences, had average prices lower than the $2.4 million average for sub sale / resale two-bedders, so that may suggest a good deal.
Let’s take a look at the two-bedders at these projects, individually
19 Nassim
| Year | Average price | Average $PSF | Smallest unit size | Largest unit size | Average unit size | No. of units sold |
| 2021 | $2,833,920 | $3,510 | 807 | 807 | 807 | 1 |
| 2023 | $2,938,750 | $3,254 | 829 | 1109 | 899 | 4 |
| 2024 | $3,202,234 | $3,402 | 807 | 1109 | 940 | 33 |
Here we see a good example of the phenomenon we mentioned earlier: it’s later in the sale phases before the new launch units start to move. 19 Nassim saw its highest transaction volume for two-bedder units in 2024 with 33 units sold, but it sold just four in 2023 and one in 2021. This was due to two reasons: first, 19 Nassim saw a discount later after launch, which we covered in an article a few years back when it happened. In addition, realtors told us that – once a project is completed – it is more alluring to buyers who can physically inspect the real development, and move in immediately. This was the case with 19 Nassim.
The average price rose from $2.83 million in 2021 to over $3.2 million in 2024, a jump of around 13 per cent over three years. The average unit size also increased from 807 sq ft in 2021 to 940 sq ft in 2024, suggesting that the larger units were bought later on.
What’s particularly unusual is the $PSF trend: while the average unit size increased, the average $PSF also rose from $3,254 in 2023 to $3,402 in 2024. Typically, larger units command a lower $PSF, but in this case, the larger units were sold at higher $PSF, which bucks the usual pricing pattern.
Grange 1866
| Year | Average price | Average $PSF | Smallest unit size | Largest unit size | Average unit size | No. of units sold |
| 2021 | $2,132,199 | $2,729 | 710 | 829 | 781 | 7 |
| 2022 | $2,298,000 | $3,007 | 764 | 764 | 764 | 1 |
| 2023 | $2,237,000 | $2,988 | 710 | 829 | 747 | 18 |
| 2024 | $2,608,500 | $3,189 | 710 | 1012 | 819 | 10 |
Transaction volume and prices at Grange 1866 have both picked up in the past two years. In 2024, the project recorded 10 two-bedder transactions at an average price of $2.61 million; but it is worth noting that the average unit size was skewed slightly upward to 819 sq ft, due to the sale of a single, special-case 1,012 sq ft unit. Most other transactions were “true” two-bedders, closer to the 710 sq ft range.
Compared to developments like 19 Nassim, Grange 1866 maintains the lowest average $PSF and lowest overall quantum among new launches in the district. This, combined with its freehold status and prime location, may explain why transaction volume jumped from one unit in 2022 to 18 in 2023, followed by a healthy 10 units in 2024.
Since its launch in 2021, prices rose by 22 per cent, but it still offers relatively accessible entry (in the context of pricey District 10, that is.)
Jervois Prive
| Year | Average price | Average $PSF | Smallest unit size | Largest unit size | Average unit size | No. of units sold |
| 2022 | $2,095,000 | $2,720 | 732 | 807 | 770 | 2 |
| 2023 | $2,134,657 | $2,961 | 689 | 807 | 721 | 6 |
| 2024 | $2,133,000 | $3,002 | 710 | 710 | 710 | 1 |
Jervois Prive’s two-bedders have seen relatively low transaction volume since launch, with the highest number of units sold in a single year being just six in 2023. In 2024, only one two-bedder was transacted.
Since its launch in 2022, average prices edged up only slightly, from $2.095 million to $2.133 million in 2024. The average $PSF has risen from $2,720 to $3,002, though this may be influenced by the smaller unit sold in 2024 (710 sq ft). This is unsurprising, as a developer would hesitate to hike prices further, when units are already slow to move.
Perfect Ten
| Year | Average price | Average $PSF | Smallest unit size | Largest unit size | Average unit size | No. of units sold |
| 2021 | $2,516,046 | $3,307 | 753 | 786 | 761 | 7 |
| 2022 | $2,279,031 | $2,931 | 753 | 797 | 778 | 91 |
| 2023 | $2,561,064 | $3,279 | 753 | 797 | 781 | 36 |
| 2024 | $2,736,070 | $3,494 | 753 | 797 | 783 | 4 |
Perfect Ten was fully sold out by late May 2024. After launching in 2021 at an average price of $2.52 million, the developer appears to have lowered prices in 2022, bringing the average down to $2.28 million.
While this likely irritated early buyers, it did trigger a surge in sales, with 91 two-bedders transacted that year. This was followed by 36 transactions in 2023, and just four in 2024 as the project neared sellout.
By 2024, the average price had climbed to $2.74 million, representing a total increase of nearly nine per cent from the initial 2021 launch price. The unit sizes remained consistent throughout the sales period, ranging from 753 to 797 sq ft, with a steady $PSF increase from $2,931 in 2022 to $3,494 in 2024.
Wilshire Residences
| Year | Average price | Average $PSF | Smallest unit size | Largest unit size | Average unit size | No. of units sold |
| 2019 | $2,064,100 | $2,569 | 764 | 893 | 807 | 3 |
| 2020 | $1,958,040 | $2,636 | 743 | 743 | 743 | 1 |
| 2021 | $1,805,007 | $2,469 | 646 | 980 | 733 | 17 |
| 2022 | $1,942,000 | $2,694 | 646 | 797 | 720 | 15 |
| 2023 | $2,087,563 | $2,752 | 743 | 797 | 759 | 17 |
| 2024 | $2,055,000 | $2,727 | 753 | 753 | 753 | 1 |
Wilshire Residences was fully sold out by January 2024, helped by the fact that in 2021, the developer reduced prices. At the time, the average was down to $1.81 million, from a previous average of $2.06 million in 2019. This move paid off, leading to a strong pickup in sales: 17 units sold in 2021, followed by 15 in 2022 and another 17 in 2023.
The unit sizes ranged from 646 to 980 sq ft, with most transactions between 743 and 797 sq ft in the later years. By 2023, the average $PSF had risen to $2,752, up from $2,469 in 2021.
We can see from the data that by 2024, these new launches were either at the tail end of their sales cycle, or had already been on the market for several years. As a result, many of the units transacted reflect later-phase pricing, which tends to be higher due to gradual upward revisions by developers over time. This means the 2024 new sale prices may not represent “early bird” rates, but rather the premium end of the project’s pricing curve.
Now, let’s look at the sub sale and resale transactions recorded in 2024, so we can make some comparisons
Subsale and resale projects sold
| Project | Tenure | Built | Avg Price | Avg $PSF | Size (From) | Size (To) |
| ROBIN SUITES | freehold | 2016 | $1,200,000 | $2,230 | 538 | 538 |
| TANGLIN REGENCY | 99y | 1998 | $1,367,500 | $1,688 | 700 | 850 |
| LOFT@HOLLAND | freehold | 2014 | $1,388,000 | $1,417 | 980 | 980 |
| THE SIENA | 99y | 2016 | $1,400,000 | $1,758 | 797 | 797 |
| LOFT @ NATHAN | freehold | 2014 | $1,425,000 | $1,394 | 1023 | 1023 |
| STELLAR RV | freehold | 2015 | $1,520,000 | $1,810 | 840 | 840 |
| M5 | freehold | 2018 | $1,522,100 | $2,032 | 743 | 753 |
| THE ASANA | freehold | 2017 | $1,522,472 | $2,472 | 506 | 678 |
| NATHAN RESIDENCES | freehold | 2013 | $1,560,000 | $2,013 | 775 | 775 |
| URBAN EDGE @ HOLLAND V | freehold | 2007 | $1,585,000 | $1,888 | 840 | 840 |
| THE LEGACY | freehold | 1999 | $1,600,000 | $2,094 | 764 | 764 |
| RV RESIDENCES | freehold | 2015 | $1,646,000 | $2,390 | 678 | 700 |
| JUNIPER HILL | freehold | 2022 | $1,650,000 | $2,787 | 592 | 592 |
| LEEDON 2 | freehold | 1996 | $1,668,000 | $2,183 | 764 | 764 |
| VIZ AT HOLLAND | freehold | 2008 | $1,681,222 | $1,977 | 818 | 861 |
| THE COTERIE @ HOLLAND | freehold | 2014 | $1,710,000 | $2,176 | 786 | 786 |
| FOURTH AVENUE RESIDENCES | 99y | 2022 | $1,714,000 | $2,530 | 646 | 710 |
| 120 GRANGE | freehold | 2023 | $1,716,722 | $2,875 | 570 | 678 |
| DE LENTE | freehold | 2002 | $1,720,000 | $1,997 | 861 | 861 |
| THE SIERRA | freehold | 1998 | $1,730,000 | $1,766 | 980 | 980 |
| MON JERVOIS | 99y | 2016 | $1,740,000 | $1,738 | 1001 | 1001 |
| KELLOCK LODGE | freehold | 1997 | $1,754,000 | $1,964 | 893 | 893 |
| ZENITH | freehold | 2011 | $1,770,000 | $2,383 | 743 | 743 |
| DYNASTY GARDEN | freehold | 1979 | $1,780,000 | $1,560 | 1141 | 1141 |
| THE PRINCETON | freehold | 1999 | $1,800,000 | $2,090 | 861 | 861 |
| SPRING GROVE | 99y | 1996 | $1,808,750 | $1,788 | 1012 | 1012 |
| DUCHESS CREST | 99y | 1998 | $1,810,000 | $1,792 | 936 | 1087 |
| HYLL ON HOLLAND | freehold | 2024 | $1,820,000 | $2,601 | 700 | 700 |
| ALLSWORTH PARK | freehold | 1985 | $1,840,000 | $1,781 | 1033 | 1033 |
| D’LEEDON | 99y | 2014 | $1,857,063 | $1,963 | 786 | 1076 |
| ROBIN RESIDENCES | freehold | 2015 | $1,864,333 | $2,403 | 538 | 958 |
| JEWEL OF BALMORAL | freehold | 2000 | $1,880,000 | $2,268 | 829 | 829 |
| SIXTH AVENUE CENTRE | freehold | 1986 | $1,935,000 | $1,649 | 1173 | 1173 |
| LEEDON GREEN | freehold | 2023 | $1,938,841 | $2,785 | 614 | 818 |
| STUDIO 3 | freehold | 2005 | $1,940,000 | $1,716 | 883 | 1485 |
| ONE DUCHESS | freehold | 2017 | $1,960,000 | $2,529 | 775 | 775 |
| CHATELET | freehold | 1993 | $2,000,000 | $2,088 | 958 | 958 |
| THE CAPRI | freehold | 1998 | $2,033,000 | $1,988 | 1023 | 1023 |
| THE MERASAGA | 99y | 1995 | $2,050,000 | $2,140 | 958 | 958 |
| THE LEVELZ | freehold | 2004 | $2,069,000 | $2,102 | 980 | 990 |
| HOLLAND PEAK | freehold | 1994 | $2,080,000 | $1,952 | 1066 | 1066 |
| BALMORAL HEIGHTS | freehold | 2004 | $2,088,000 | $2,256 | 926 | 926 |
| JERVOIS TREASURES | freehold | 2023 | $2,108,279 | $2,639 | 721 | 893 |
| MILL POINT | freehold | 2004 | $2,110,000 | $2,280 | 926 | 926 |
| THE LOFT | 99y | 2002 | $2,130,000 | $1,921 | 1109 | 1109 |
| ROBIN REGALIA | freehold | 2000 | $2,140,000 | $2,029 | 1055 | 1055 |
| HOLLAND RESIDENCES | freehold | 2012 | $2,149,000 | $2,206 | 969 | 980 |
| THE ASTON | freehold | 2002 | $2,175,000 | $1,962 | 1109 | 1109 |
| ROYALGREEN | freehold | 2021 | $2,182,500 | $2,737 | 775 | 818 |
| PALM SPRING | freehold | 1997 | $2,190,000 | $2,312 | 947 | 947 |
| HALLMARK RESIDENCES | freehold | 2015 | $2,228,000 | $2,300 | 969 | 969 |
| THE TRIZON | freehold | 2012 | $2,229,333 | $2,180 | 1012 | 1044 |
| ONE JERVOIS | freehold | 2009 | $2,237,667 | $2,192 | 990 | 1087 |
| BALMORAL CREST | freehold | 2002 | $2,265,000 | $1,977 | 1098 | 1195 |
| SIGNATURE AT LEWIS | freehold | 2011 | $2,290,000 | $2,338 | 980 | 980 |
| THE TESSARINA | freehold | 2003 | $2,300,000 | $2,297 | 990 | 1012 |
| CORONATION GROVE | freehold | 1985 | $2,320,000 | $1,858 | 1249 | 1249 |
| ST MARTIN’S APARTMENT | freehold | 1986 | $2,328,000 | $2,100 | 1109 | 1109 |
| THE SIXTH AVENUE RESIDENCES | freehold | 2009 | $2,350,000 | $2,102 | 969 | 1302 |
| SOMMERVILLE PARK | freehold | 1985 | $2,350,000 | $2,205 | 1066 | 1066 |
| NATHAN SUITES | freehold | 2014 | $2,362,500 | $2,582 | 915 | 915 |
| GLENTREES | freehold | 2005 | $2,385,000 | $1,773 | 1346 | 1346 |
| CLUNY PARK RESIDENCE | freehold | 2016 | $2,410,000 | $2,870 | 840 | 840 |
| THE MARBELLA | freehold | 2005 | $2,433,000 | $2,261 | 1076 | 1076 |
| GOODWOOD GRAND | freehold | 2017 | $2,480,000 | $2,776 | 893 | 893 |
| MONTVIEW | freehold | 2008 | $2,485,000 | $2,025 | 1227 | 1227 |
| ONE DRAYCOTT | freehold | 2023 | $2,523,348 | $3,172 | 732 | 1346 |
| SPANISH VILLAGE | freehold | 1987 | $2,530,000 | $2,104 | 1163 | 1249 |
| TANGLIN PARK | freehold | 1989 | $2,575,000 | $2,396 | 1033 | 1119 |
| THE HERMITAGE | freehold | 1999 | $2,580,000 | $1,322 | 1862 | 2067 |
| THE LEGEND | freehold | 1996 | $2,592,481 | $1,789 | 1421 | 1496 |
| CYAN | freehold | 2014 | $2,602,978 | $2,612 | 980 | 1023 |
| ONE BALMORAL | freehold | 2016 | $2,604,767 | $2,689 | 969 | 969 |
| VALLEY PARK | freehold | 1997 | $2,631,250 | $2,148 | 1109 | 1356 |
| BELMOND GREEN | freehold | 2004 | $2,638,000 | $2,723 | 969 | 969 |
| CUSCADEN RESERVE | 99y | 2023 | $2,709,117 | $3,039 | 807 | 2099 |
| GALLOP GABLES | freehold | 1997 | $2,715,000 | $2,016 | 1163 | 1550 |
| WARNER COURT | freehold | 1985 | $2,800,000 | $2,204 | 1270 | 1270 |
| LEEDON RESIDENCE | freehold | 2015 | $2,813,333 | $2,695 | 1044 | 1044 |
| BALMORAL GATE | freehold | 1994 | $2,850,000 | $2,253 | 1259 | 1270 |
| GOODWOOD RESIDENCE | freehold | 2013 | $2,900,000 | $2,591 | 1119 | 1119 |
| FIFTH AVENUE CONDOMINIUM | freehold | 1998 | $2,900,000 | $2,089 | 1389 | 1389 |
| ASTRID MEADOWS | freehold | 1990 | $2,960,000 | $1,752 | 1690 | 1690 |
| CUSCADEN RESIDENCES | freehold | 2002 | $3,572,857 | $2,491 | 1238 | 1485 |
| GRAMERCY PARK | freehold | 2016 | $3,630,000 | $2,858 | 1270 | 1270 |
| CHELSEA GARDENS | freehold | 2000 | $3,988,000 | $1,871 | 2131 | 2131 |
| BOULEVARD 88 | freehold | 2023 | $5,019,900 | $3,823 | 1313 | 1313 |
| GALLOP GREEN | freehold | 2002 | $8,580,000 | $2,622 | 3272 | 3272 |
What stands out here is the sheer number of units transacting under $2 million in District 10. Note that none of the new launches managed to stay below this amount in the same year: projects like Loft @ Nathan, Tanglin Regency, and RV Residences all saw two-bedroom units sold well below this mark, despite offering a higher average square footage than their new launch counterparts.
In fact, many resale units are substantially larger. Units above 1,000 sq ft were not uncommon, with several resale condos – Dynasty Garden, The Princeton, and Spring Grove, to name a few – providing generous layouts that would be nearly unheard of in new launches at similar price points.
If we take the average price of new launch two-bedders in 2024 (excluding Boulevard 88 again ) – which stands at around $2.55 million – a buyer would have had access to around three-quarters of the resale / sub sale options on the list.
Another notable trend is transaction volume.
Many resale developments recorded only one or two sales in 2024. This is part of an ongoing trend that still affects us in 2025 (this is due to sellers being unwilling to accept the price of a replacement property, should they sell – we cover it in some detail here.) In addition, the freehold nature of these properties may contribute: owners tend to buy for long-term hold, which reduces supply in the resale market. In contrast, 99-year leasehold condos like Fourth Avenue Residences or D’Leedon typically see higher turnover, making them more active in the secondary market.
So while the headline average price gap between new and resale two-bedders appears wide, a deeper look suggests that the real difference may not be as dramatic. For the same or lower budget, resale buyers are often getting significantly more in real terms, especially when you factor in space, tenure, and unit scarcity.
Now let’s look at the price jump between one and two-bedder units
New sales
| Year | 1-bedroom | 2-bedroom | Price gap | % Difference |
| 2014 | $999,329 | $1,824,053 | -$824,724 | -45.21% |
| 2015 | $1,134,617 | $1,692,409 | -$557,793 | -32.96% |
| 2016 | $1,110,802 | $2,317,678 | -$1,206,876 | -52.07% |
| 2017 | $1,023,144 | $1,764,244 | -$741,100 | -42.01% |
| 2018 | $1,345,439 | $1,994,884 | -$649,445 | -32.56% |
| 2019 | $1,387,190 | $2,303,165 | -$915,975 | -39.77% |
| 2020 | $1,219,106 | $1,927,988 | -$708,882 | -36.77% |
| 2021 | $1,309,836 | $1,956,093 | -$646,257 | -33.04% |
| 2022 | $1,440,222 | $2,159,308 | -$719,086 | -33.30% |
| 2023 | $1,587,683 | $2,397,031 | -$809,348 | -33.76% |
| 2024 | $1,876,659 | $3,088,110 | -$1,211,451 | -39.23% |
Subsale/resale
| Year | 1-bedroom | 2-bedroom | Price gap | % Difference |
| 2014 | $1,185,070 | $1,768,360 | -$583,290 | -32.98% |
| 2015 | $1,108,192 | $1,723,992 | -$615,800 | -35.72% |
| 2016 | $1,069,442 | $1,709,908 | -$640,466 | -37.46% |
| 2017 | $1,093,366 | $1,892,367 | -$799,001 | -42.22% |
| 2018 | $1,090,891 | $1,864,874 | -$773,983 | -41.50% |
| 2019 | $1,034,642 | $1,926,608 | -$891,966 | -46.30% |
| 2020 | $1,268,900 | $1,879,980 | -$611,080 | -32.50% |
| 2021 | $1,142,347 | $1,986,262 | -$843,916 | -42.49% |
| 2022 | $1,188,482 | $1,985,024 | -$796,542 | -40.13% |
| 2023 | $1,224,601 | $2,084,782 | -$860,181 | -41.26% |
| 2024 | $1,331,059 | $2,400,959 | -$1,069,900 | -44.56% |
Price gap
| Year | Between new 1-bedder and new 2-bedder | Between new 1-bedder and resale 2-bedder | Between resale 1-bedder and resale 2-bedder |
| 2014 | -$824,724 | -$769,030 | -$583,290 |
| 2015 | -$557,793 | -$589,376 | -$615,800 |
| 2016 | -$1,206,876 | -$599,107 | -$640,466 |
| 2017 | -$741,100 | -$869,222 | -$799,001 |
| 2018 | -$649,445 | -$519,435 | -$773,983 |
| 2019 | -$915,975 | -$539,419 | -$891,966 |
| 2020 | -$708,882 | -$660,874 | -$611,080 |
| 2021 | -$646,257 | -$676,426 | -$843,916 |
| 2022 | -$719,086 | -$544,802 | -$796,542 |
| 2023 | -$809,348 | -$497,099 | -$860,181 |
| 2024 | -$1,211,451 | -$524,301 | -$1,069,900 |
In general, the price gap between one and two-bedroom units, both new and resale, have been widening.
For new sales, the average price difference between a one-bedder and a two-bedder was around $708,000 in 2020. By 2024, that gap had grown to over $1.21 million, representing a 39.2 per cent increase.
Resale properties followed a similar trajectory, with the price gap growing from $611,000 in 2020 to over $1.07 million in 2024.
This widening gap has made it increasingly difficult for buyers to stretch from a one-bedder to a two-bedder, especially in the new sale market.
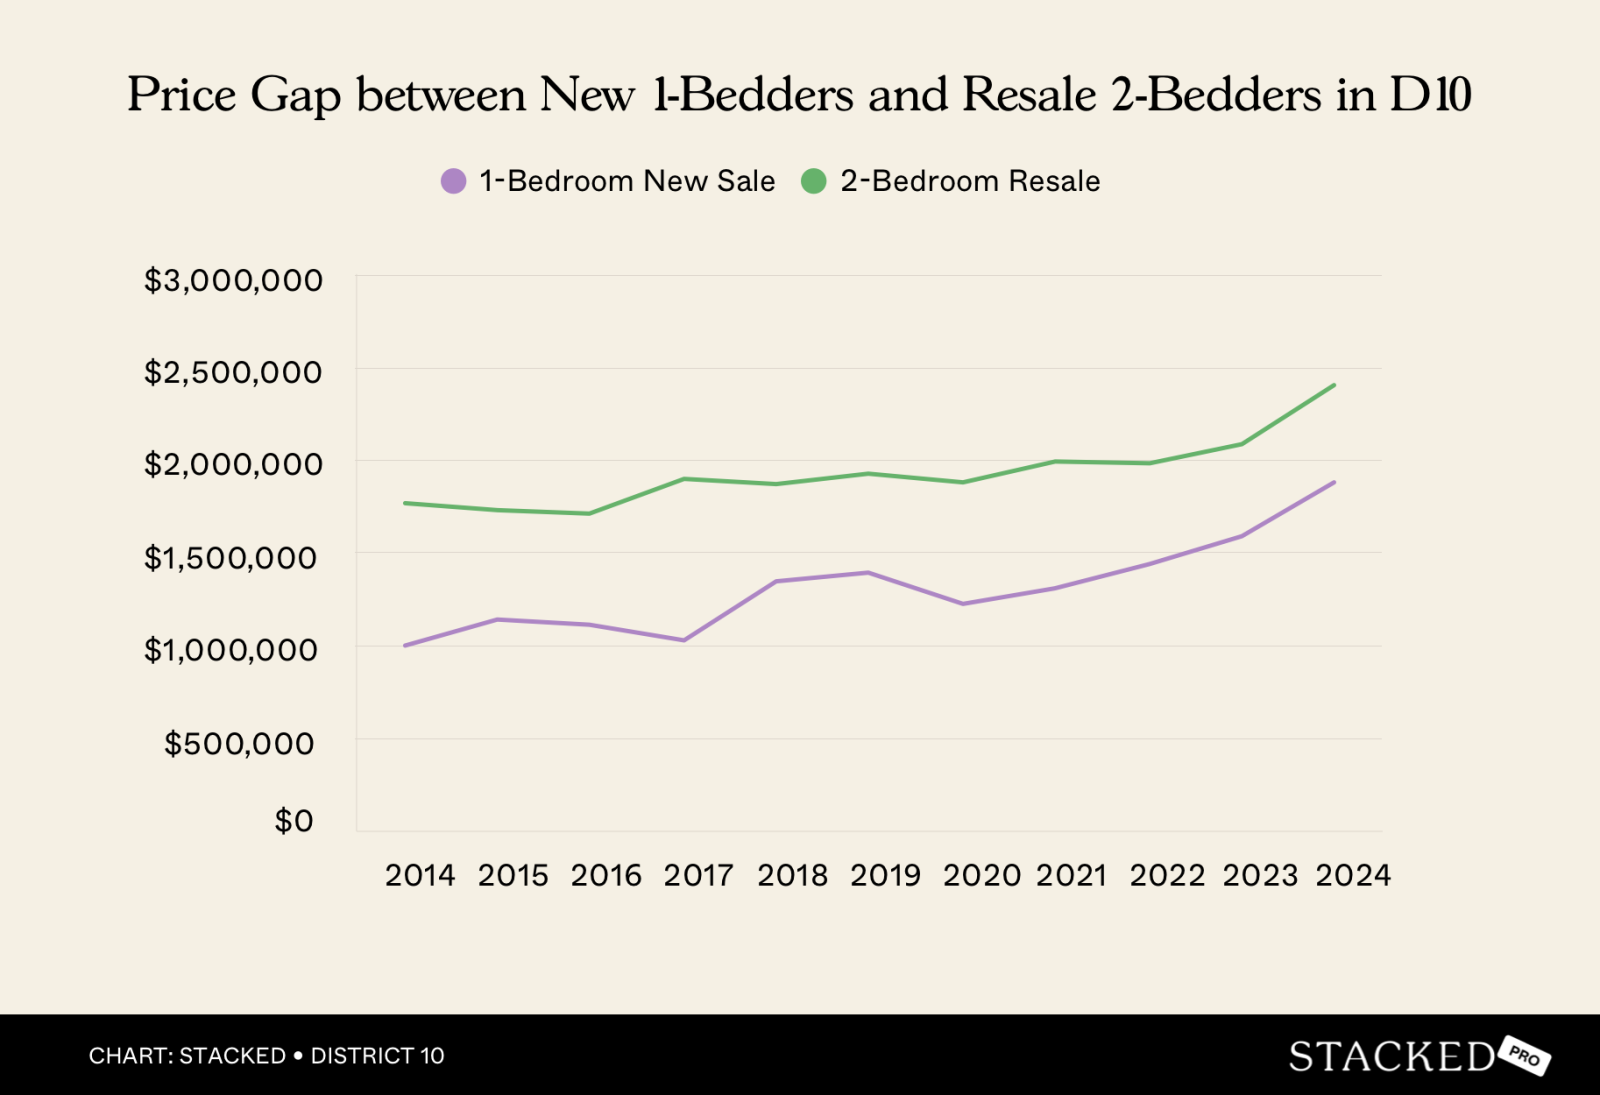
What about a new one-bedder versus a resale two-bedder?
The price gap has narrowed, but not by a significant amount. In 2016, the difference was around $599,000. By 2024, it had fallen to just over $524,000. Unfortunately, this won’t be narrow enough for many buyers to make the leap: with a budget of around $1.88 million (the average price of a new one-bedder in 2024), you can still fall short of a resale two-bedder in many D10 developments.
But not all. As we’ll explore next, there are still options within that budget range.
New 1-bedders sold in 2024
| Project | Tenure | Avg Price | Avg $PSF | Smallest Unit Size | Largest Unit Size | Avg Unit Size | No. of Units Sold |
| 19 NASSIM | 99-year | $2,073,311 | $3,169 | 570 | 678 | 655 | 9 |
| GRANGE 1866 | Freehold | $1,666,500 | $3,160 | 527 | 527 | 527 | 2 |
| LEEDON GREEN | Freehold | $1,670,080 | $3,103 | 538 | 538 | 538 | 5 |
| PARKSUITES | 110-year | $1,560,000 | $2,454 | 635 | 635 | 635 | 1 |
19 Nassim, Grange 1866, Leedon Green, and ParkSuites all had one-bedder transactions. Note that they originally launched between 2018 and 2021, so by 2024 they were in later sales phases and hence pricier.
Based on those prices, which resale two-bedders could you buy instead?
| Project | Tenure | Built | Avg Price | Avg $PSF | Size (From) | Size (To) |
| ROBIN SUITES | freehold | 2016 | $1,200,000 | $2,230 | 538 | 538 |
| TANGLIN REGENCY | 99y | 1998 | $1,367,500 | $1,688 | 700 | 850 |
| LOFT@HOLLAND | freehold | 2014 | $1,388,000 | $1,417 | 980 | 980 |
| THE SIENA | 99y | 2016 | $1,400,000 | $1,758 | 797 | 797 |
| LOFT @ NATHAN | freehold | 2014 | $1,425,000 | $1,394 | 1023 | 1023 |
| STELLAR RV | freehold | 2015 | $1,520,000 | $1,810 | 840 | 840 |
| M5 | freehold | 2018 | $1,522,100 | $2,032 | 743 | 753 |
| THE ASANA | freehold | 2017 | $1,522,472 | $2,472 | 506 | 678 |
| NATHAN RESIDENCES | freehold | 2013 | $1,560,000 | $2,013 | 775 | 775 |
| URBAN EDGE @ HOLLAND V | freehold | 2007 | $1,585,000 | $1,888 | 840 | 840 |
| THE LEGACY | freehold | 1999 | $1,600,000 | $2,094 | 764 | 764 |
| RV RESIDENCES | freehold | 2015 | $1,646,000 | $2,390 | 678 | 700 |
| JUNIPER HILL | freehold | 2022 | $1,650,000 | $2,787 | 592 | 592 |
| LEEDON 2 | freehold | 1996 | $1,668,000 | $2,183 | 764 | 764 |
| VIZ AT HOLLAND | freehold | 2008 | $1,681,222 | $1,977 | 818 | 861 |
| THE COTERIE @ HOLLAND | freehold | 2014 | $1,710,000 | $2,176 | 786 | 786 |
| FOURTH AVENUE RESIDENCES | 99y | 2022 | $1,714,000 | $2,530 | 646 | 710 |
| 120 GRANGE | freehold | 2023 | $1,716,722 | $2,875 | 570 | 678 |
| DE LENTE | freehold | 2002 | $1,720,000 | $1,997 | 861 | 861 |
| THE SIERRA | freehold | 1998 | $1,730,000 | $1,766 | 980 | 980 |
| MON JERVOIS | 99y | 2016 | $1,740,000 | $1,738 | 1001 | 1001 |
| KELLOCK LODGE | freehold | 1997 | $1,754,000 | $1,964 | 893 | 893 |
| ZENITH | freehold | 2011 | $1,770,000 | $2,383 | 743 | 743 |
| DYNASTY GARDEN | freehold | 1979 | $1,780,000 | $1,560 | 1141 | 1141 |
| THE PRINCETON | freehold | 1999 | $1,800,000 | $2,090 | 861 | 861 |
| SPRING GROVE | 99y | 1996 | $1,808,750 | $1,788 | 1012 | 1012 |
| DUCHESS CREST | 99y | 1998 | $1,810,000 | $1,792 | 936 | 1087 |
| HYLL ON HOLLAND | freehold | 2024 | $1,820,000 | $2,601 | 700 | 700 |
| ALLSWORTH PARK | freehold | 1985 | $1,840,000 | $1,781 | 1033 | 1033 |
| D’LEEDON | 99y | 2014 | $1,857,063 | $1,963 | 786 | 1076 |
| ROBIN RESIDENCES | freehold | 2015 | $1,864,333 | $2,403 | 538 | 958 |
| JEWEL OF BALMORAL | freehold | 2000 | $1,880,000 | $2,268 | 829 | 829 |
Based on 2024’s average price for a new one-bedder ($1.88 million), a buyer might, instead, be able to afford a two-bedder in the 32 projects listed above. It’s definitely a strong consideration, as many of these projects come with larger unit sizes. For example:
- Dynasty Garden had a two-bedder transacted at $1.78 million with a size of 1,141 sq ft.
- Loft @ Nathan saw two units at 1,023 sq ft for just $1.43 million.
- Even Spring Grove and Duchess Crest, both 99-year leasehold projects in prime locations, had large-format two-bedders around the $1.8 million mark.
These are all cheaper than the average new-launch one-bedder!
Next, let’s look at price jump between three and four-bedders in District 10
New sales
| Year | 3-bedroom | 4-bedroom | Price gap | % Difference |
| 2014 | $3,093,491 | $5,083,514 | -$1,990,023 | -39.15% |
| 2015 | $3,104,616 | $5,207,919 | -$2,103,303 | -40.39% |
| 2016 | $3,820,145 | $5,589,746 | -$1,769,601 | -31.66% |
| 2017 | $2,618,715 | $2,100,000 | $518,715 | 24.70% |
| 2018 | $4,644,667 | $6,844,708 | -$2,200,041 | -32.14% |
| 2019 | $3,650,447 | $9,558,585 | -$5,908,138 | -61.81% |
| 2020 | $3,200,770 | $6,141,833 | -$2,941,063 | -47.89% |
| 2021 | $3,486,877 | $6,407,339 | -$2,920,463 | -45.58% |
| 2022 | $3,473,108 | $5,454,174 | -$1,981,066 | -36.32% |
| 2023 | $3,575,457 | $6,346,039 | -$2,770,582 | -43.66% |
| 2024 | $5,382,816 | $7,500,000 | -$2,117,184 | -28.23% |
Subsale/resale
| Year | 3-bedroom | 4-bedroom | Price gap | % Difference |
| 2014 | $2,639,790 | $4,787,225 | -$2,147,435 | -44.86% |
| 2015 | $2,789,248 | $5,499,264 | -$2,710,017 | -49.28% |
| 2016 | $3,199,999 | $4,889,794 | -$1,689,795 | -34.56% |
| 2017 | $3,158,999 | $5,293,591 | -$2,134,592 | -40.32% |
| 2018 | $3,443,114 | $5,734,297 | -$2,291,183 | -39.96% |
| 2019 | $3,136,104 | $7,511,167 | -$4,375,063 | -58.25% |
| 2020 | $2,898,307 | $6,159,016 | -$3,260,709 | -52.94% |
| 2021 | $3,238,242 | $6,285,897 | -$3,047,655 | -48.48% |
| 2022 | $3,686,557 | $6,618,361 | -$2,931,804 | -44.30% |
| 2023 | $3,480,403 | $6,859,774 | -$3,379,371 | -49.26% |
| 2024 | $3,429,285 | $5,700,548 | -$2,271,263 | -39.84% |
Price gap
| Year | Between new 3-bedder and new 4-bedder | Between new 3-bedder and resale 4-bedder | Between resale 3-bedder and resale 4-bedder |
| 2014 | -$1,990,023 | -$1,693,734 | -$2,147,435 |
| 2015 | -$2,103,303 | -$2,394,648 | -$2,710,017 |
| 2016 | -$1,769,601 | -$1,069,649 | -$1,689,795 |
| 2017 | $518,715 | -$2,674,876 | -$2,134,592 |
| 2018 | -$2,200,041 | -$1,089,631 | -$2,291,183 |
| 2019 | -$5,908,138 | -$3,860,719 | -$4,375,063 |
| 2020 | -$2,941,063 | -$2,958,246 | -$3,260,709 |
| 2021 | -$2,920,463 | -$2,799,020 | -$3,047,655 |
| 2022 | -$1,981,066 | -$3,145,253 | -$2,931,804 |
| 2023 | -$2,770,582 | -$3,284,317 | -$3,379,371 |
| 2024 | -$2,117,184 | -$317,733 | -$2,271,263 |
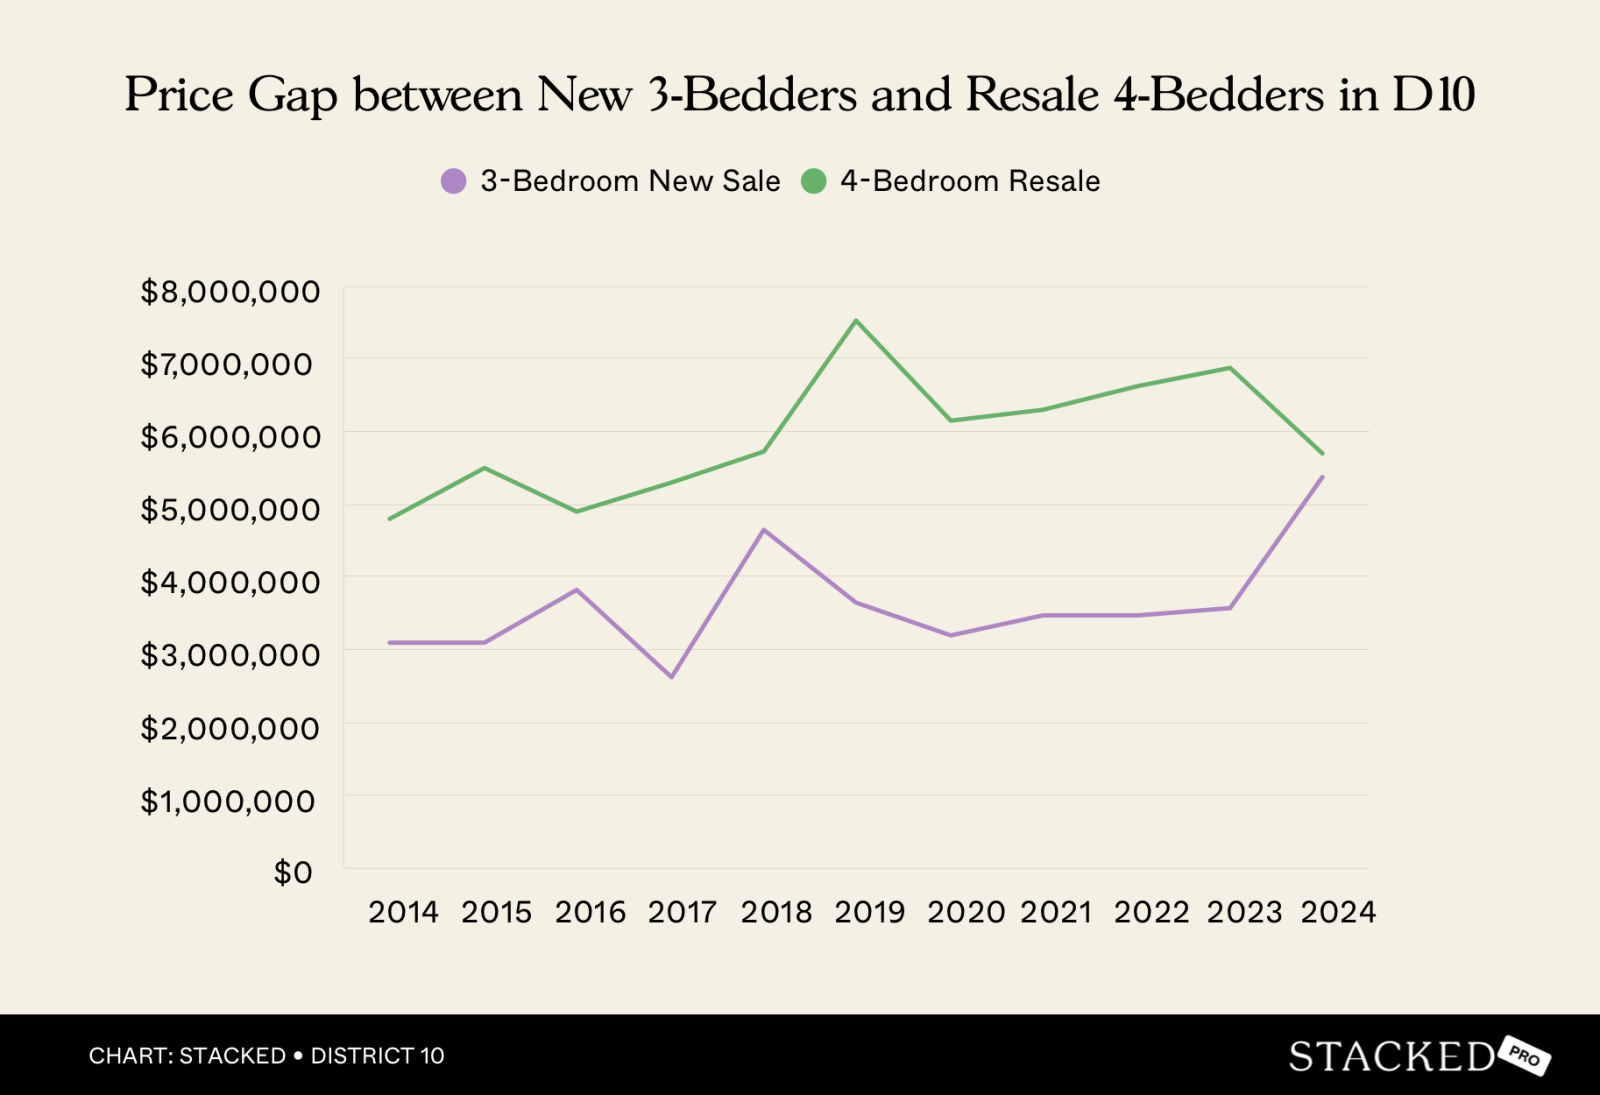
In 2024, the average price of new three-bedders stood at around $5.38 million, while new four-bedders averaged approximately $7.5 million; a price gap of about $2.12 million, or a 28.2 per cent difference.
Compared to previous years, this gap has narrowed slightly, suggesting that the escalation in four-bedder prices may be stabilising somewhat.
On the resale front, three-bedders averaged about $3.43 million in 2024, while four-bedders saw a much higher average of approximately $5.7 million. This represents a substantial $2.27 million gap (roughly 39.8 per cent).
However, the most interesting shift is in the narrowing gap between new three-bedder and four-bedder units, now just $317,733 apart. This is a sharp contrast from earlier years, when resale four-bedders could cost over $2 million(!) more than a three-bedder.
So in all, we’d say there’s a narrowing gap, which offers better value on a psf basis for the larger units.
Now let’s look at some new launch three-bedders, sold in 2024
New 3-bedders sold in 2024
| Project | Tenure | Avg price | Avg $PSF | Smallest Unit Size | Largest Unit Size | Avg unit Size | No. of units sold |
| 19 NASSIM | 99-year | $5,519,850 | $3,512 | 1410 | 1830 | 1577 | 13 |
| DALVEY HAUS | Freehold | $5,300,000 | $3,396 | 1561 | 1561 | 1561 | 1 |
| LEEDON GREEN | Freehold | $4,708,000 | $3,471 | 1356 | 1356 | 1356 | 1 |
| PERFECT TEN | Freehold | $4,359,000 | $3,403 | 1281 | 1281 | 1281 | 1 |
As of 2024, we see prices clustering in the $4.36 million to $5.52 million range. At the upper end, 19 Nassim – a 99-year leasehold project – saw 13 units sold at an average price of $5.52 million and an average size of 1,577 sq ft. This is a high average of $3,512 psf.
For Dalvey Haus, Leedon Green, and Perfect Ten, we are again forced to work with what we have: we need to be cautious of single transactions as they may reflect outliers, but this is an unavoidable issue for high-quantum, prime-region condos.
Nonetheless, the high psf figures across all these projects reflect a consistently strong premium for new launches in District 10.
Based on the lowest average price of new 3-bedders here ($4.359 million) let’s see what sub sale / resale four-bedders you could get instead:
| Project | Tenure | Built | Avg Price | Avg $PSF | Size (From) | Size (To) |
| HOLLANDSWOOD COURT | 99y | 1980 | $2,050,000 | $962 | 2131 | 2131 |
| JERVOIS LODGE | freehold | 1997 | $2,800,000 | $1,871 | 1496 | 1496 |
| THE SERENADE @ HOLLAND | 99y | 2004 | $2,875,000 | $1,509 | 1905 | 1905 |
| POLLEN & BLEU | 99y | 2016 | $2,897,500 | $1,917 | 1432 | 1593 |
| RV RESIDENCES | freehold | 2015 | $2,930,000 | $2,178 | 1346 | 1346 |
| STEVENS SUITES | freehold | 2013 | $3,088,888 | $1,568 | 1970 | 1970 |
| DUCHESS CREST | 99y | 1998 | $3,149,500 | $1,703 | 1722 | 2088 |
| QUINTERRA | 99y | 2009 | $3,150,000 | $1,763 | 1787 | 1787 |
| SPRING GROVE | 99y | 1996 | $3,245,000 | $1,816 | 1787 | 1787 |
| THE SIXTH AVENUE RESIDENCES | freehold | 2009 | $3,600,000 | $2,200 | 1636 | 1636 |
| PINEWOOD GARDENS | freehold | 1990 | $3,650,000 | $2,224 | 1636 | 1647 |
| THE MARBELLA | freehold | 2005 | $3,800,000 | $2,338 | 1625 | 1625 |
| LUSH ON HOLLAND HILL | freehold | 2012 | $3,850,000 | $2,079 | 1851 | 1851 |
| RIDGEWOOD | freehold | 1981 | $3,867,200 | $1,664 | 2002 | 3800 |
| ROBIN RESIDENCES | freehold | 2015 | $3,880,000 | $2,521 | 1539 | 1539 |
| HOLT RESIDENCES | freehold | 2000 | $3,940,000 | $1,916 | 2056 | 2056 |
| BELMOND GREEN | freehold | 2004 | $3,950,000 | $2,548 | 1550 | 1550 |
| D’LEEDON | 99y | 2014 | $3,975,282 | $1,905 | 1744 | 4155 |
| ROYALGREEN | freehold | 2021 | $3,980,000 | $2,780 | 1432 | 1432 |
| CASABELLA | freehold | 2005 | $4,000,000 | $1,299 | 3079 | 3079 |
| ORION | freehold | 2008 | $4,075,940 | $2,295 | 1776 | 1776 |
| ONE ROBIN | freehold | 2009 | $4,110,000 | $2,110 | 1948 | 1948 |
| ONE JERVOIS | freehold | 2009 | $4,158,888 | $1,756 | 2368 | 2368 |
| MANHATTAN MANSIONS | freehold | 1994 | $4,200,000 | $1,913 | 2196 | 2196 |
| VERDURE | freehold | 2012 | $4,200,000 | $1,832 | 2293 | 2293 |
| SEVEN HOLT ROAD | freehold | 2000 | $4,250,000 | $1,926 | 2207 | 2207 |
| GLENTREES | freehold | 2005 | $4,261,333 | $1,416 | 1701 | 3671 |
With our $4.359 million budget, you could potentially purchase a resale four-bedder in the 27 different projects above. Note that some are substantially larger than new launch three-bedders. For example, Glentrees saw transactions in 2024 averaging $4.26 million, with unit sizes reaching up to 3,671 sq ft.
Another standout is D’Leedon, where some units exceeded 4,000 sq ft, yet the average transaction price for four-bedders was just under $4 million. For buyers seeking more liveable space, these older developments are a dramatic upgrade in spaciousness.
Conclusion:
Property agents tend to assume buyers in District 10 are not price sensitive, so you seldom hear comparisons like the above (perhaps this may be one other contributing factor to the price gap!) But even if you have the capital, that’s not a reason to avoid cost efficiencies.
New launches in District 10 continue to command hefty premiums, with two-bedders averaging nearly $2.55 million in 2024; and the value proposition comes into question. Resale alternatives often offer larger floor areas, and in many cases lower overall quantum. For buyers willing to consider older freehold developments, the space-to-dollar ratio is significantly better, and the range of available units under $2 million is surprisingly broad for a prime district.
If you’re buying for lifestyle, prestige, or just future-proofing with a newer building, the premium may be justified. But if your goal is space, tenure, and overall value, then D10’s resale market might have more to offer. Follow us on Stacked Pro for more data-led analyses, resale case studies, and the latest condo breakdowns across Singapore’s key districts.