Higher-floor units almost always come with a price premium, but whether that premium is justified is less clear once you look at resale performance. While buyers often assume higher floors will hold or even grow their value, the data shows this isn’t consistently the case. In fact, there are projects where higher-floor units lag behind their lower-floor counterparts, particularly when ground-floor units offer strong alternatives.
In this analysis, we break down actual transactions across several developments to see where paying more for a higher floor hasn’t translated into stronger resale returns, and what this means for buyers weighing the trade-off.
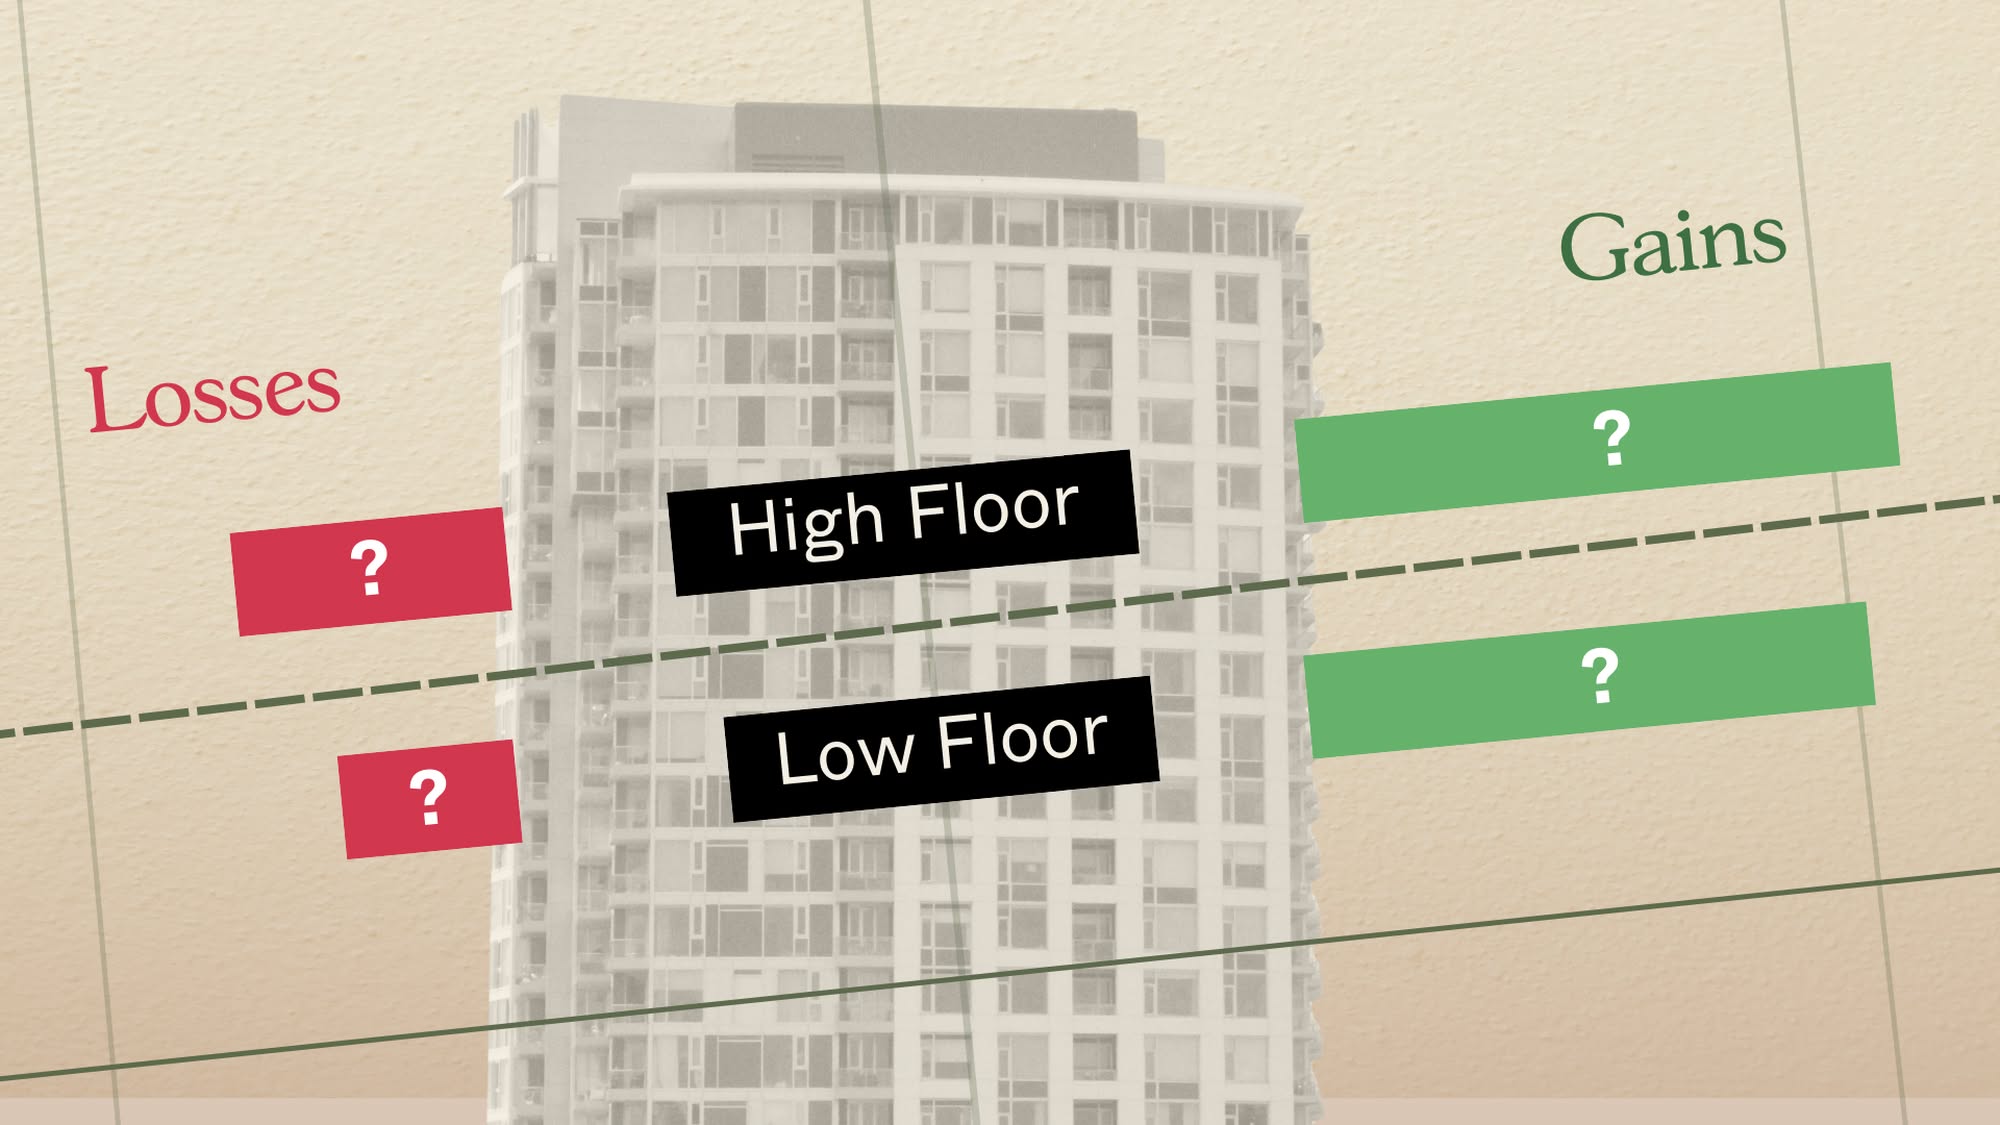
A quick explanation of low floor and higher floor units
For this analysis, transactions are grouped by floor level: units on the fifth floor and below are classified as low floor, while units on the 6th floor and above are classified as high floor. We considered transactions from 2014 through June 2025, including only developments with at least 10 transactions in both the low- and high-floor categories.
Let’s start with the basics: how profitable have low-floor units been compared to their higher-floor counterparts?
| Floor level | Gains | Losses | ||||||
| Average gains | Average ROI | Average holding period (Years) | Tnx volume | Average losses | Average ROI | Average holding period (Years) | Tnx volume | |
| High floor | $327,486 | 27.63% | 5.5 | 21107 | -$150,290 | -6.83% | 5.2 | 990 |
| Low floor | $308,381 | 27.12% | 5.5 | 11863 | -$98,407 | -6.48% | 5.3 | 679 |
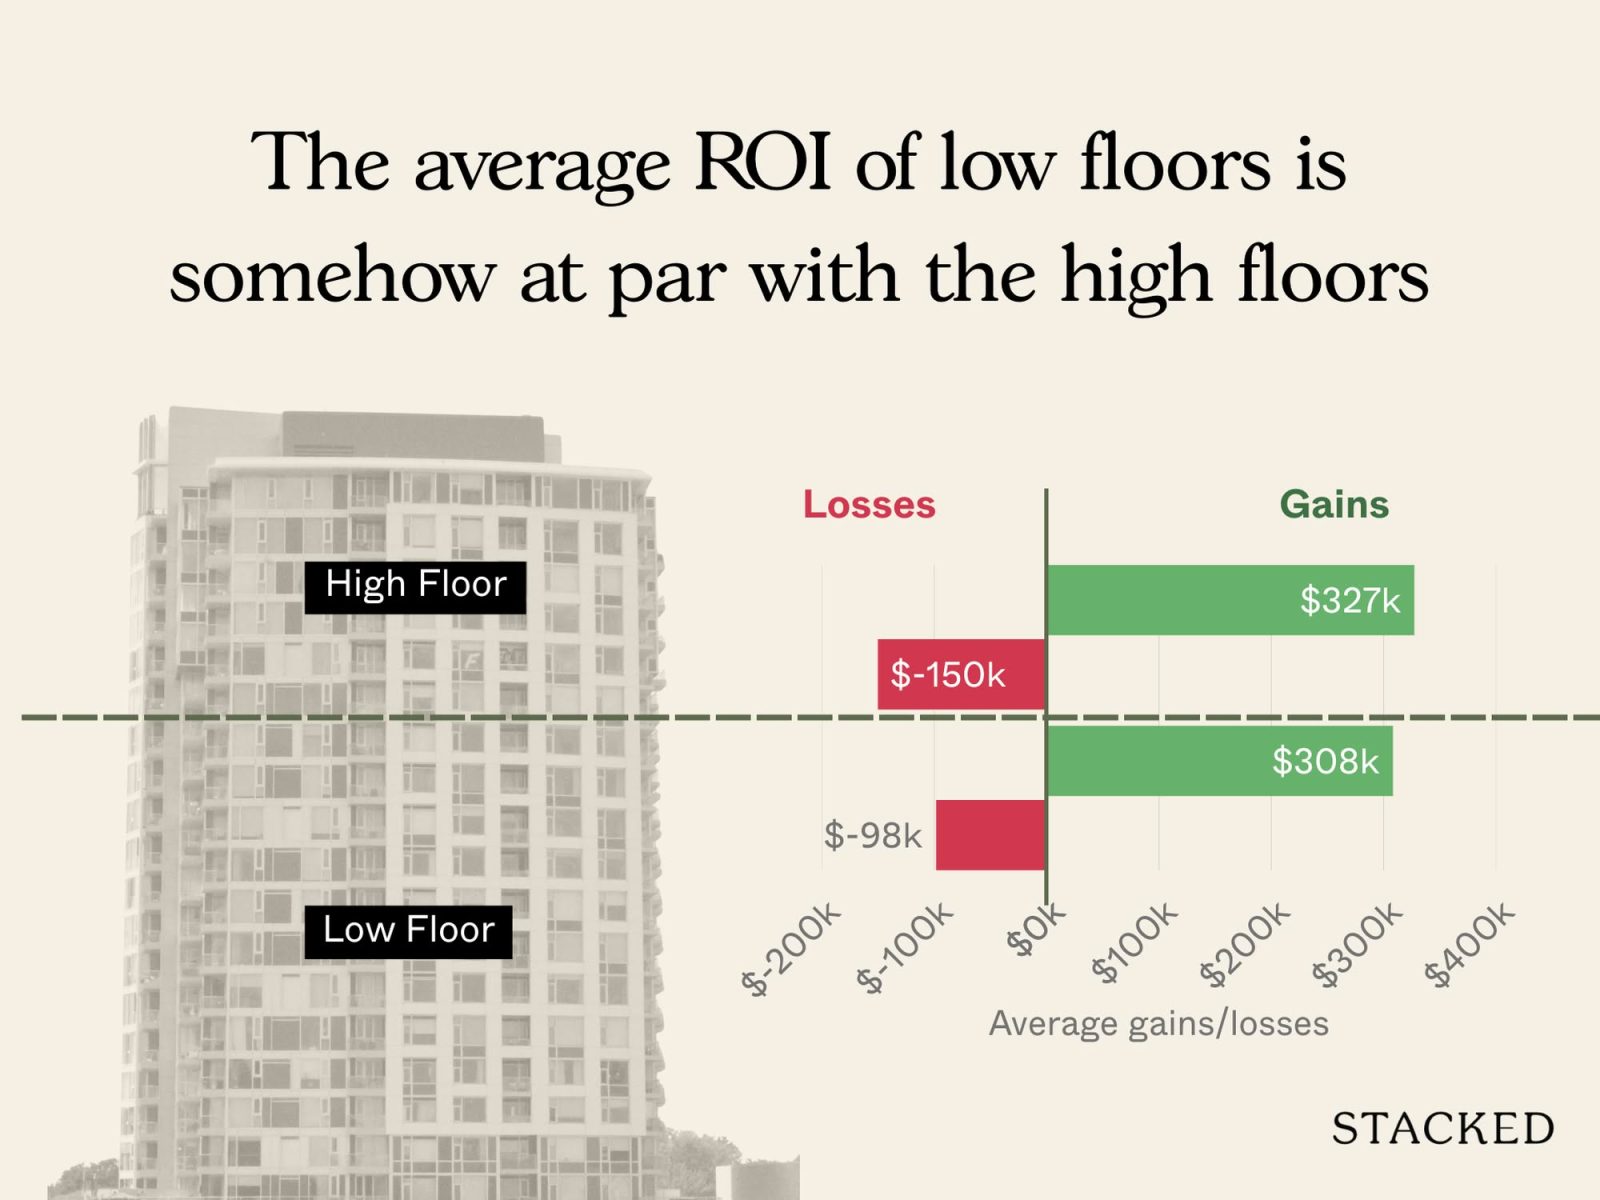
From here we can see that, on the whole, the ROI between the two are so close that the difference is negligible. But this is an overall snapshot that doesn’t tell us too much, and now we’re going to zoom in on the exceptions.
Let’s look at the ten projects where the gap between low- and higher-floor ROIs turned out to be the widest.
Gains
| Project | High floor | Low floor | Difference in ROI | ||||||||
| Average gains | Average ROI | Average sale price | Average holding period (Years) | Tnx volume | Average gains | Average ROI | Average sale price | Average holding period (Years) | Tnx volume | ||
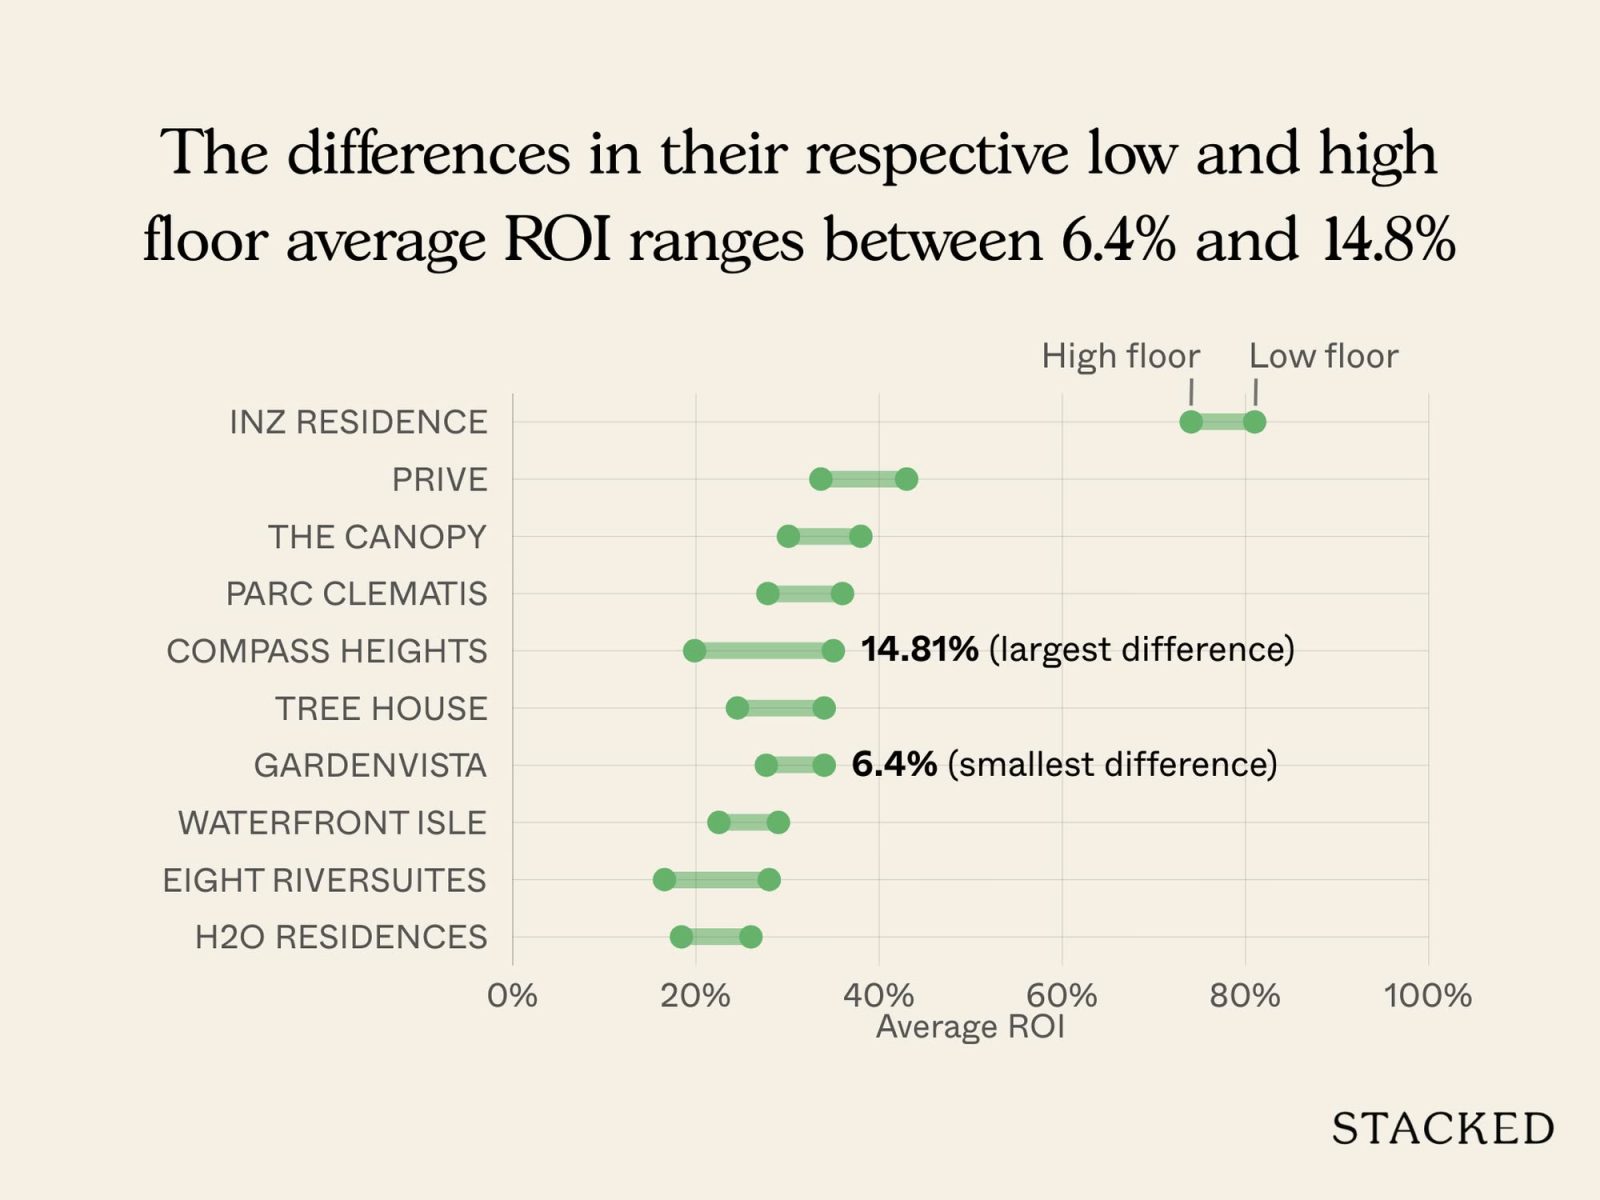
| COMPASS HEIGHTS | $214,941 | 19.86% | $1,332,824 | 5.2 | 17 | $384,907 | 34.67% | $1,484,491 | 4.7 | 12 | 14.81% |
| EIGHT RIVERSUITES | $197,886 | 16.57% | $1,380,015 | 6.1 | 135 | $337,926 | 27.69% | $1,523,659 | 5.9 | 15 | 11.13% |
| PRIVE | $346,106 | 33.64% | $1,358,210 | 4.1 | 46 | $439,566 | 43.49% | $1,425,995 | 4.5 | 21 | 9.85% |
| TREE HOUSE | $295,004 | 24.53% | $1,485,844 | 5.0 | 27 | $419,942 | 33.77% | $1,677,625 | 5.2 | 12 | 9.23% |
| THE CANOPY | $251,071 | 30.10% | $1,079,984 | 3.9 | 14 | $323,111 | 38.13% | $1,176,911 | 4.1 | 10 | 8.03% |
| PARC CLEMATIS | $375,325 | 27.85% | $1,696,362 | 4.0 | 213 | $443,436 | 35.58% | $1,711,407 | 4.2 | 52 | 7.73% |
| H2O RESIDENCES | $196,583 | 18.42% | $1,230,772 | 4.9 | 36 | $271,937 | 26.02% | $1,291,786 | 5.5 | 14 | 7.59% |
| INZ RESIDENCE | $611,160 | 74.07% | $1,434,650 | 7.1 | 81 | $643,525 | 80.93% | $1,442,062 | 7.3 | 27 | 6.86% |
| WATERFRONT ISLE | $219,901 | 22.51% | $1,176,751 | 5.9 | 35 | $297,899 | 28.92% | $1,302,353 | 5.7 | 11 | 6.41% |
| GARDENVISTA | $395,140 | 27.68% | $1,814,999 | 5.0 | 23 | $457,993 | 34.08% | $1,833,457 | 5.5 | 17 | 6.40% |
Losses
| Project | High floor | Low floor | Difference in ROI | ||||||||
| Average gains | Average ROI | Average sale price | Average holding period (Years) | Tnx volume | Average gains | Average ROI | Average sale price | Average holding period (Years) | Tnx volume | ||
| COMPASS HEIGHTS | -$130,000 | -11.50% | $1,000,000 | 0.8 | 1 | -$210,000 | -17.36% | $1,000,000 | 5.4 | 1 | -5.85% |
| EIGHT RIVERSUITES | -$92,600 | -5.83% | $1,276,000 | 5.9 | 5 | ||||||
| PRIVE | |||||||||||
| TREE HOUSE | -$141,000 | -9.70% | $1,354,000 | 4.0 | 2 | -$130,000 | -7.43% | $1,620,000 | 2.6 | 1 | 2.28% |
| THE CANOPY | |||||||||||
| PARC CLEMATIS | -$25,000 | -1.75% | $1,405,000 | 3.3 | 1 | ||||||
| H2O RESIDENCES | -$139,000 | -14.79% | $801,000 | 2.5 | 1 | ||||||
| INZ RESIDENCE | |||||||||||
| WATERFRONT ISLE | -$267,400 | -6.60% | $3,785,000 | 7.1 | 1 | ||||||
| GARDENVISTA | |||||||||||
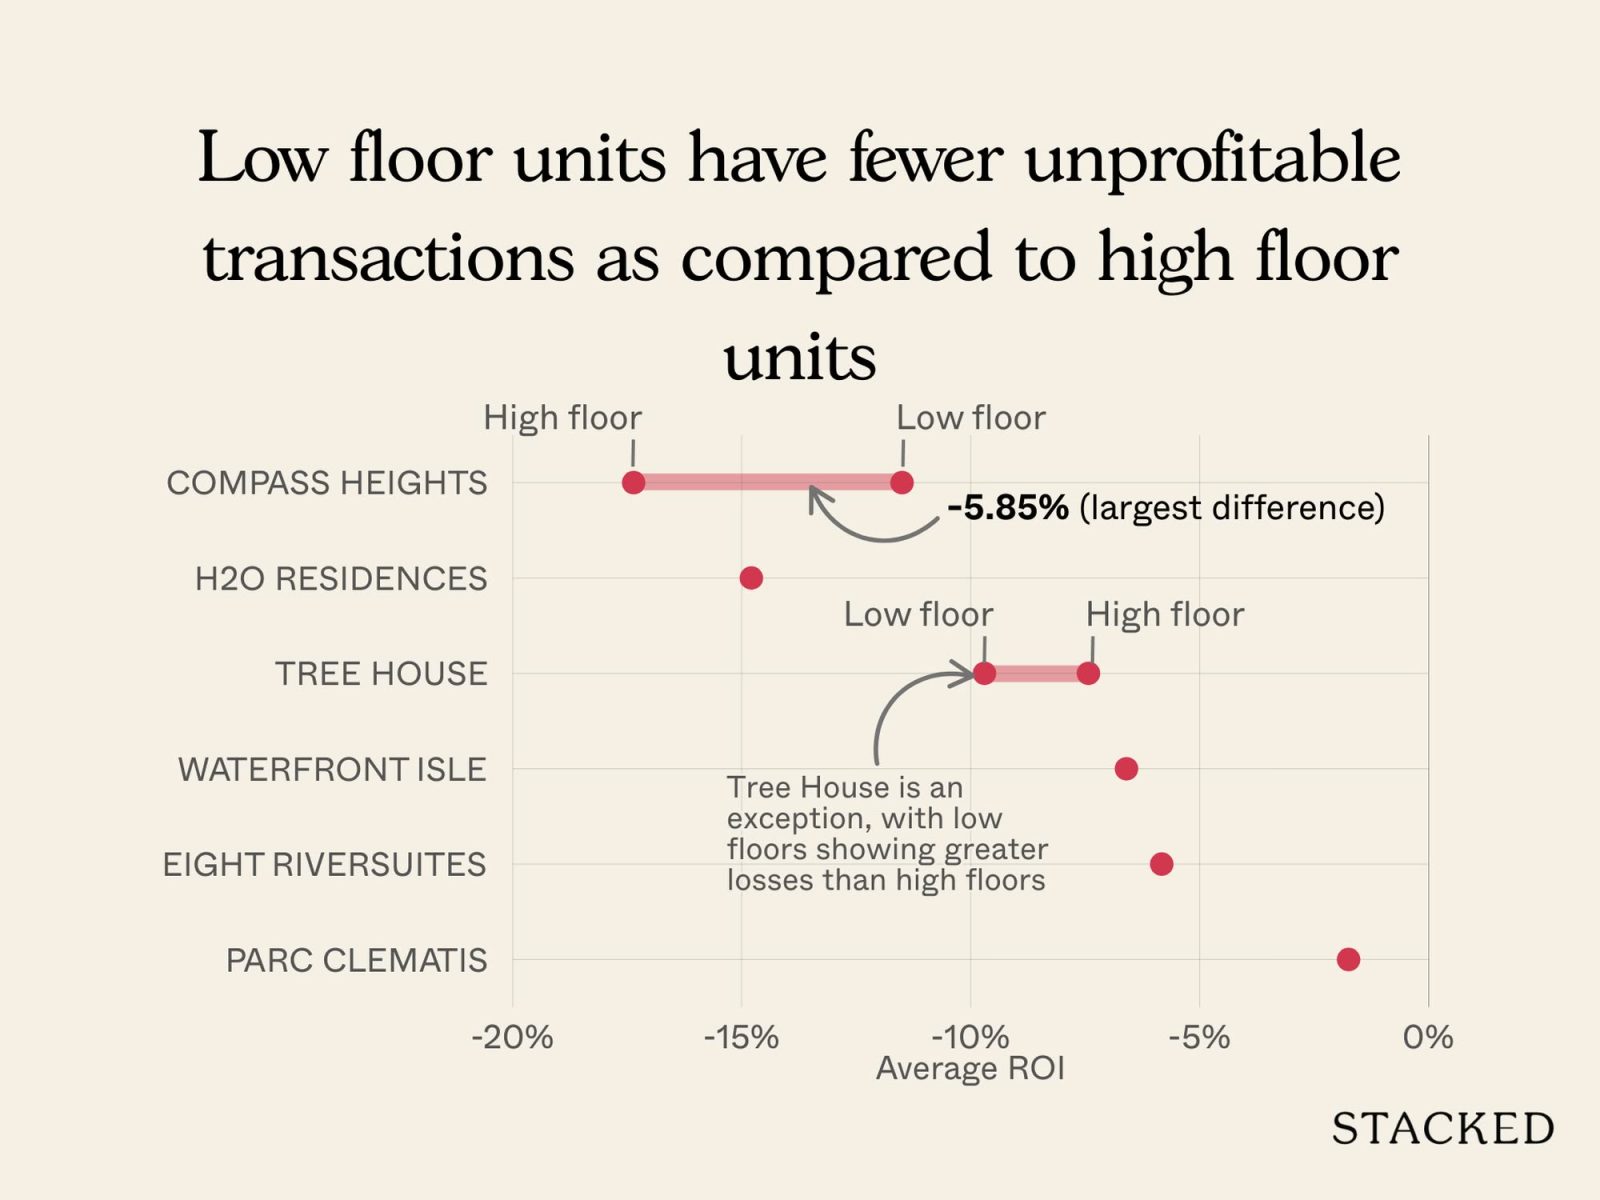
Overall, low-floor units have fewer unprofitable transactions compared to high-floor units. Looking at profitable transactions, the difference in their average ROI ranges between 6.4 per cent and 14.8 per cent in favour of low-floor units. This is not entirely surprising since low-floor units tend to be cheaper in the first place, which helps to limit downside risk.
Digging deeper into the sale types, the majority of transactions involved new sale to sub-sale or resale deals. This further affirms the theory: higher-floor units are usually priced at a premium by developers, while lower-floor units are released at lower entry prices.
Once the units enter the resale market though, the price gap between low and high floors often narrows, allowing low-floor units to enjoy a larger percentage gain in value.
That said, the average ROI can also be skewed by the unit types transacted.
To get a clearer picture, let’s break it down further by unit type:
1-bedroom units
| Project | Gains | Difference in ROI | Difference in sale price | Losses | ||||||||||||||||||
| High floor | Low floor | High floor | Low floor | |||||||||||||||||||
| Average gains | Average ROI | Average sale price | Average holding period (Years) | Tnx volume | Average gains | Average ROI | Average sale price | Average holding period (Years) | Tnx volume | Average losses | Average ROI | Average sale price | Average holding period (Years) | Tnx volume | Average losses | Average ROI | Average sale price | Average holding period (Years) | Tnx volume | |||
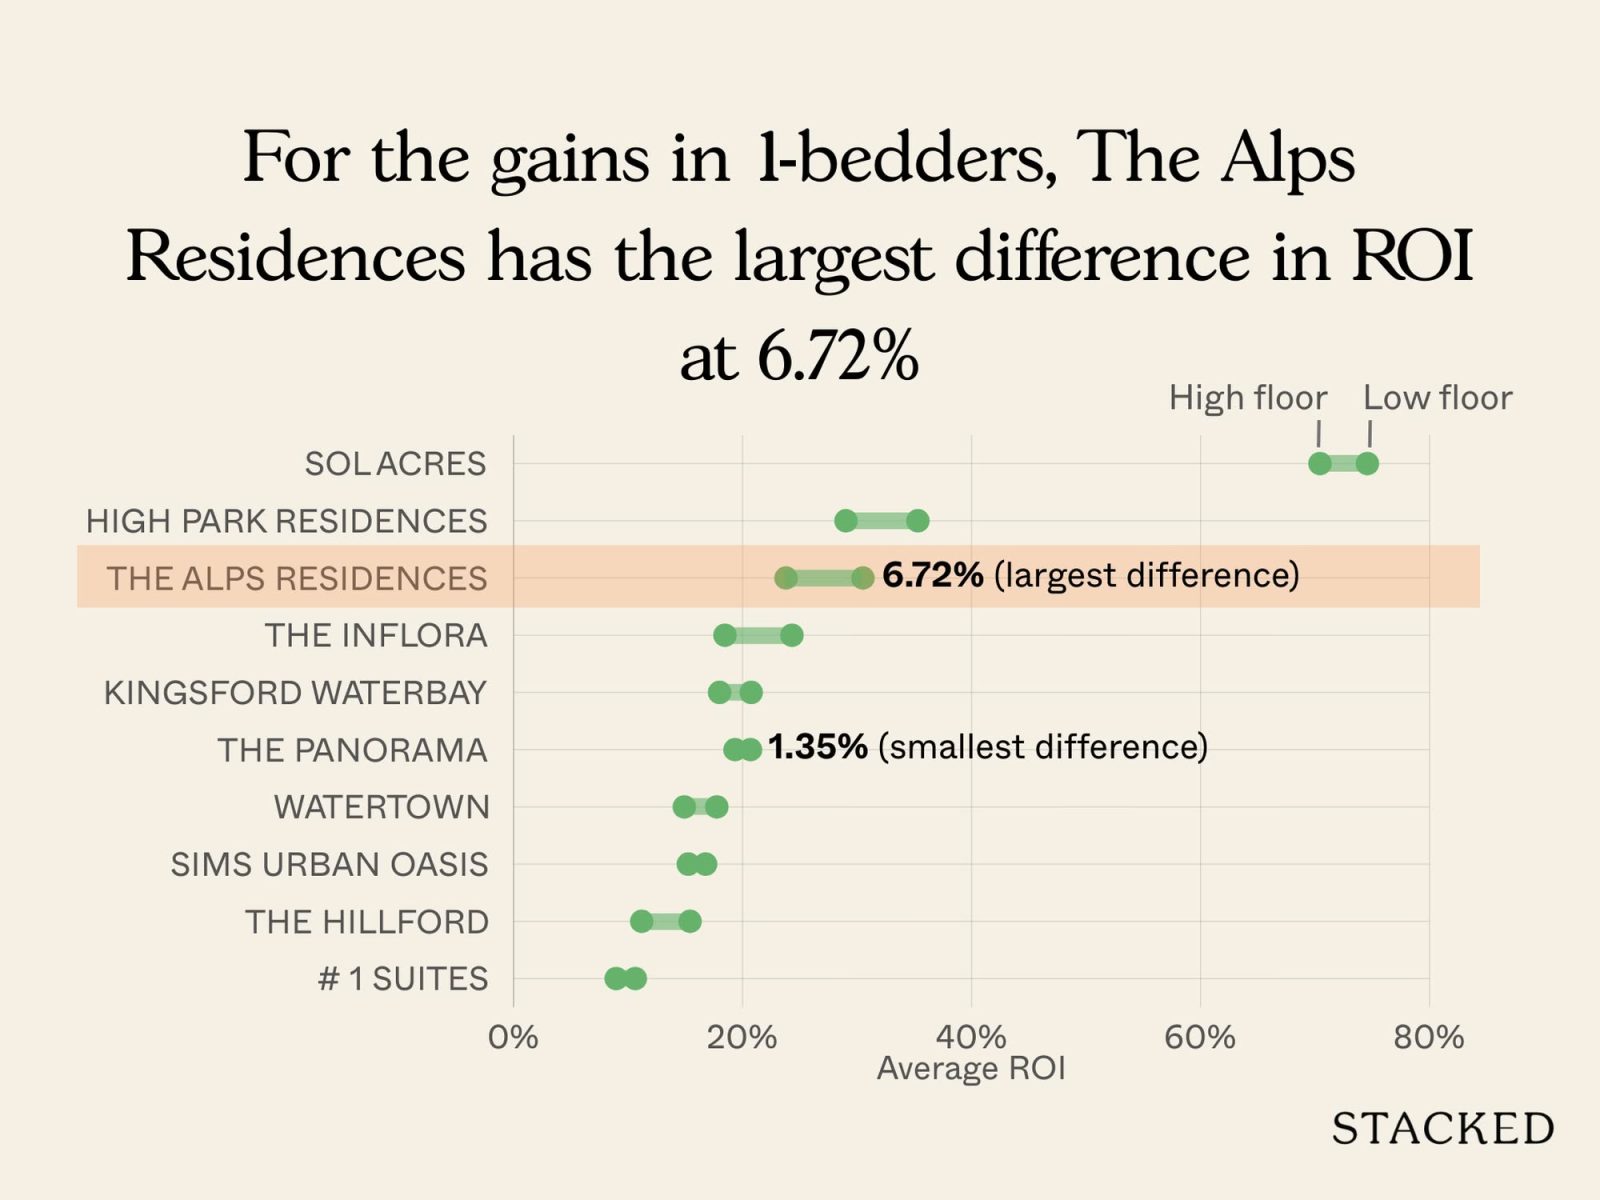
| THE ALPS RESIDENCES | $131,103 | 23.79% | $689,118 | 5.3 | 33 | $159,604 | 30.51% | $684,604 | 6.2 | 23 | 6.72% | -$4,514 | ||||||||||
| HIGH PARK RESIDENCES | $137,505 | 29.03% | $621,057 | 5.3 | 96 | $158,489 | 35.31% | $624,515 | 5.5 | 22 | 6.28% | $3,458 | ||||||||||
| THE INFLORA | $99,009 | 18.46% | $636,154 | 3.5 | 13 | $126,241 | 24.31% | $647,074 | 4.4 | 12 | 5.85% | $10,920 | -$18,000 | -3.28% | $530,000 | 3.5 | 1 | |||||
| THE HILLFORD | $51,320 | 11.19% | $515,176 | 6.2 | 17 | $67,279 | 15.41% | $509,168 | 6.1 | 86 | 4.22% | -$6,008 | -$14,900 | -3.11% | $467,500 | 5.8 | 2 | |||||
| SOL ACRES | $315,748 | 70.43% | $770,159 | 5.7 | 85 | $309,478 | 74.57% | $731,957 | 6.0 | 23 | 4.14% | -$38,203 | ||||||||||
| WATERTOWN | $113,979 | 14.91% | $881,158 | 4.0 | 35 | $132,907 | 17.75% | $888,574 | 4.8 | 12 | 2.84% | $7,416 | ||||||||||
| KINGSFORD WATERBAY | $101,147 | 17.99% | $668,011 | 6.1 | 79 | $111,000 | 20.75% | $652,300 | 6.3 | 20 | 2.76% | -$15,711 | -$7,500 | -1.28% | $579,000 | 4.6 | 2 | -$16,000 | -3.04% | $510,000 | 4.7 | 1 |
| # 1 SUITES | $58,235 | 8.96% | $719,067 | 7.1 | 15 | $67,206 | 10.63% | $697,205 | 7.3 | 19 | 1.67% | -$21,862 | -$48,979 | -7.12% | $645,750 | 6.7 | 4 | -$27,957 | -3.89% | $686,250 | 6.1 | 4 |
| SIMS URBAN OASIS | $100,806 | 15.26% | $768,703 | 5.5 | 93 | $108,544 | 16.77% | $768,647 | 5.9 | 40 | 1.51% | -$55 | ||||||||||
| THE PANORAMA | $121,321 | 19.34% | $753,840 | 5.9 | 39 | $124,135 | 20.69% | $727,189 | 7.1 | 10 | 1.35% | -$26,652 | ||||||||||
Across the top 10 projects, a consistent pattern emerges: low floor units tend to generate stronger average ROI compared to high floor units.
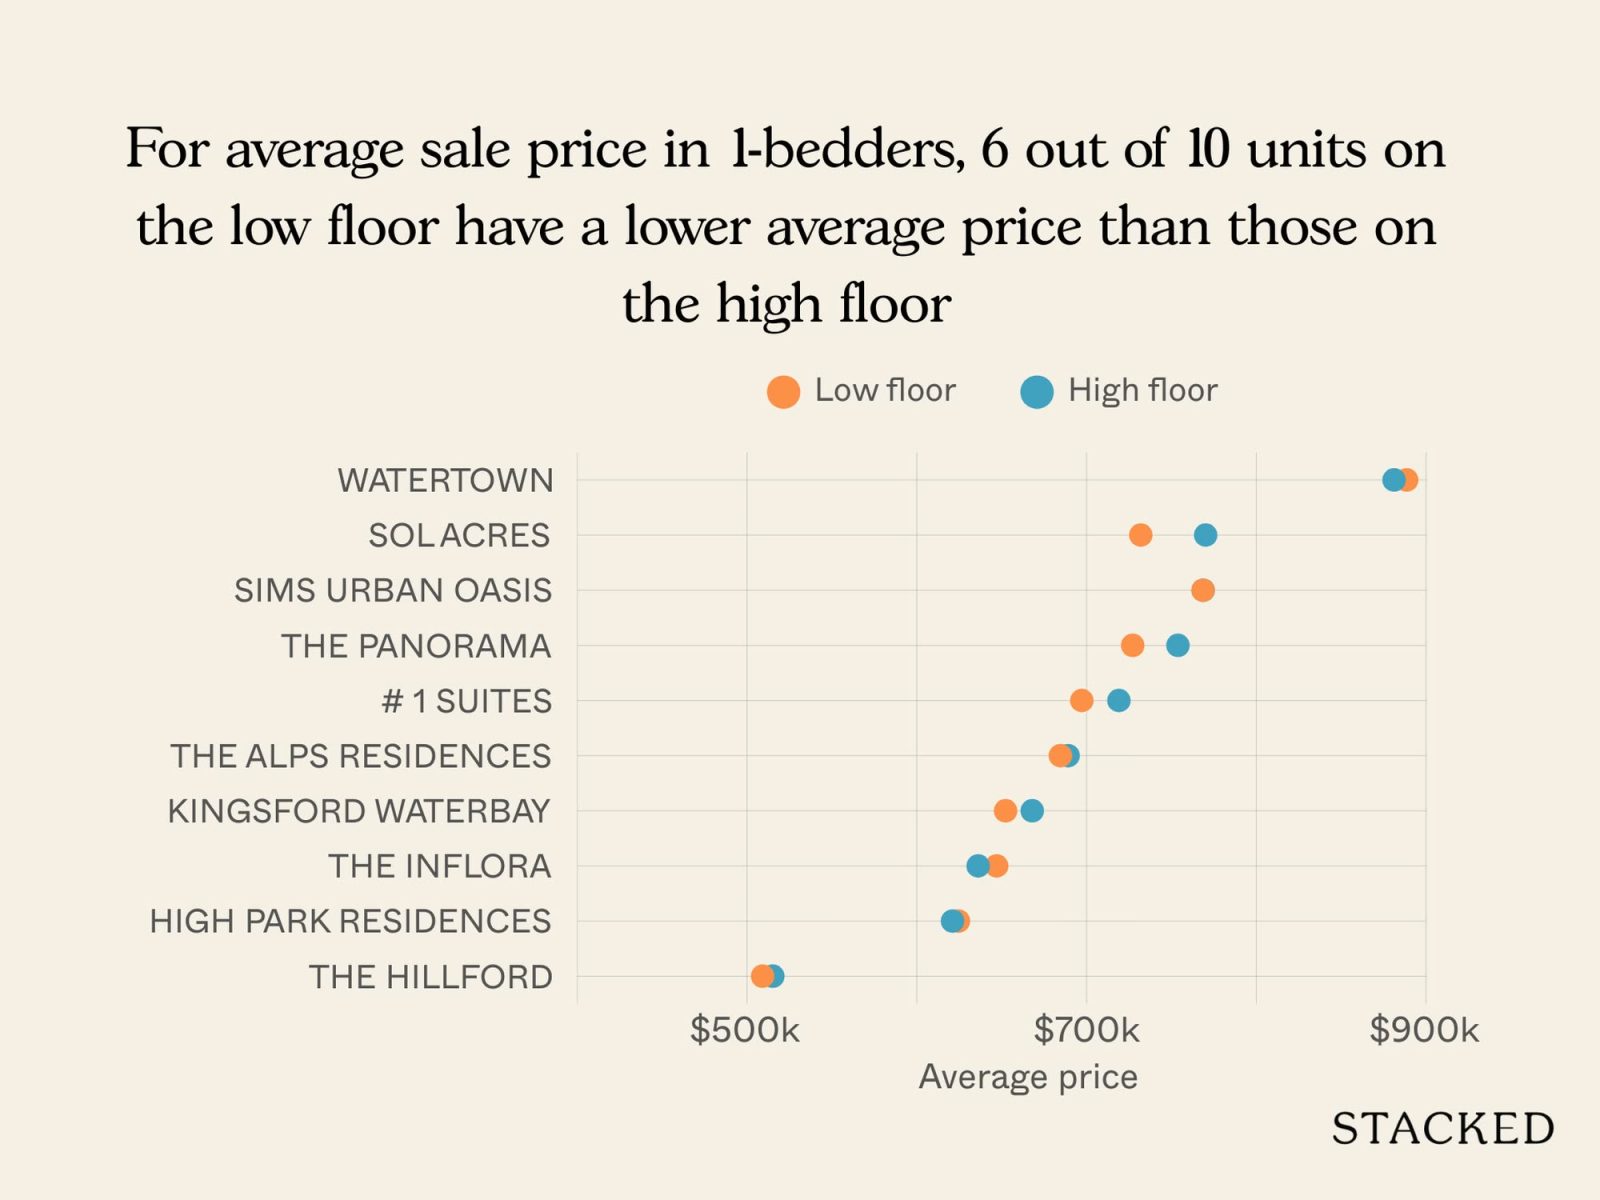
Again, this is often tied to the fact that low floor units transact at lower average sale prices, allowing for easier percentage gains. We also see another repeated pattern: there are fewer instances of unprofitable sales among low floor units.
Among the projects studied, The Alps Residences shows the widest gap in returns, with low floor units achieving an average ROI of 30.51 per cent versus 23.79 per cent for high floor units.
Let’s take a closer look at The Alps Residences, since it’s a notable outlier:
| Transaction type | No. of high floor tnx | Average ROI | No. of low floor tnx | Average ROI |
| New Sale to Sub Sale | 20 | 19.74% | 8 | 22.14% |
| New Sale to Resale | 10 | 35.08% | 15 | 34.98% |
| Sub Sale to Resale | 3 | 13.17% |
| Transaction type | Average purchase price of high floor tnx | Average purchase price of low floor tnx | Price difference |
| New Sale | $554,939 | $533,875 | $21,065 |
| Sub Sale | $660,700 | $637,500 | $23,200 |
| Resale | $732,838 | $709,726 | $23,112 |
When looking at new sale to sub sale transactions, the low floor units achieved a higher average ROI than the high floor units. But for new sale to resale transactions, the returns were more comparable.
The difference in purchase prices between high and low floor units remains consistent across transaction types, with low floor units transacting at around $20,000 to $23,000 less on average.
This entry price gap helps the low floor units to register stronger percentage gains – but in absolute figures, the actual sale prices of low floor units are not too different from the higher floors.
Let’s take a deeper look at the price disparity, starting with new sale transactions:
| Address | Purchase price | Price difference for units in the same stack |
| 107 TAMPINES STREET 86 #02-13 | $495,000 | $31,000 |
| 107 TAMPINES STREET 86 #14-13 | $526,000 | |
| 107 TAMPINES STREET 86 #02-19 | $489,000 | $44,000 |
| 107 TAMPINES STREET 86 #15-19 | $533,000 | |
| 107 TAMPINES STREET 86 #02-22 | $534,000 | $33,000 |
| 107 TAMPINES STREET 86 #13-22 | $567,000 | |
| 107 TAMPINES STREET 86 #02-27 | $557,000 | $36,000 |
| 107 TAMPINES STREET 86 #14-27 | $593,000 |
With the new sale transactions, the price jump from low to high floor units is quite consistent, averaging in the range of $30,000 – $40,000 within the same stack. This reflects the typical floor premium applied by developers at launch.
However, timing also plays a role. Developers usually raise prices as a launch progresses. For instance, in stack 19, the high floor unit on #15 was purchased just six days after the low floor unit on #02, yet the price difference came to $44,000. By contrast, the other examples were all purchased on the same day. So we can see that, in addition to the floor premium, developer pricing movements are also adding to the gap.
Now let’s look at subsale and resale transactions:
| Address | Purchase price | Price difference for units in the same stack |
| 107 TAMPINES STREET 86 #01-20 | $680,000 | $13,000 |
| 107 TAMPINES STREET 86 #13-20 | $693,000 | |
| 107 TAMPINES STREET 86 #02-25 | $668,000 | $57,000 |
| 107 TAMPINES STREET 86 #10-25 | $725,000 | |
| 107 TAMPINES STREET 86 #02-26 | $698,000 | $42,000 |
| 107 TAMPINES STREET 86 #11-26 | $740,000 |
The pattern is less straightforward between sub sale and resale transactions,
In stack 20, the difference between a low and high floor unit was just $13,000, which is far narrower than the gaps observed in stacks 25 and 26.
One possible reason is the condition of the unit: a lower floor unit that has been recently renovated could command a higher price. This is unlike new sales, where pricing is largely driven by developer policies and floor premiums.
We have to accept variables that are less apparent in the data when it comes to resale. These factors can make the price differences less consistent.
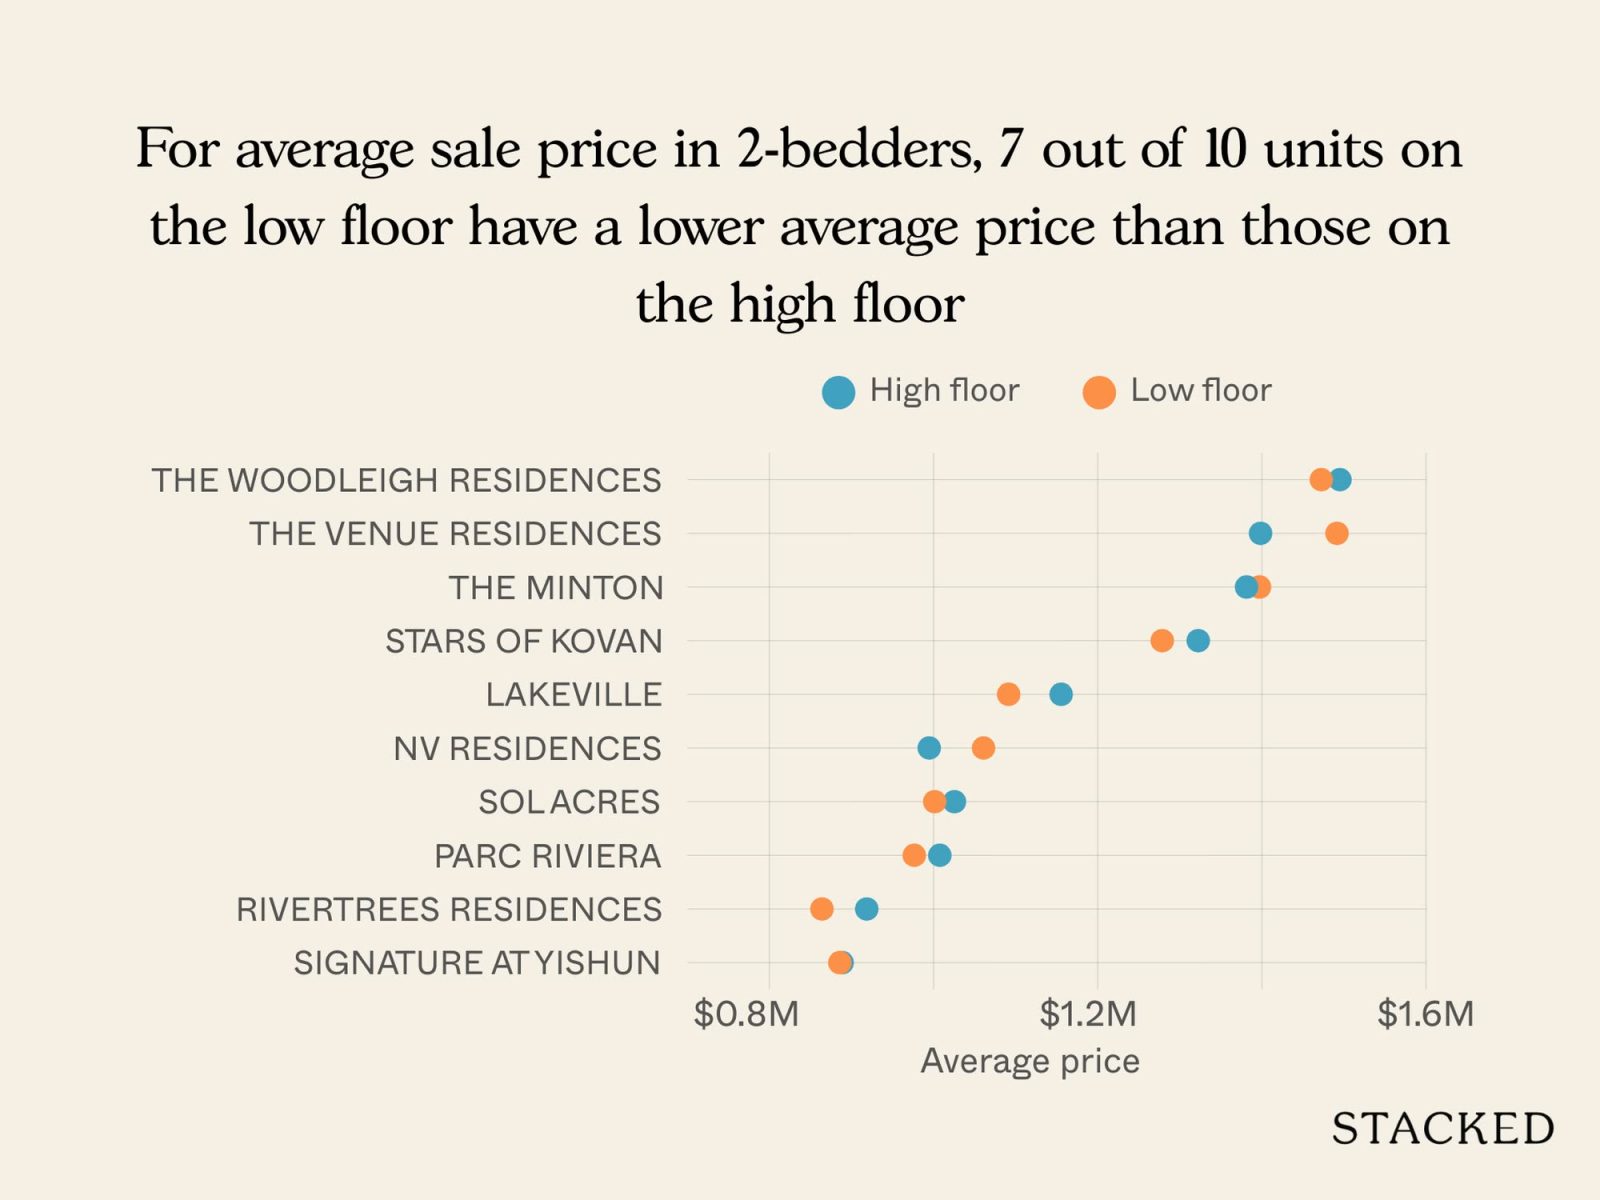
Now let’s look at the two-bedroom units
2-bedroom units
| Project | Gains | Difference in ROI | Difference in sale price | Losses | ||||||||||||||||||
| High floor | Low floor | High floor | Low floor | |||||||||||||||||||
| Average gains | Average ROI | Average sale price | Average holding period (Years) | Tnx volume | Average gains | Average ROI | Average sale price | Average holding period (Years) | Tnx volume | Average losses | Average ROI | Average sale price | Average holding period (Years) | Tnx volume | Average losses | Average ROI | Average sale price | Average holding period (Years) | Tnx volume | |||
| NV RESIDENCES | $172,870 | 20.87% | $994,745 | 5.0 | 17 | $240,833 | 29.75% | $1,060,907 | 4.9 | 12 | 8.87% | $66,162 | -$125,000 | -13.59% | $795,000 | 4.9 | 1 | |||||
| SOL ACRES | $387,789 | 61.87% | $1,025,480 | 6.3 | 146 | $401,028 | 67.51% | $1,001,457 | 6.7 | 35 | 5.64% | -$24,023 | ||||||||||
| SIGNATURE AT YISHUN | $286,541 | 48.01% | $888,639 | 6.0 | 20 | $306,120 | 53.05% | $885,895 | 6.3 | 19 | 5.04% | -$2,744 | ||||||||||
| THE MINTON | $316,499 | 29.75% | $1,381,342 | 4.9 | 40 | $355,667 | 34.47% | $1,397,074 | 5.4 | 12 | 4.71% | $15,732 | -$58,626 | -5.04% | $1,113,333 | 5.9 | 3 | |||||
| THE WOODLEIGH RESIDENCES | $243,102 | 19.63% | $1,495,122 | 4.1 | 49 | $280,000 | 23.62% | $1,472,385 | 4.6 | 13 | 3.99% | -$22,738 | -$12,580 | -0.99% | $1,255,420 | 0.9 | 1 | -$34,000 | -2.44% | $1,360,000 | 3.6 | 1 |
| THE VENUE RESIDENCES | $199,332 | 16.58% | $1,398,412 | 5.4 | 24 | $251,831 | 20.55% | $1,491,533 | 6.5 | 12 | 3.97% | $93,121 | ||||||||||
| STARS OF KOVAN | $230,187 | 21.19% | $1,322,467 | 5.2 | 53 | $251,686 | 24.79% | $1,278,625 | 5.7 | 16 | 3.60% | -$43,842 | ||||||||||
| RIVERTREES RESIDENCES | $118,259 | 14.51% | $918,647 | 7.0 | 52 | $132,077 | 18.05% | $864,067 | 7.2 | 15 | 3.54% | -$54,581 | ||||||||||
| LAKEVILLE | $142,168 | 14.25% | $1,155,486 | 7.4 | 45 | $160,612 | 17.29% | $1,091,500 | 7.9 | 18 | 3.03% | -$63,986 | -$16,500 | -1.62% | $1,012,500 | 5.7 | 2 | |||||
| PARC RIVIERA | $162,952 | 19.49% | $1,007,648 | 5.4 | 131 | $176,625 | 22.32% | $976,563 | 6.1 | 16 | 2.84% | -$31,086 | ||||||||||
The results again show that low floor units tend to achieve stronger returns. The average ROI for low floor units is consistently higher, while their average sale prices are usually lower compared to high floor units.
Losses are also limited: across all 10 projects, there was only a single unprofitable low floor transaction. Overall, the data indicates that for two-bedroom units, the behaviour is quite consistent with what we’ve outlined above.
Since NV Residences has the largest difference in ROI, let’s take a closer look at this project
As NV Residences was completed before 2014, all transactions we’re looking at here are resale.
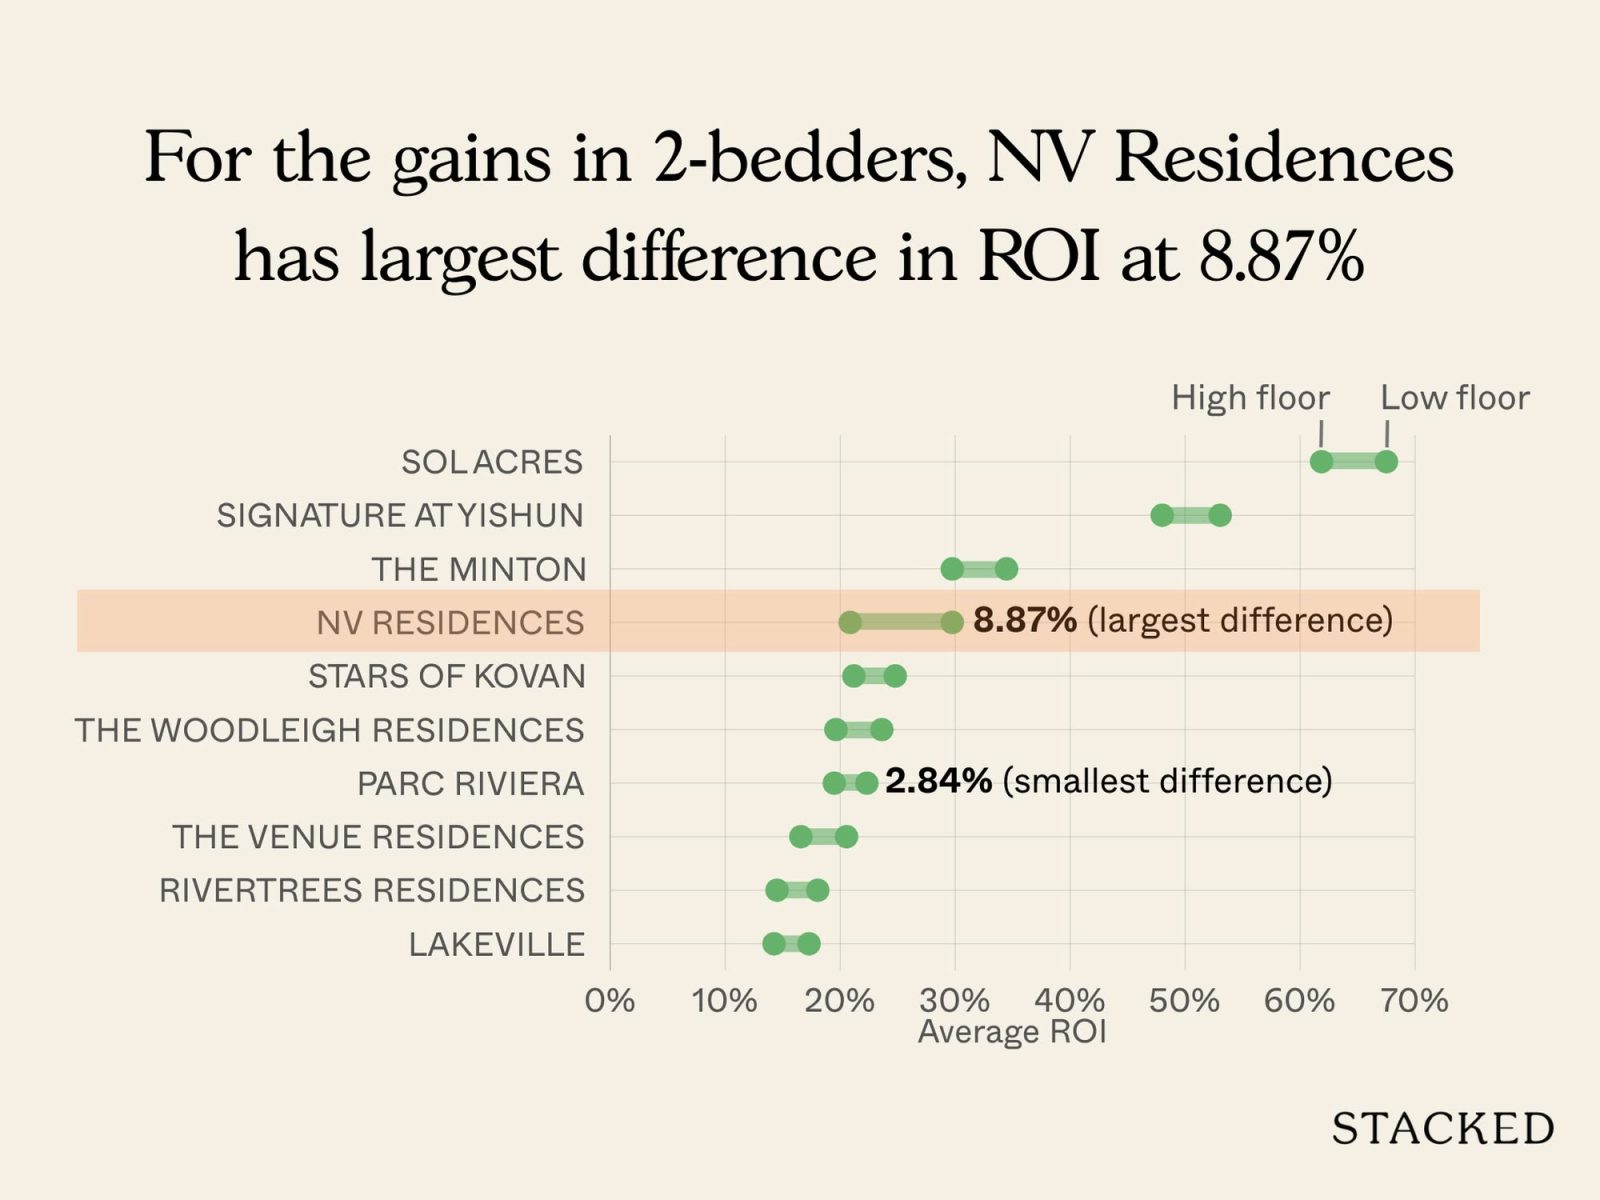
The price gap between low and high floor units is negligible, less than $1,000 on average. Despite this near parity in purchase price, the low floor units delivered a much stronger percentage gain of 29.75 per cent, compared to 18.96 per cent for high floor units.
This suggests buyers were willing to pay as much for a lower floor unit as a higher floor one, when it came to resale; so the buyers of lower floor units won out.
Let’s look a little deeper into this pricing disparity by checking out the resale transactions:
| Address | Purchase price | Price difference for units in the same stack |
| 83 PASIR RIS GROVE #04-06 | $720,000 | $30,000 |
| 83 PASIR RIS GROVE #14-06 | $750,000 | |
| 87 PASIR RIS GROVE #02-14 | $900,000 | $65,000 |
| 87 PASIR RIS GROVE #13-14 | $965,000 | |
| 89 PASIR RIS GROVE #02-23 | $950,000 | $21,888 |
| 89 PASIR RIS GROVE #11-23 | $971,888 | |
| 89 PASIR RIS GROVE #02-24 | $960,000 | $68,000 |
| 89 PASIR RIS GROVE #13-24 | $1,028,000 |
Some stacks show relatively small differences, while others show much larger gaps. Since these are resale-to-resale transactions, they are not influenced by the developer’s original pricing strategy.
Looking more closely at the data, timing appears to play a major role. Most of the low floor units were bought during the early stages of COVID in 2019 and 2020, and later sold in 2024 or 2025 when prices had risen substantially.
By contrast, many of the high floor units were purchased before the pandemic, often at higher entry prices. They were then resold earlier between 2021 and 2023.
This difference in holding periods and market cycles accounts for why the low floor units achieved stronger ROI; this is despite transacting at broadly similar or even lower absolute prices than high floor counterparts.
| Year | Avg 2-bedroom prices in NV Residences |
| 2014 | $918,600 |
| 2015 | $835,000 |
| 2016 | $777,500 |
| 2017 | $788,613 |
| 2018 | $811,238 |
| 2019 | $782,182 |
| 2020 | $790,189 |
| 2021 | $806,377 |
| 2022 | $923,500 |
| 2023 | $1,056,118 |
| 2024 | $1,051,304 |
| 2025 | $1,126,189 |
We can see from the price trend at NV Residences that the average two-bedroom prices dipped steadily from 2014 through 2019, before starting to recover in 2020 and climbing strongly thereafter.
By 2023 to 2025, prices had risen well above the earlier trough, crossing the $1 million mark.
To summarise: many of the low floor units were purchased at a low point during the 2019–2020 period, and later resold in 2024 or 2025 at peak levels.
The high floor units, on the other hand, were often bought earlier in the cycle at higher entry prices – and then they were sold off sooner, before their prices had fully climbed.
As a result, the low floor units recorded stronger percentage gains, despite being sold at similar (or even slightly lower) absolute prices.
Now let’s look at the three-bedders
3-bedroom units
| Project | Gains | Difference in ROI | Difference in sale price | Losses | ||||||||||||||||||
| High floor | Low floor | High floor | Low floor | |||||||||||||||||||
| Average gains | Average ROI | Average sale price | Average holding period (Years) | Tnx volume | Average gains | Average ROI | Average sale price | Average holding period (Years) | Tnx volume | Average losses | Average ROI | Average sale price | Average holding period (Years) | Tnx volume | Average losses | Average ROI | Average sale price | Average holding period (Years) | Tnx volume | |||
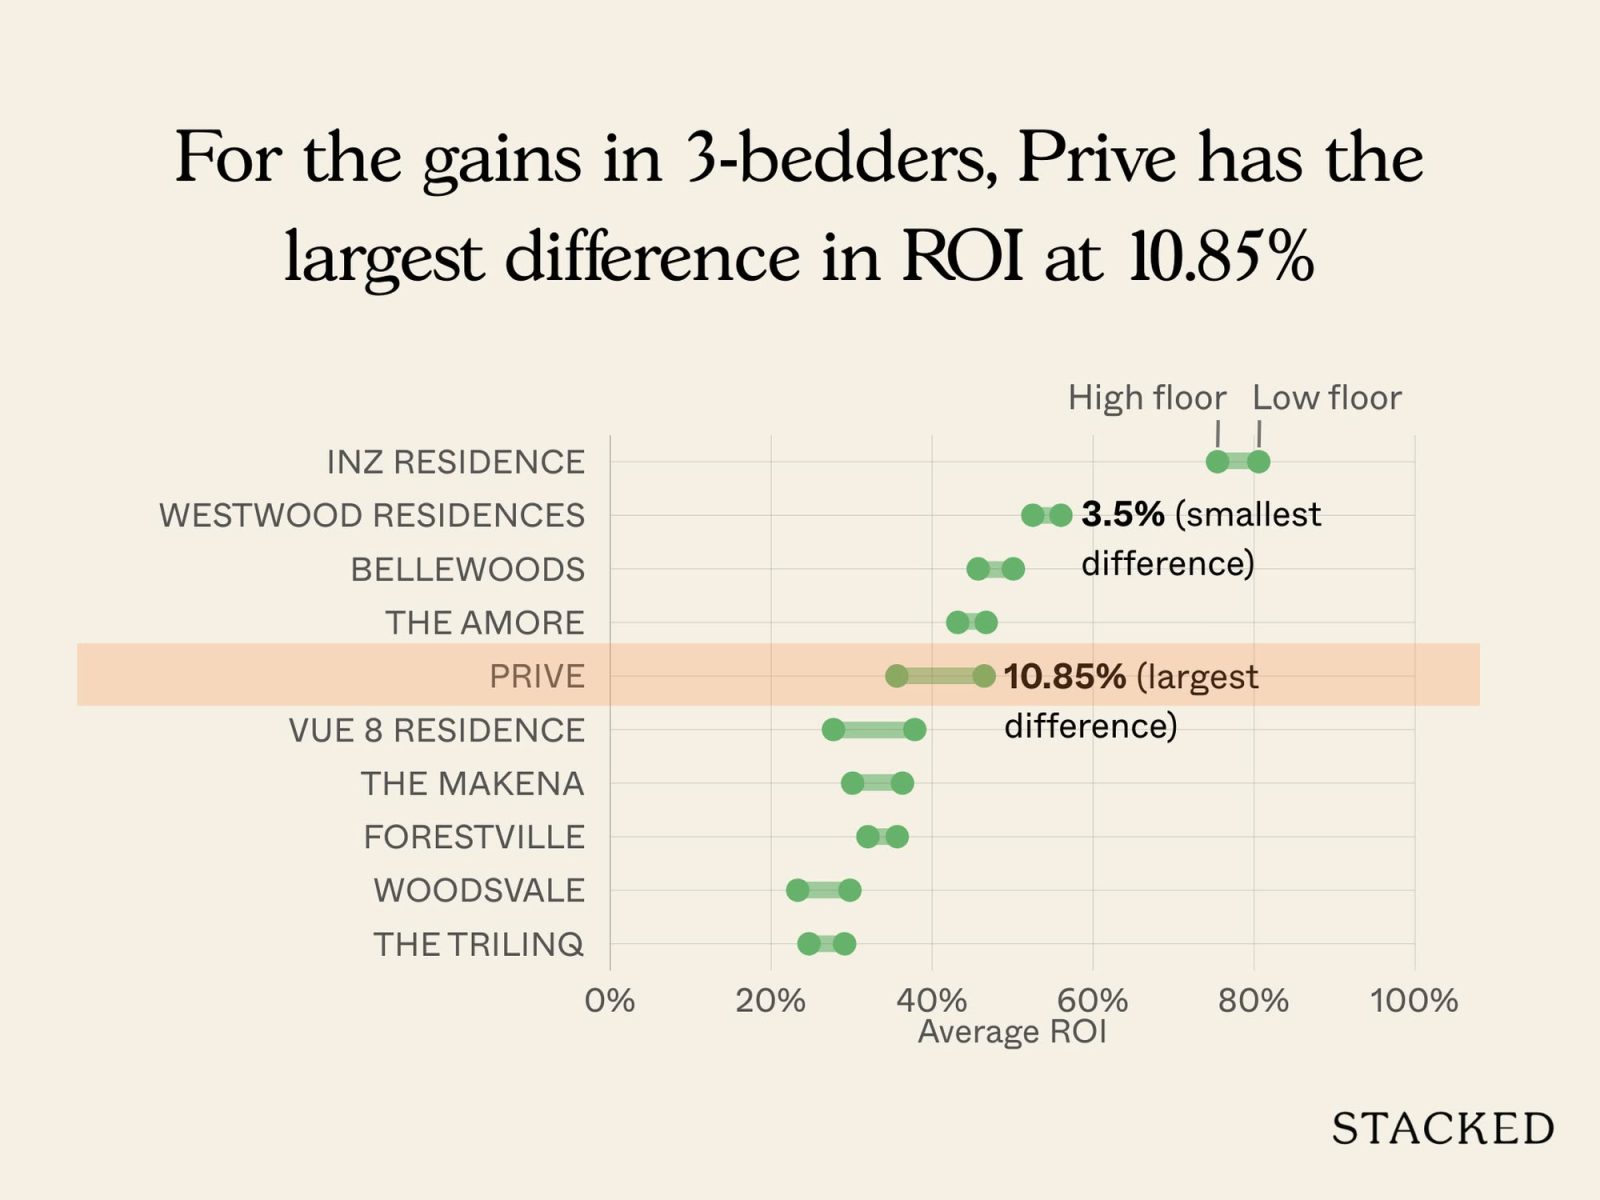
| PRIVE | $399,303 | 35.62% | $1,515,991 | 3.9 | 26 | $465,364 | 46.47% | $1,473,545 | 4.3 | 11 | 10.85% | -$42,446 | ||||||||||
| VUE 8 RESIDENCE | $288,725 | 27.74% | $1,324,813 | 6.7 | 16 | $354,854 | 37.84% | $1,297,500 | 8.3 | 10 | 10.09% | -$27,313 | ||||||||||
| WOODSVALE | $191,365 | 23.30% | $1,010,714 | 5.4 | 14 | $239,533 | 29.78% | $1,054,467 | 6.0 | 15 | 6.49% | $43,752 | -$40,500 | -4.82% | $794,000.00 | 5.1 | 6 | -$38,000 | -4.82% | $750,000 | 0.9 | 1 |
| THE MAKENA | $600,588 | 30.12% | $2,617,676 | 4.9 | 17 | $642,509 | 36.31% | $2,478,389 | 6.1 | 10 | 6.19% | -$139,287 | -$15,000 | -0.63% | $2,355,000.00 | 3.1 | 1 | |||||
| INZ RESIDENCE | $623,906 | 75.46% | $1,454,668 | 7.1 | 61 | $637,787 | 80.58% | $1,432,427 | 7.3 | 25 | 5.12% | -$22,242 | ||||||||||
| THE TRILINQ | $348,323 | 24.70% | $1,763,945 | 5.9 | 82 | $393,535 | 29.12% | $1,742,081 | 6.4 | 11 | 4.42% | -$21,864 | ||||||||||
| BELLEWOODS | $387,652 | 45.72% | $1,244,539 | 6.8 | 53 | $406,710 | 50.09% | $1,218,879 | 7.4 | 45 | 4.38% | -$25,660 | ||||||||||
| FORESTVILLE | $262,787 | 32.02% | $1,083,742 | 7.2 | 53 | $292,208 | 35.66% | $1,111,052 | 7.3 | 30 | 3.65% | $27,309 | ||||||||||
| THE AMORE | $366,051 | 43.18% | $1,219,521 | 6.6 | 51 | $374,222 | 46.71% | $1,188,086 | 6.9 | 22 | 3.53% | -$31,435 | ||||||||||
| WESTWOOD RESIDENCES | $414,357 | 52.51% | $1,203,352 | 6.6 | 62 | $432,400 | 56.00% | $1,209,656 | 6.7 | 18 | 3.50% | $6,303 | ||||||||||
By now, we know what to expect: across the top 10 projects, the data once again shows that low floor units generally deliver stronger returns.
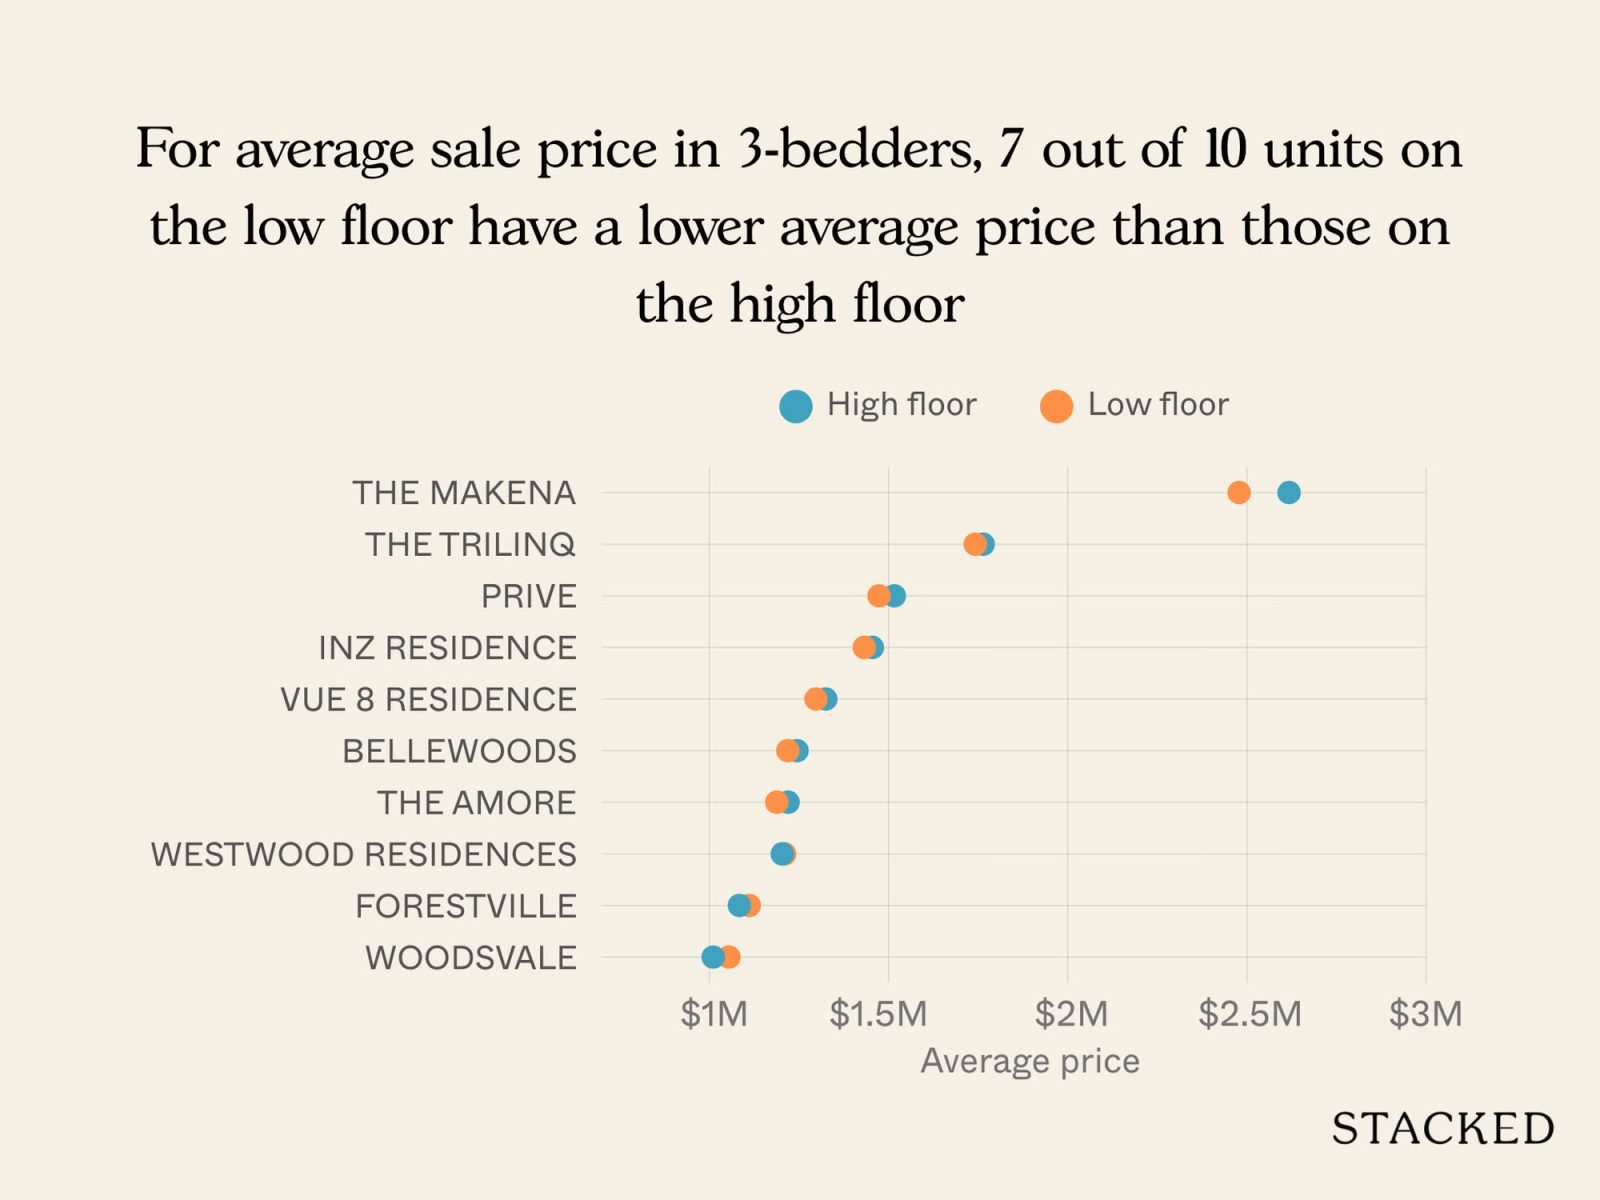
We see the same pattern that the average ROI for low floor units is higher, while their absolute sale prices tend to be lower compared to high floor counterparts.
Losses were relatively limited overall, and only one project recorded a single unprofitable low floor transaction. Taken together, the results suggest we can have the same general expectations for three-bedders as for smaller units.
This is, incidentally, contrary to a theory we sometimes hear from agents: it’s sometimes said that high floor units are more important to families (who tend to buy larger three-bedders) than to tenants or singles, who prioritise affordability over such indulgences.
But the data – at least as observed from the top 10 projects – doesn’t show any difference between the smaller and family-sized units, not in this particular regard.
Since Prive has the largest difference in ROI, let’s take a closer look at this project
| Transaction type | No. of high floor tnx | Average ROI | No. of low floor tnx | Average ROI |
| Resale to Resale | 26 | 35.62% | 46.47% | 11 |
| Transaction type | Average purchase price of high floor tnx | Average purchase price of low floor tnx | Price difference |
| Resale | $1,243,657 | $1,181,634 | $62,023 |
Since Prive was completed before 2014, all transactions are resale to resale. Here, the data shows a significant price gap between high and low floor units, with high floor units purchased at an average of about $62,000 more. Despite this premium, the low floor units achieved a much stronger ROI of 46.47 per cent compared to 35.62 per cent for high floors. This suggests that buyers were willing to pay substantially more upfront for higher floors, but when it came to resale, the price difference between low and high floor units narrowed. As a result, the lower entry price of the low floor units translated into stronger percentage gains over the same period.
Let’s take a deeper look at the price disparity through the resale units
| Address | Purchase price | Price difference for units in the same stack | Unit size (sqft) |
| 33 PUNGGOL FIELD #04-19 | $1,035,000 | $45,000 | 1098 |
| 33 PUNGGOL FIELD #16-19 | $1,080,000 | 1098 | |
| 33 PUNGGOL FIELD #06-10 | $1,100,000 | $18,000 | 1098 |
| 33 PUNGGOL FIELD #16-10 | $1,118,000 | 1098 | |
| 35 PUNGGOL FIELD #04-28 | $1,020,000 | $80,000 | 1087 |
| 35 PUNGGOL FIELD #16-28 | $1,100,000 | 1087 | |
| 31 PUNGGOL FIELD #02-07 | $1,748,000 | $102,000 | 1130 |
| 31 PUNGGOL FIELD #12-07 | $1,850,000 | 1184 | |
| 33 PUNGGOL FIELD #03-20 | $1,350,000 | $308,000 | 1098 |
| 33 PUNGGOL FIELD #12-20 | $1,658,000 | 1130 | |
| 33 PUNGGOL FIELD #02-13 | $1,480,000 | $190,000 | 1001 |
| 33 PUNGGOL FIELD #11-13 | $1,670,000 | 1098 |
There’s an added complexity when it comes to Prive, because the higher floor units are larger than the lower floor counterparts, even within the same stack. The higher floor pricing may be a result of unit size rather than just height.
Nonetheless, when we break it down by size, we see that low floor units under 1,130 sq ft achieved a notably higher average ROI of 52 per cent, compared to 37 per cent for larger units.
This may reflect stronger demand for more affordable, compact three-bedroom layouts, especially those on the second to fifth floors.
For high floor units, the pattern is reversed: smaller units under 1,130 sq ft saw a lower ROI of 32 per cent, while larger units above 1,130 sq ft averaged 44 per cent. This suggests that buyers on higher floors may place more value on spaciousness, whereas large lower floor units are less in demand.
It does coincide with certain sets of buyer preferences: someone seeking affordability, for instance, would also be less inclined to pay a premium just for a nicer view. But they would also likely look for a smaller unit with a less affordable quantum, so “large + low floor” may still be off their shortlist.
Prive shows that a mix of unit sizes plays as much of a role as different floors, in ROI outcomes.
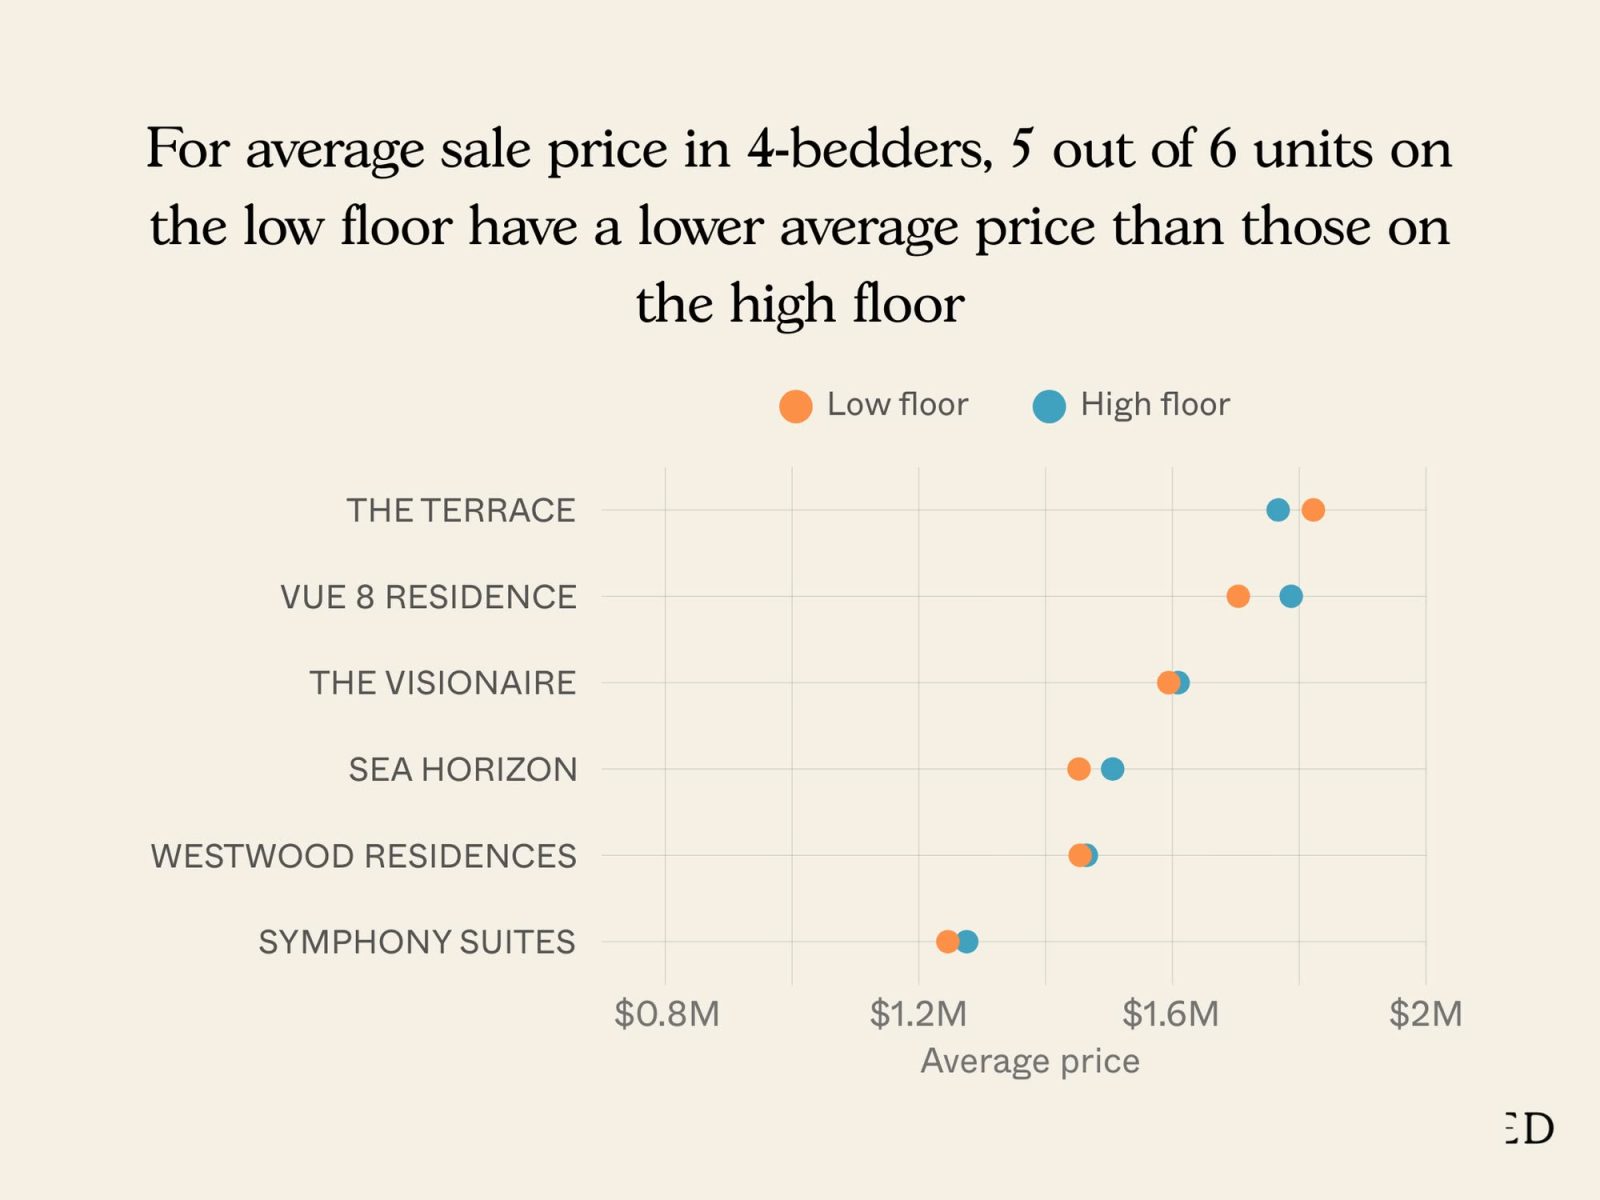
Now let’s look at the four-bedder units
| Project | Gains | Difference in ROI | Difference in sale price | |||||||||
| High floor | Low floor | |||||||||||
| Average gains | Average ROI | Average sale price | Average holding period (Years) | Tnx volume | Average gains | Average ROI | Average sale price | Average holding period (Years) | Tnx volume | |||
| THE TERRACE | $673,608 | 61.76% | $1,766,730 | 7.3 | 32 | $761,183 | 71.83% | $1,822,327 | 7.8 | 18 | 10.07% | $55,598 |
| SYMPHONY SUITES | $194,044 | 18.15% | $1,275,451 | 5.2 | 33 | $214,204 | 20.96% | $1,245,762 | 5.4 | 21 | 2.81% | -$29,689 |
| VUE 8 RESIDENCE | $411,381 | 30.47% | $1,787,308 | 5.8 | 31 | $413,105 | 33.10% | $1,703,877 | 6.5 | 14 | 2.63% | -$83,431 |
| WESTWOOD RESIDENCES | $499,279 | 51.79% | $1,464,169 | 7.3 | 33 | $502,055 | 52.67% | $1,454,421 | 7.0 | 14 | 0.88% | -$9,748 |
| SEA HORIZON | $407,673 | 37.08% | $1,505,706 | 7.1 | 17 | $396,440 | 37.94% | $1,452,613 | 6.9 | 16 | 0.86% | -$53,093 |
| THE VISIONAIRE | $612,445 | 61.77% | $1,608,928 | 7.0 | 24 | $613,651 | 62.59% | $1,594,162 | 6.8 | 24 | 0.81% | -$14,766 |
We should note that, when it comes to four-bedders, most are purchased as pure family homes. Investors won’t usually buy such large, high quantum units in pursuit of gains or rental; and for that reason, four-bedders also tend toward lower transaction volumes, which makes gains less predictable.
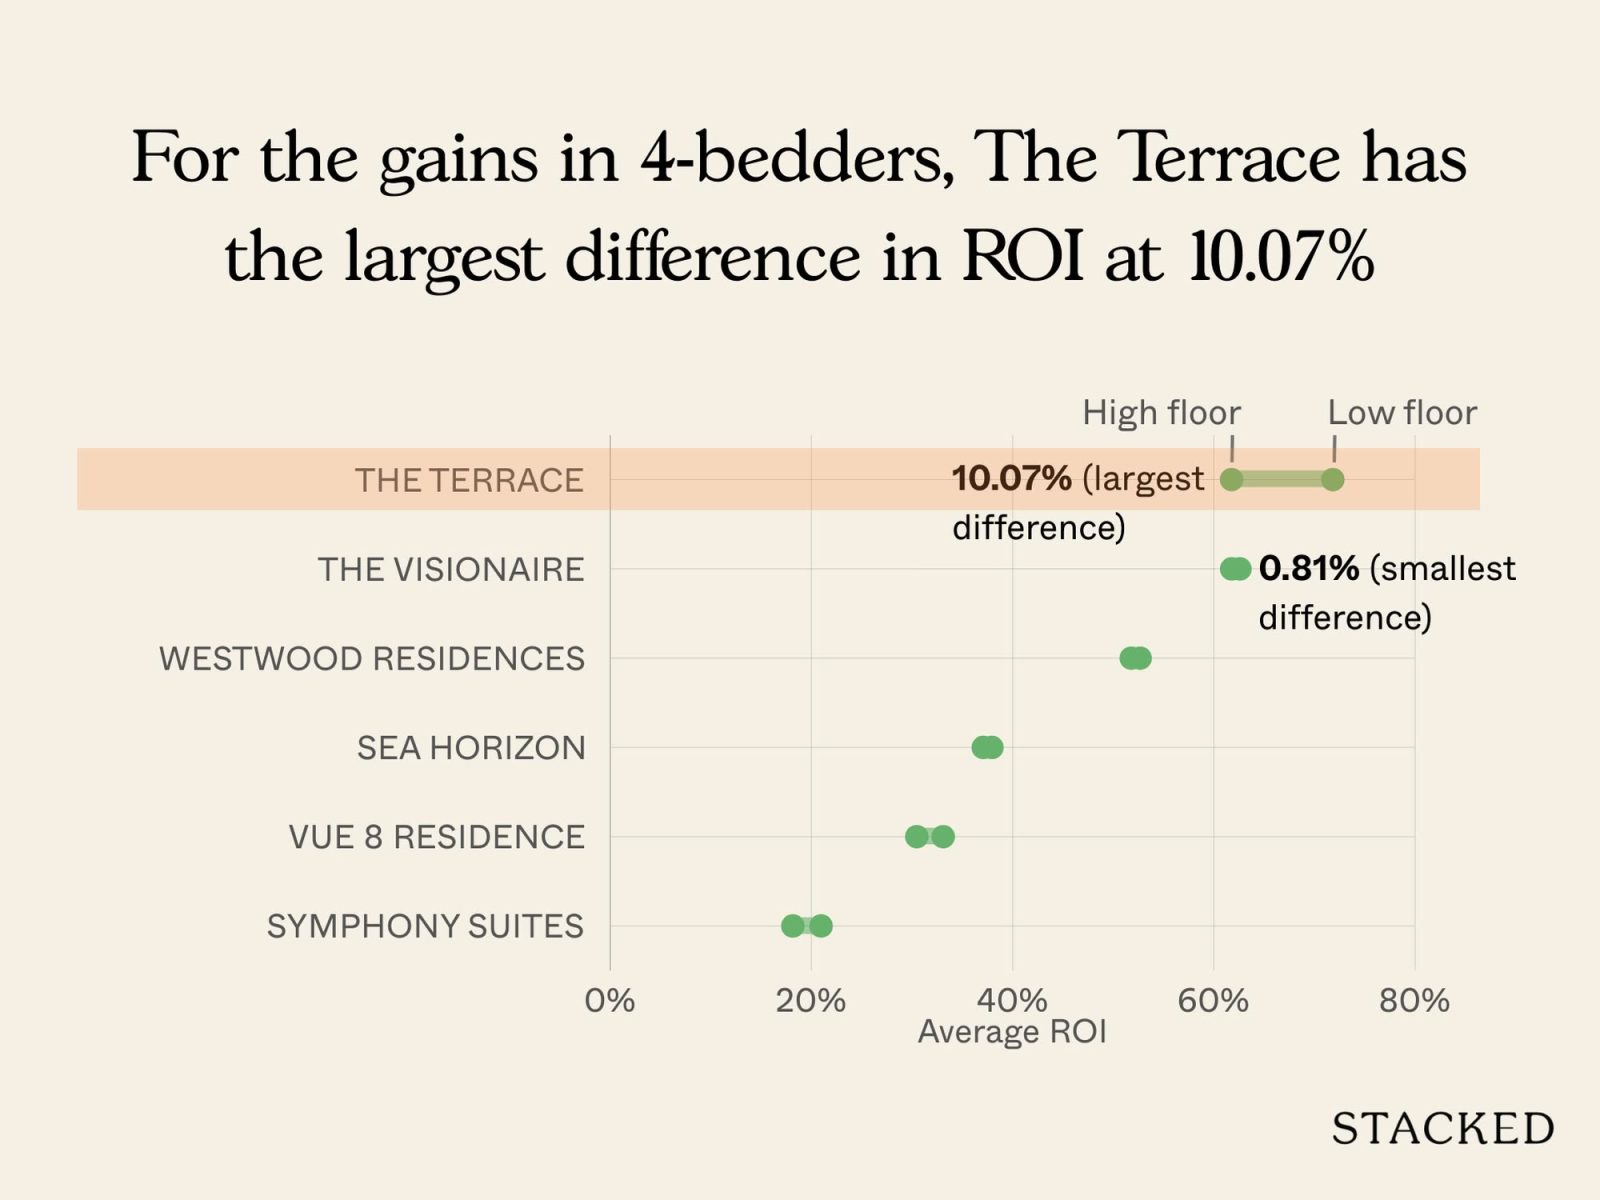
That said, low floor units once again edge out higher floor counterparts in percentage gain, among the top 10. This is again due to lower absolute prices, which give low floor buyers room for percentage gains.
Notably, all the projects reviewed recorded profitable transactions, with no unprofitable four bedroom sales from 2014 to June 2025. This suggests that larger family-sized units, whether on high or low floors, tend to be resilient in value. Nonetheless, buyers who opted for lower floors often walked away with stronger percentage returns.
The Terrace has the largest difference in ROI, so let’s take a closer look at this project
| Transaction type | No. of high floor tnx | Average ROI | No. of low floor tnx |
| New Sale to Resale | 31 | 62.19% | 18 |
| Resale to Resale | 1 | 48.41% |
| Transaction type | Average purchase price of high floor tnx | Average purchase price of low floor tnx | Price difference |
| New Sale | $1,097,890 | $1,045,231 | $52,659 |
| Resale | $1,752,232 | $1,813,784 | -$61,552 |
As always, low floor units saw a higher percentage gain. But the average price gap at launch was notable, with high floor units bought for about $52,000 more on average than low floor units.
So far, there have not been any low floor resale to resale transactions; but among the high floor units, the single resale to resale deal achieved a lower ROI of 48.41 per cent.
Interestingly, the average purchase price for low floor resale units is actually above their higher floor counterparts.
Let’s take a deeper look at the disparity
New sale transactions
| Address | Purchase price | Price difference for units in the same stack |
| 100 EDGEDALE PLAINS #02-42 | $1,006,700 | $105,000 |
| 100 EDGEDALE PLAINS #17-42 | $1,111,700 | |
| 80 EDGEDALE PLAINS #03-01 | $1,013,700 | $70,000 |
| 80 EDGEDALE PLAINS #13-01 | $1,083,700 | |
| 82 EDGEDALE PLAINS #02-05 | $1,095,800 | $88,000 |
| 82 EDGEDALE PLAINS #13-05 | $1,183,800 | |
| 98 EDGEDALE PLAINS #02-38 | $1,006,700 | $105,000 |
| 98 EDGEDALE PLAINS #17-38 | $1,111,700 |
The timing of purchase is a factor here. Many of the high floor units were sold earlier in the launch, around 2015, while their corresponding low floor units were sold in 2016. As a result, the price differences within the same stack are as much due to the developer raising prices as it is to height differences.
This makes the gap less consistent compared to when low and high floor units are purchased within the same launch phase.
Let’s look at the performance in the resale market only
| Address | Purchase price | Price difference for units in the same stack |
| 82 EDGEDALE PLAINS #05-08 | $1,660,000 | $25,000 |
| 82 EDGEDALE PLAINS #15-08 | $1,685,000 | |
| 84 EDGEDALE PLAINS #05-10 | $1,880,000 | -$130,000 |
| 84 EDGEDALE PLAINS #12-10 | $1,750,000 | |
| 86 EDGEDALE PLAINS #03-13 | $2,000,000 | $0 |
| 86 EDGEDALE PLAINS #08-13 | $2,000,000 | |
| 98 EDGEDALE PLAINS #07-38 | $1,850,000 | $0 |
| 98 EDGEDALE PLAINS #14-38 | $1,850,000 |
All of the units compared are of the same size, yet the resale price gaps have narrowed – sometimes to the point where low floor units are transacting at equal or higher prices than high floor counterparts. For example, the unit at #05-10 sold for $1.88 million, which is $130,000 more than its high floor counterpart at #12-10.
This reversal suggests that factors beyond floor level, such as renovations or circumstances specific to the sale (e.g., a seller in a rush), can play a major role in resale pricing. So once again, the premium charged by developers isn’t always redeemed or justified, once the project enters the secondary market.
Conclusion
When we dug into the transactions, one pattern stood out: most of the cases where low-floor units outperformed on ROI were new sale-to-resale deals.
That’s no surprise once you look at how developers price. Higher floors are typically launched with a premium, while lower floors start at a cheaper entry point. This makes it easier for lower-floor units to see bigger percentage gains.
Timing matters too. If a low- and higher-floor unit were both bought at the same stage of a launch, the lower one will almost always be cheaper. But if that same low-floor unit was picked up much later – after developers raised prices – it could end up costing more than a higher-floor unit bought earlier.
We also see that, once units hit the resale market, the premium for height tends to narrow, sometimes vanishing altogether. Renovations, condition, and seller expectations can all play a bigger role. And when that happens, the low-floor owners who got in at a lower entry price often see their ROI percentage come out on top.
That being said, we should acknowledge that there are some condos out there (often of the more luxury bent) where buyers really are willing to fork out more for higher floor units. Realtors on the ground have pointed out that in areas famous for waterside views – such as the famed Meyer Road stretch and in Tanjong Rhu – higher floor units do have tangibly higher demand; but this is specific to the project and area.
The challenge with higher-floor premiums isn’t just whether buyers like the view, it’s how developers price units at launch. Too many investors assume paying more guarantees stronger appreciation, but our analysis shows the real driver is entry cost and timing, not altitude.
Now you have a framework to evaluate whether a floor premium is justified: compare new-sale pricing spreads, consider resale narrowing, and weigh project-specific demand for views. At Stacked, we’ve used this approach to help buyers avoid overpaying for units that underperform, and to spot opportunities in projects where lower floors punch above their weight.
Curious how these principles apply to your own shortlist? Let’s chat.
For more on the Singapore property market and more data-driven deep dives, follow us on Stacked.