In this Stacked Pro breakdown:
– We reveal which regions saw the highest growth in $PSF and quantum
– Show how resale units are catching up — and in some cases, offer better value than new launches
– Plus: A case study of Martin Modern vs Jadescape
🔓 Unlock the full data and insights to make your next move a smarter one.
Perhaps due to issues of affordability, the demand for two-bedder condos has been on the rise in Singapore. Increasingly, we’re seeing homeowners, such as small families, opt for two-bedders (or 2+1 layouts) in place of higher-quantum three-bedders.
The question now is: why not a resale two-bedder, over a pricier new launch?
In this article we’ll also look at how some resale options may be offering better value; and we’ll use Martin Modern and Jadescape as a case study.
Prices of two-bedder units from 2014 to 2024
Here are the prices over the past 10 years, divided by market segment. We’ll begin by looking at the price psf:
| Year | Avg $PSF by market segment | ||
| CCR | RCR | OCR | |
| 2014 | $1,974 | $1,518 | $1,177 |
| 2015 | $1,830 | $1,435 | $1,150 |
| 2016 | $1,966 | $1,416 | $1,185 |
| 2017 | $1,977 | $1,463 | $1,188 |
| 2018 | $2,218 | $1,618 | $1,276 |
| 2019 | $2,349 | $1,730 | $1,360 |
| 2020 | $2,196 | $1,735 | $1,408 |
| 2021 | $2,362 | $1,818 | $1,406 |
| 2022 | $2,468 | $1,870 | $1,561 |
| 2023 | $2,526 | $1,948 | $1,885 |
| 2024 | $2,446 | $1,954 | $1,786 |
| Annualised | 2.17% | 2.56% | 4.26% |
In terms of price psf, the OCR saw the highest annualised growth across Singapore. Conversely, the CCR saw the slowest growth; but this is not surprising as CCR properties already start at the highest baseline prices.
Next, we’ll look at prices in terms of quantum:
| Year | Avg price by market segment | ||
| CCR | RCR | OCR | |
| 2014 | $1,923,166 | $1,231,967 | $936,466 |
| 2015 | $1,731,580 | $1,132,323 | $886,994 |
| 2016 | $1,903,837 | $1,084,748 | $925,101 |
| 2017 | $1,816,017 | $1,143,623 | $969,207 |
| 2018 | $2,119,908 | $1,227,770 | $1,025,774 |
| 2019 | $2,030,030 | $1,295,567 | $1,042,938 |
| 2020 | $1,906,189 | $1,274,510 | $1,079,233 |
| 2021 | $1,942,134 | $1,397,981 | $1,122,418 |
| 2022 | $2,025,837 | $1,460,512 | $1,243,755 |
| 2023 | $2,166,347 | $1,514,990 | $1,431,870 |
| 2024 | $2,278,009 | $1,531,574 | $1,376,301 |
| Returns | 18.5% | 24.3% | 47.0% |
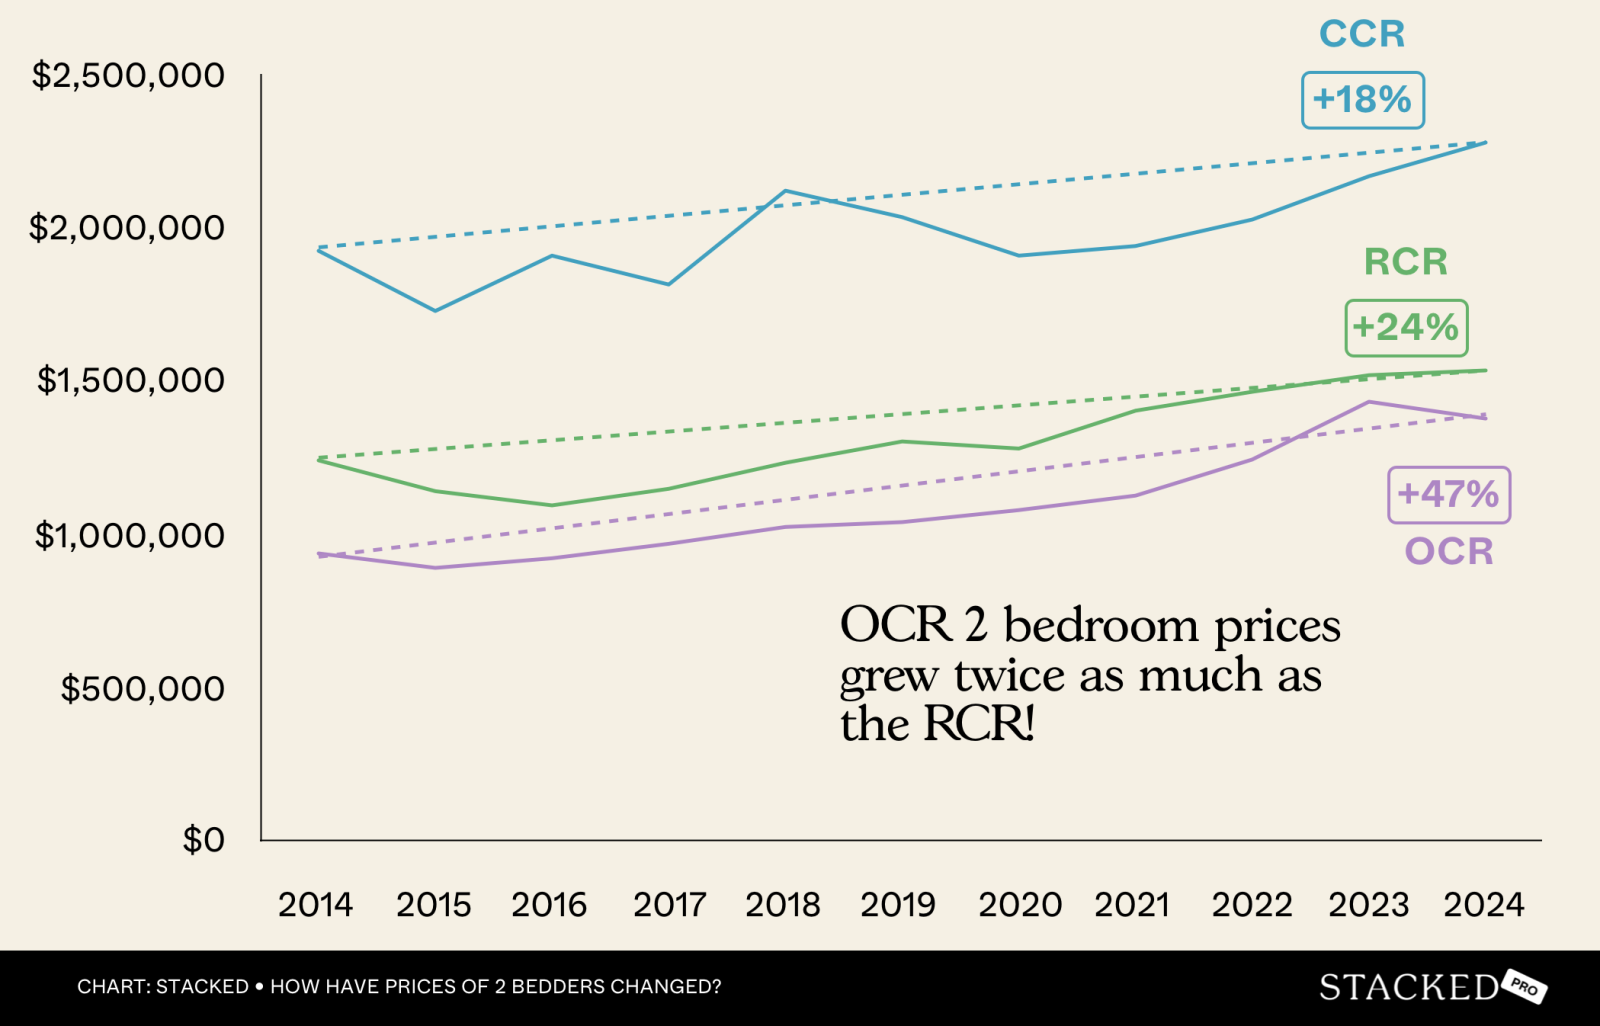
In absolute terms, the OCR saw the most dramatic price growth, while again the CCR saw relatively muted growth. The OCR saw prices rise from $936,000 to around $1.38 million, a sharp 47 per cent surge in a single decade (although we did see a small correction in 2023 – 2024).
Visually, here’s what the price movement over 10 years looks like:
Performances of individual regions aside, what will interest buyers is that the gaps between them have narrowed. For example, consider the CCR versus the RCR (blue ine below):
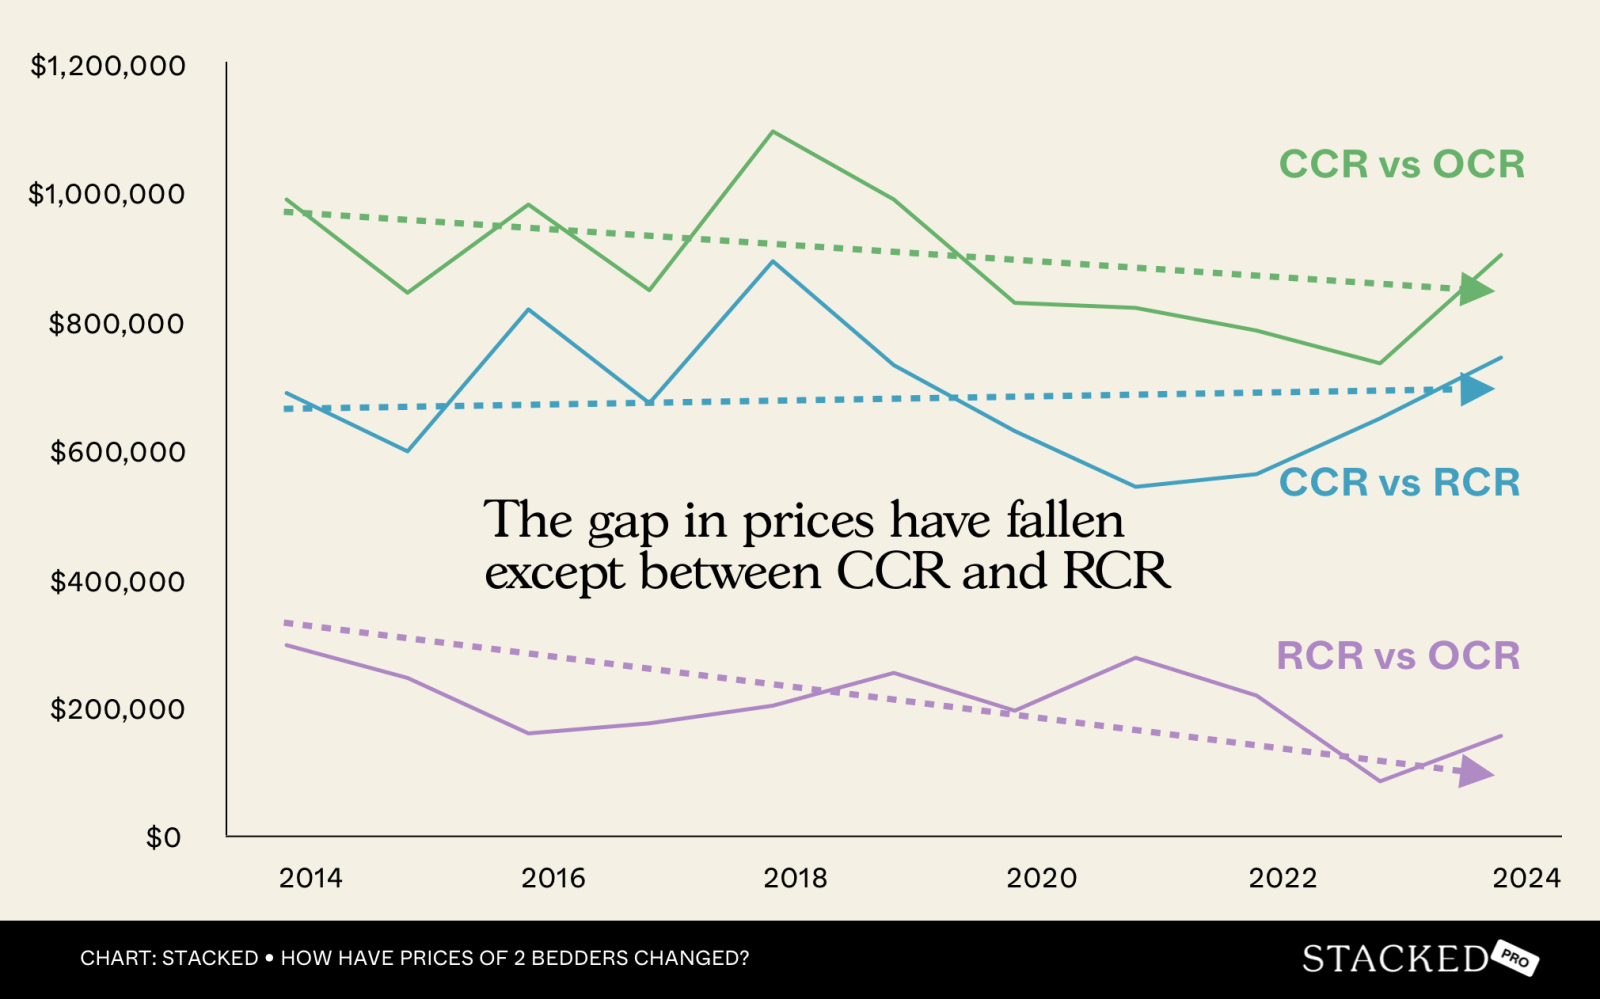
In 2014, the average 2-bedder in the CCR was around $691,000 (56 per cent) more expensive than its RCR counterpart. But by 2021, that gap shrank to just around $544,000 (39 per cent), and only climbed again post-2022 (likely due to the housing shortage just after COVID).
Comparing the CCR to the OCR, we can see the gap peaked in 2018 at over $1.09 million, then proceeded to drastically narrow to just around $734,000 in 2023. It has since widened a little again in 2024 (a gap of around $902,000), but this is nowhere close to past years.
In practical terms, what does this mean in the near future?
In an earlier article, we noted that the next slew of new launch projects would be in the CCR; and that attention will likely pivot to this region. As you can see from the narrowing price gaps above, there’s a good reason why some might consider the CCR undervalued right now.
That said, it will still be a challenge to upgrade from an OCR to a CCR property (an average $902,000 price gap as of 2024), even if the OCR is fast catching up. The RCR to CCR price gap may be more manageable, at a difference of around $746,000.
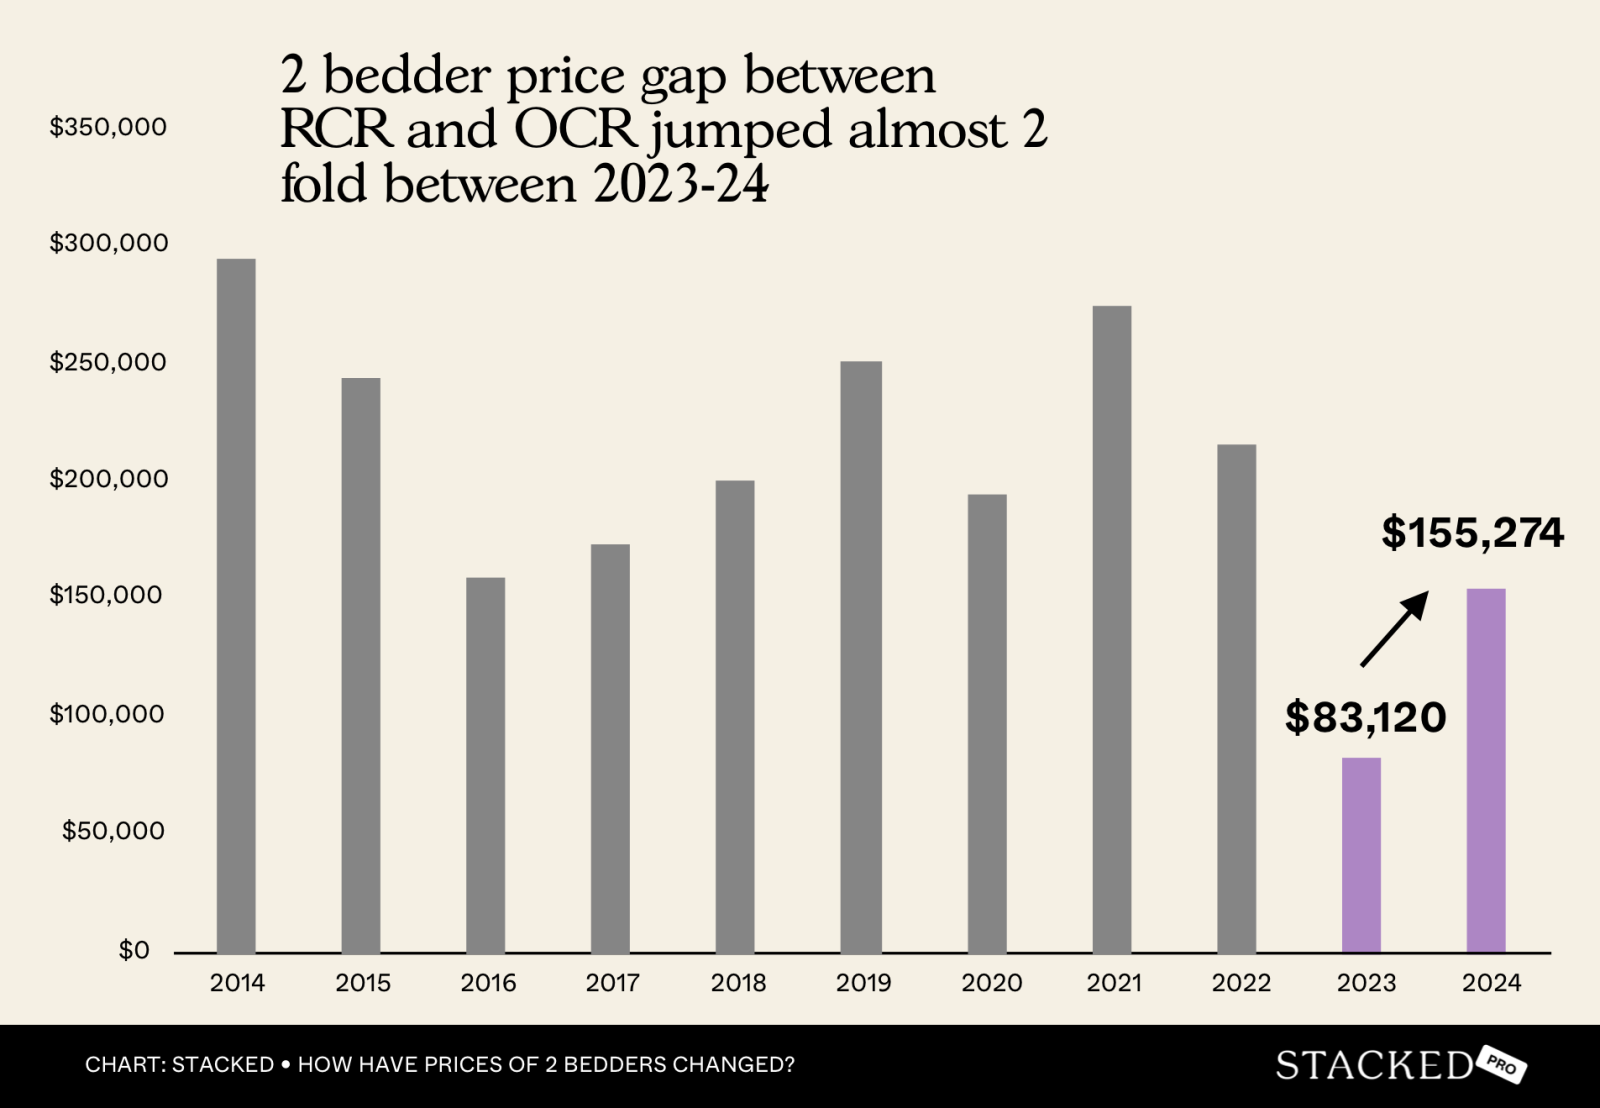
A more feasible upgrade path may be from the OCR to the RCR in the coming year. Even though the price gap has widened since 2023 (back then the RCR-OCR gap was just around $83,000), the 2024 price gap is about $155,000, which is not unrealistic, especially for those who bought earlier and have seen their properties appreciate.
For these buyers, the RCR still offers better connectivity and greater convenience, without pricing them out. The problem is that all the new launches we’re seeing right now (2025) are within the CCR; and resale supply is tight (prices are high, so many won’t sell because they can’t afford the replacement property)
In this case, upgrading from OCR to RCR becomes financially realistic — especially if you bought before prices surged.
Here’s an example: A buyer purchases a two-bedder at The Alps Residences (OCR) for $850,000 in 2019. In 2025, it’s valued at around $1.2 million, resulting in approximately $400,000 in proceeds after settling the outstanding loan and CPF refund. This may be enough to upgrade to a two-bedder at Myra in the RCR, which currently transacts at around $1.6 million — requiring a top-up of about $400,000, which can be covered through a combination of CPF and cash.
So whilst OCR to RCR may be a reasonable upgrade, it boils down to whether our OCR upgraders can even find anything to buy.
Next, let’s look at the price movement based on the transaction type (new sale, resale, sub-sale, etc.)
These are the new sale transactions by price psf:
| Year | Avg $PSF by market segment | ||
| CCR | RCR | OCR | |
| 2014 | $2,197 | $1,598 | $1,220 |
| 2015 | $2,122 | $1,532 | $1,193 |
| 2016 | $2,242 | $1,506 | $1,266 |
| 2017 | $2,216 | $1,562 | $1,276 |
| 2018 | $2,872 | $1,709 | $1,510 |
| 2019 | $2,710 | $1,802 | $1,590 |
| 2020 | $2,590 | $1,841 | $1,647 |
| 2021 | $2,697 | $2,056 | $1,718 |
| 2022 | $2,811 | $2,333 | $2,103 |
| 2023 | $2,900 | $2,652 | $2,378 |
| 2024 | $3,124 | $2,678 | $2,332 |
| Annualised | 3.58% | 5.30% | 6.70% |
These are the new sale transactions by quantum:
| Year | Avg price by market segment | ||
| Year | CCR | RCR | OCR |
| 2014 | $2,031,899 | $1,240,349 | $890,584 |
| 2015 | $1,679,079 | $1,131,173 | $839,641 |
| 2016 | $1,967,252 | $1,066,275 | $899,264 |
| 2017 | $1,800,638 | $1,136,083 | $927,831 |
| 2018 | $2,382,656 | $1,188,893 | $1,024,927 |
| 2019 | $2,054,555 | $1,259,665 | $1,087,984 |
| 2020 | $1,816,198 | $1,290,466 | $1,141,166 |
| 2021 | $1,945,572 | $1,477,218 | $1,228,963 |
| 2022 | $2,066,818 | $1,715,041 | $1,514,856 |
| 2023 | $2,287,247 | $1,926,662 | $1,693,123 |
| 2024 | $2,674,982 | $1,937,666 | $1,616,400 |
This is what the price movement looks like:
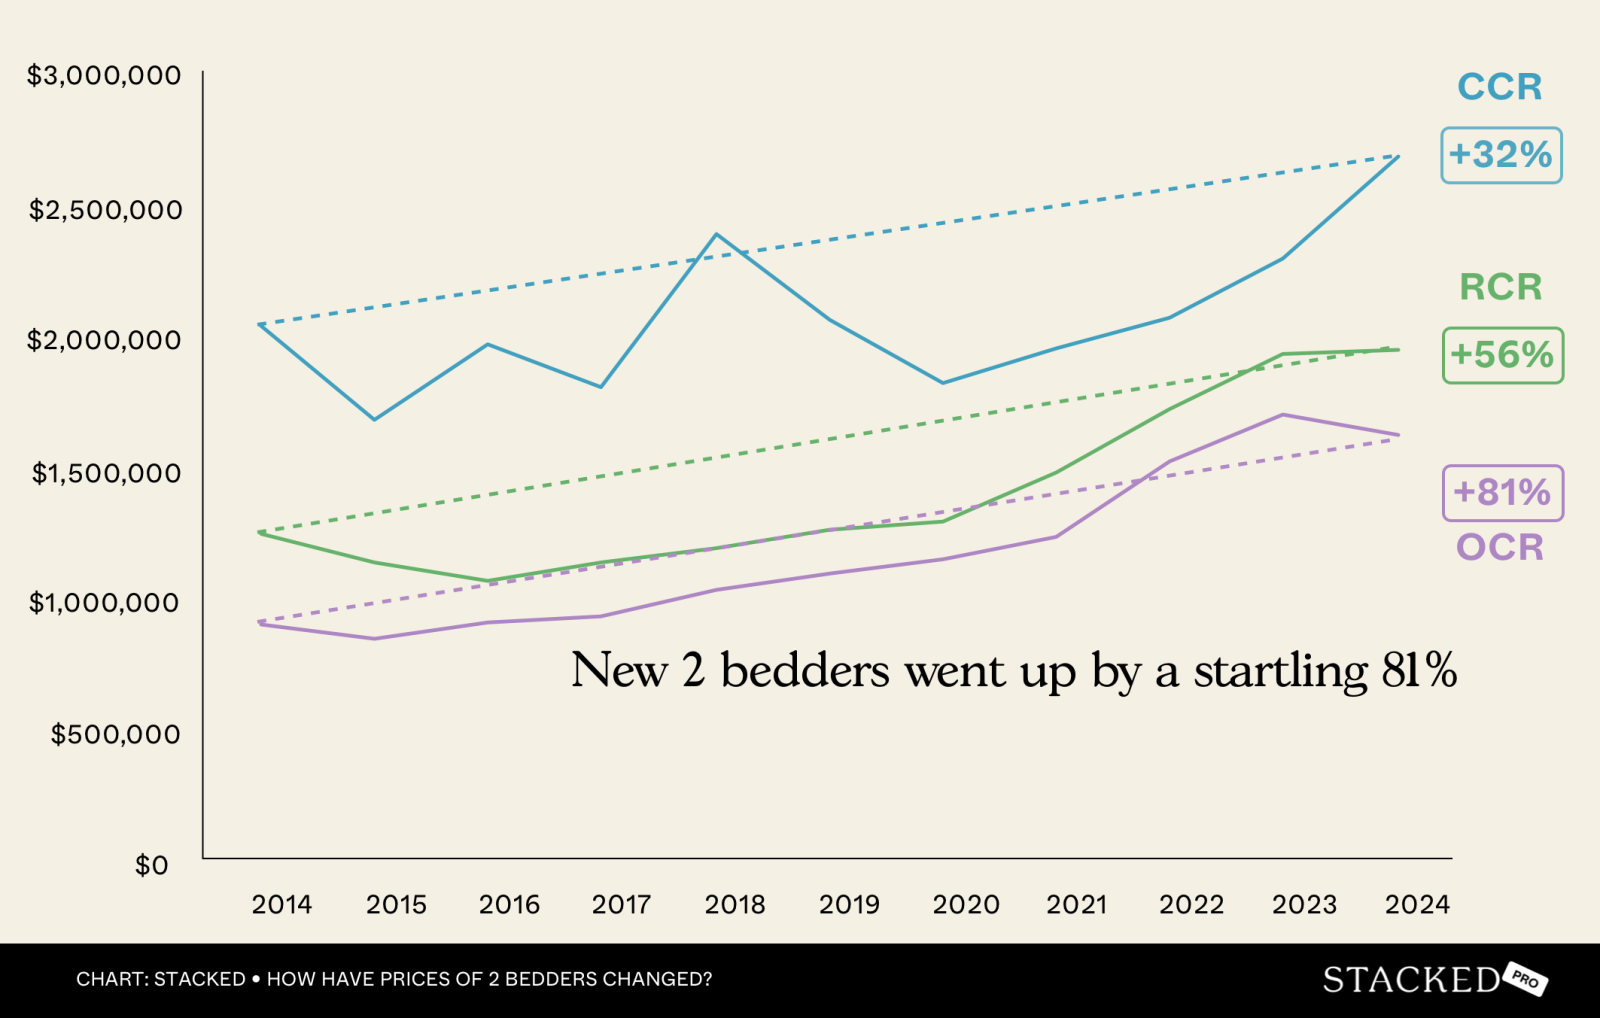
What we saw for average prices is even more amplified, when we look at developer sales. The numbers from the OCR are quite shocking: new sale prices, in terms of quantum, have gone from $891,000 to $1.62 million in 10 years. That’s an increase of over 81 per cent in a single decade, a lot of which can be attributed to the 2021 to 2023 post-COVID period.
The current new launch two-bedder price is nearing $1.6 million — a key psychological threshold, as this used to be the typical price for larger, family-sized units (like three-bedders) in OCR new launches.
It’s easy to see why some buyers might prefer RCR new launches — if they were available. Prices here have climbed to around $1.94 million, which, while higher, isn’t drastically more than the $1.6 million now seen in OCR new launches.
And whilst the CCR has seen much slower growth, the recent average of around $2.67 million still leaves many OCR and RCR buyers priced out. From what we are hearing, a price point of $1.8 million to around $2.1 million is about the limit for most Singaporeans.
Now let’s look at sub sale and resale transactions
This is the price movement by price psf:
| Year | Avg $PSF by market segment | ||
| CCR | RCR | OCR | |
| 2014 | $1,729 | $1,254 | $1,080 |
| 2015 | $1,668 | $1,220 | $1,040 |
| 2016 | $1,796 | $1,187 | $1,031 |
| 2017 | $1,862 | $1,248 | $1,082 |
| 2018 | $1,960 | $1,430 | $1,123 |
| 2019 | $2,010 | $1,489 | $1,109 |
| 2020 | $1,920 | $1,384 | $1,132 |
| 2021 | $1,935 | $1,473 | $1,199 |
| 2022 | $2,028 | $1,634 | $1,328 |
| 2023 | $2,157 | $1,773 | $1,482 |
| 2024 | $2,333 | $1,892 | $1,557 |
| Annualised | 3.04% | 4.20% | 3.73% |
This is the price movement by quantum, for sub sale and resale:
| Year | Avg price by market segment | ||
| CCR | RCR | OCR | |
| 2014 | $1,803,835 | $1,204,459 | $1,040,448 |
| 2015 | $1,760,747 | $1,134,880 | $1,007,923 |
| 2016 | $1,864,998 | $1,131,969 | $973,950 |
| 2017 | $1,823,399 | $1,159,879 | $1,018,899 |
| 2018 | $2,016,329 | $1,307,841 | $1,026,330 |
| 2019 | $2,007,029 | $1,414,851 | $993,641 |
| 2020 | $1,969,447 | $1,222,165 | $1,007,914 |
| 2021 | $1,937,744 | $1,282,412 | $1,051,818 |
| 2022 | $1,973,127 | $1,331,035 | $1,126,786 |
| 2023 | $2,047,248 | $1,412,442 | $1,217,940 |
| 2024 | $2,211,578 | $1,496,816 | $1,275,282 |
| Returns | 22.60% | 24.27% | 22.57% |
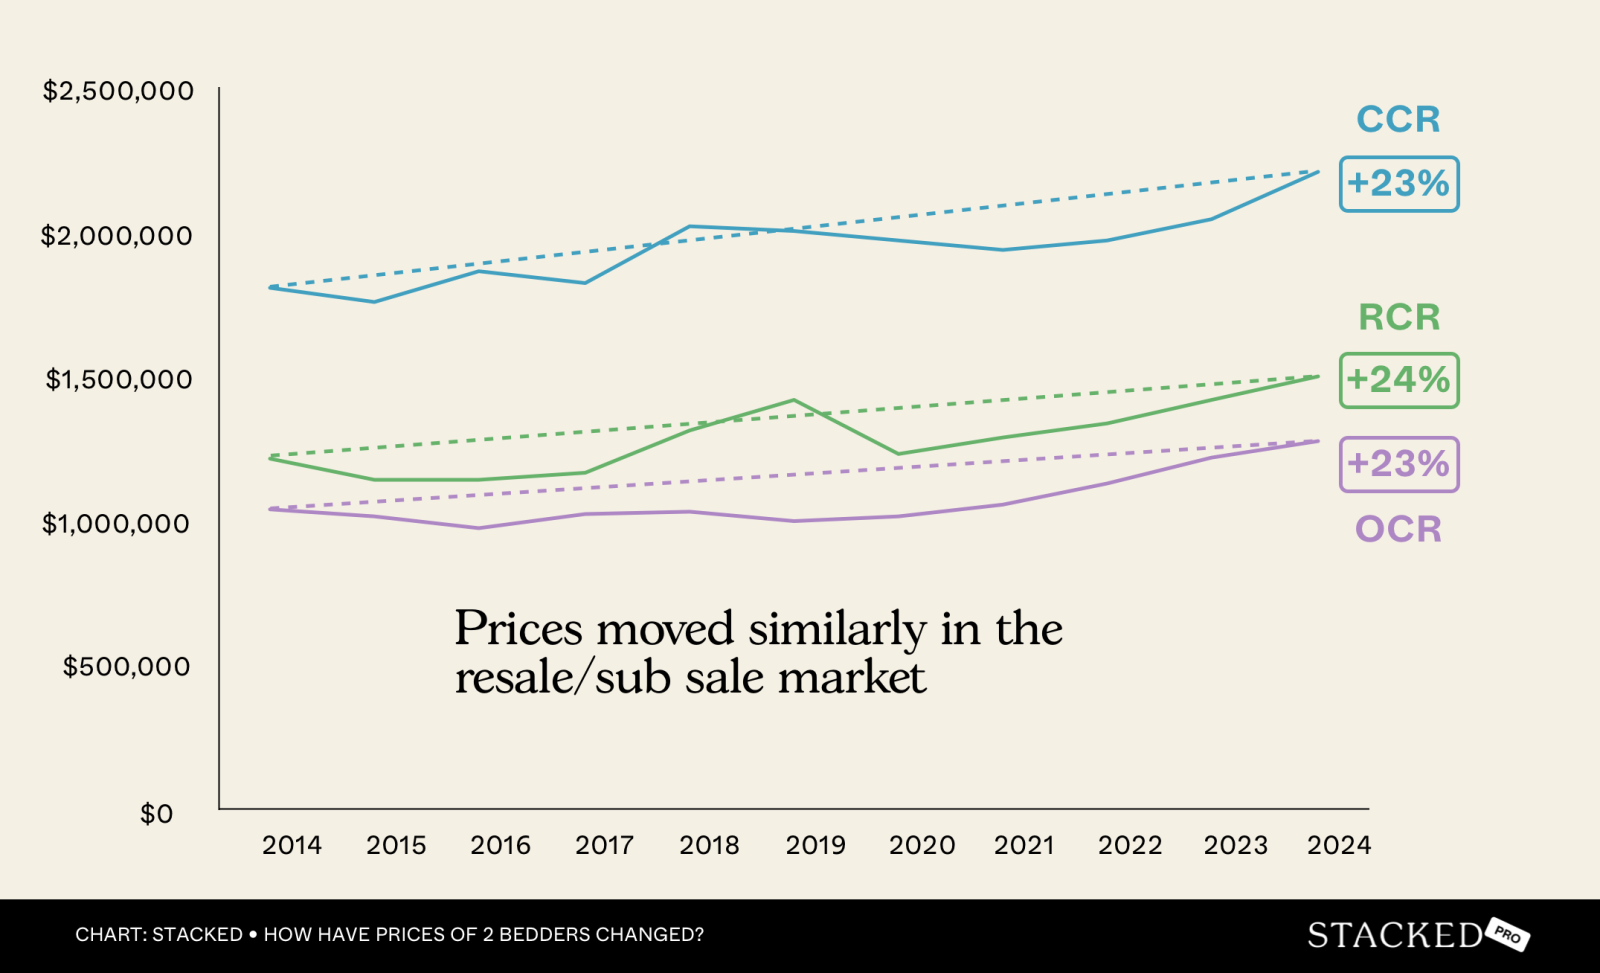
CCR condos maintain a high price psf in the secondary market, but there has been a persistent softness over the past decade. Quantum crept from a modest $1.8 million to $2.21 million over 10 years – and the price movement was fairly flat until the 2017 to 2022 period.
From word on the ground, one qualitative factor is the improvement in RCR and OCR condos. Some of the newer OCR condos have facilities and finishing that would rival or even outdo older CCR condos: what was once considered luxury (e.g., multiple large pools, high-end countertops, private pavilions) has become common, and can be found even in mass-market condos today.
The general observations here are that, first, for new sale CCR two-bedders, the price movement is much more volatile than resale CCR two-bedders. Second, for two-bedders in the RCR and OCR, be they new sale or resale, the price growth is quite linear.
The most interesting takeaway though, is that the price gap between new and resale two-bedders in the different segments is narrowing. Consider the following, which shows the narrowing gap between new and resale two-bedders:
| Year | Resale CCR to new RCR | Resale CCR to new OCR | Resale RCR to new OCR |
| 2014 | 31.24% | 50.63% | 26.06% |
| 2015 | 35.76% | 52.31% | 26.02% |
| 2016 | 42.83% | 51.78% | 20.56% |
| 2017 | 37.69% | 49.12% | 20.01% |
| 2018 | 41.04% | 49.17% | 21.63% |
| 2019 | 37.24% | 45.79% | 23.10% |
| 2020 | 34.48% | 42.06% | 6.63% |
| 2021 | 23.77% | 36.58% | 4.17% |
| 2022 | 13.08% | 23.23% | -13.81% |
| 2023 | 5.89% | 17.30% | -19.87% |
| 2024 | 12.39% | 26.91% | -7.99% |
The resale-to-new sale gaps aren’t just narrowing, they’ve even reversed in some segments. For example:
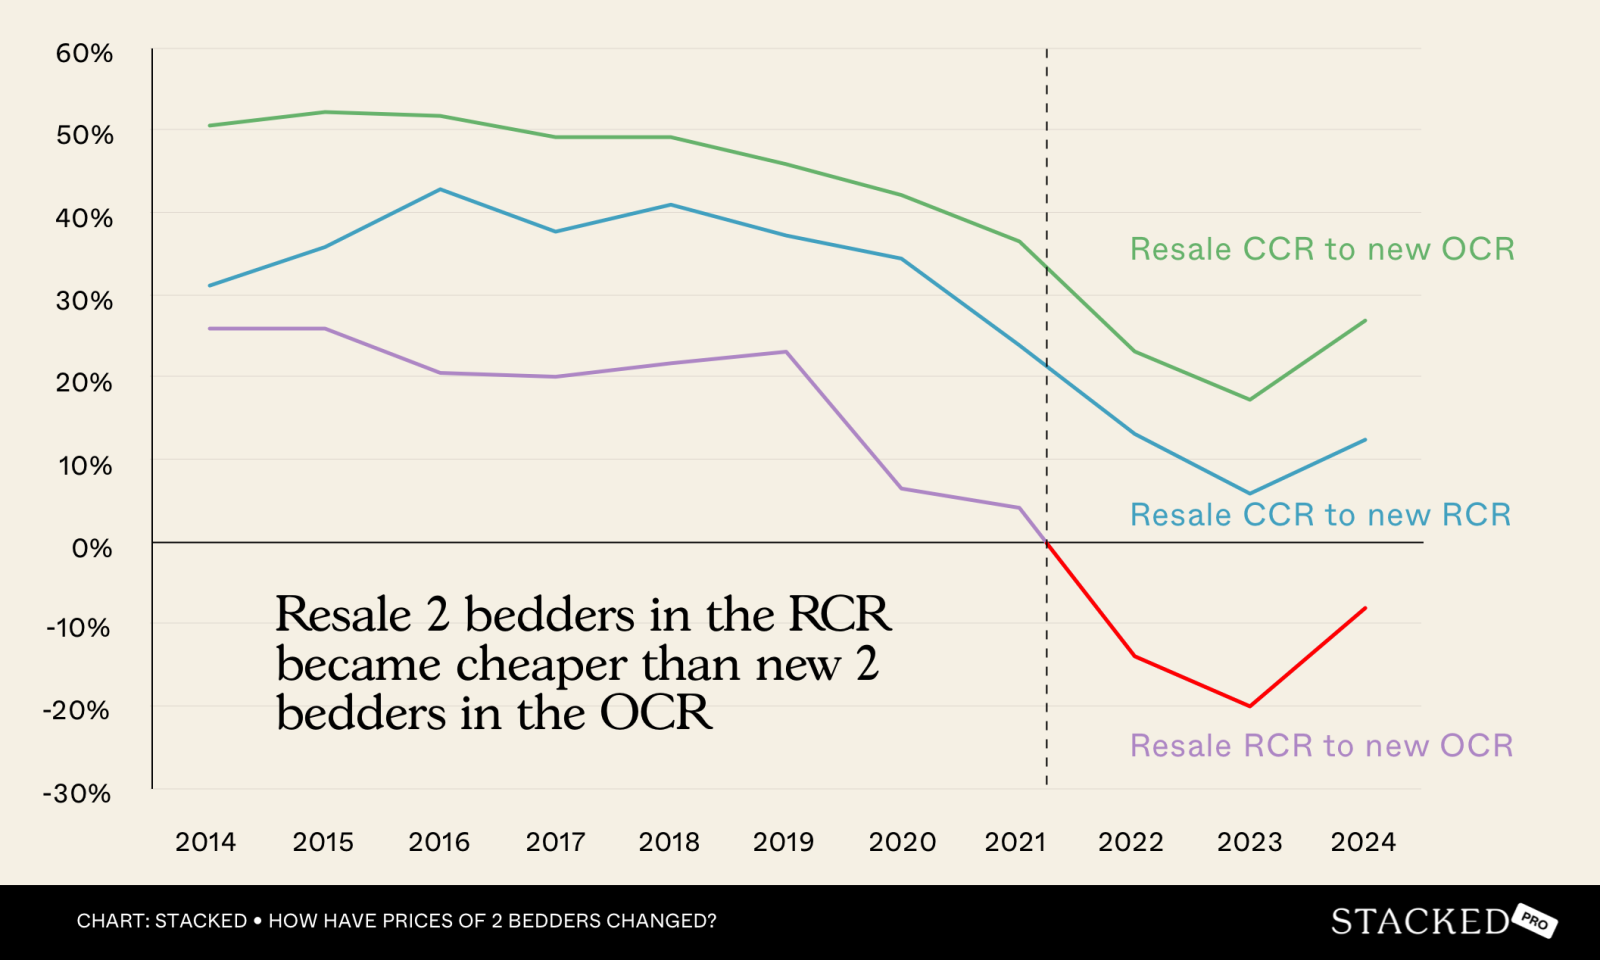
In 2014, a resale two-bedder in the RCR was 26 per cent more expensive than a new launch two-bedder in the OCR. But in 2024, the average resale RCR unit is now eight per cent cheaper than a new launch in the OCR!
Let’s look at it in terms of overall price difference:
| Year | Resale CCR to new RCR | Resale CCR to new OCR | Resale RCR to new OCR |
| 2014 | $563,486 | $913,251 | $313,875 |
| 2015 | $629,574 | $921,107 | $295,240 |
| 2016 | $798,723 | $965,734 | $232,705 |
| 2017 | $687,316 | $895,568 | $232,048 |
| 2018 | $827,436 | $991,402 | $282,914 |
| 2019 | $747,364 | $919,045 | $326,867 |
| 2020 | $678,981 | $828,281 | $80,999 |
| 2021 | $460,526 | $708,781 | $53,449 |
| 2022 | $258,086 | $458,271 | -$183,821 |
| 2023 | $120,586 | $354,124 | -$280,681 |
| 2024 | $273,912 | $595,179 | -$119,584 |
From 2014 to 2019, the average resale RCR two-bedder was around $230,000 to $330,000 more than a new OCR unit.
But by 2022, a resale RCR unit became cheaper than a new OCR unit; and this gap reached around $280,000 in 2023.
In 2024, the RCR bounced back a bit, but the average resale unit here was still around $120,000 cheaper than the average new launch OCR unit!
In short, buyers who are willing to purchase a resale two-bedder could settle for an RCR location, instead of a new launch that’s in the OCR.
The CCR is probably still too ambitious for most in the OCR though, with a sizeable gap of $274,000 to $595,000 in 2024. But for those who already own an RCR property, this is an interesting opportunity.
Consider, for instance, the two projects of Jadescape and Martin Modern:
A resale two-bedder in Jadescape (764 sq. ft.) fetched a price of $1.745 million in March 2025. Jadescape is in District 20 in the RCR. Just around four months before, in November of 2024, a 764 sq. ft. two-bedder was sold in Martin Modern, in District 9. The price for the CCR unit was $1.97 million.
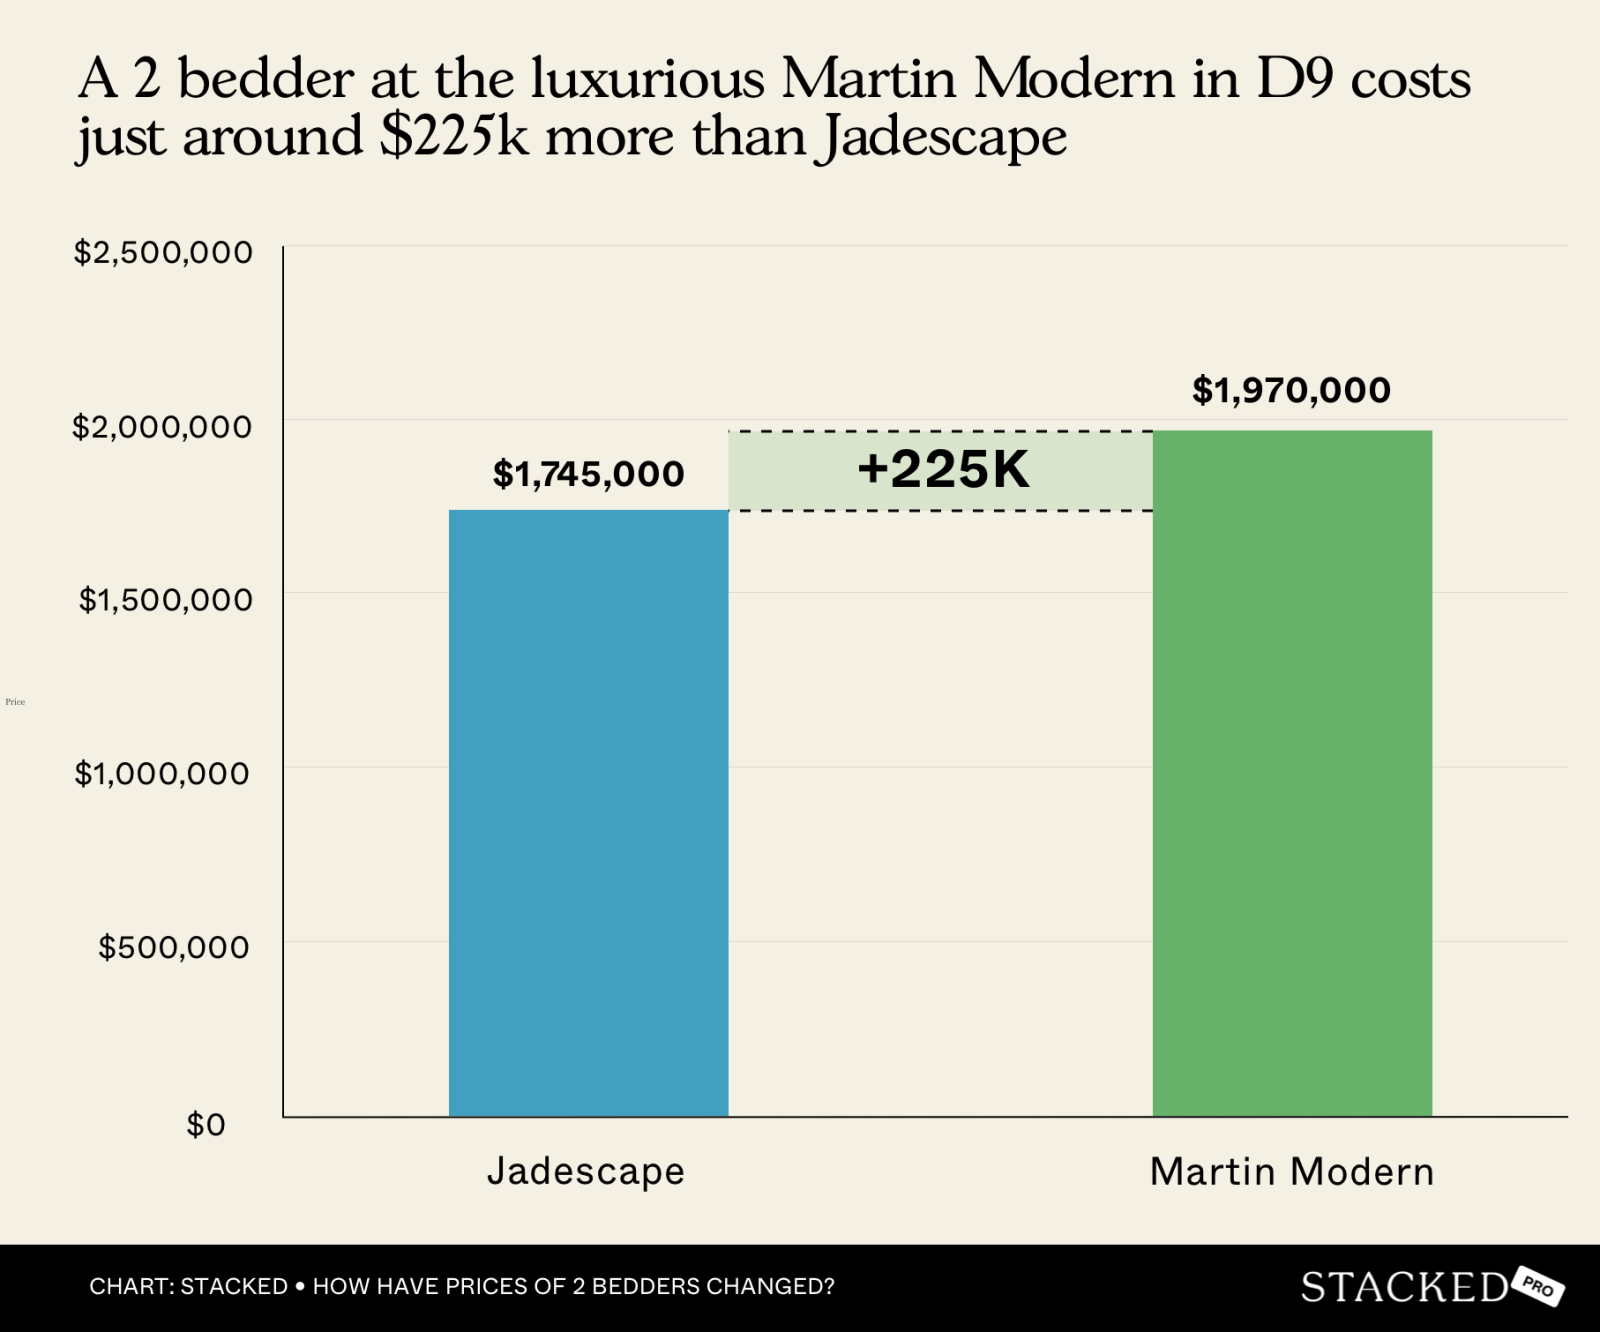
For this price gap of $225,000, the difference would have been the better finishing of a luxury condo (Martin Modern), a River Valley/Orchard area, and greater exclusivity: there are 450 units in Martin Modern compared to 1,206 units in Jadescape. Both projects also launched around a year apart by the way (July 2017 for Martin Modern and June 2018 for Jadescape,) so this is not a matter of age.
You can probably see how this narrow price gap makes the CCR look attractive to RCR upgraders; it would be an easily affordable step-up.
In short, the price landscape for two-bedders has shifted dramatically — and so have the opportunities. For buyers open to resale, the narrowing gap with new launch prices could mean better value in more central locations. And for upgraders, timing and past gains may open doors to regions that once felt out of reach. As always, it’s less about chasing the lowest price — and more about making the smartest move based on where you’ve started, and where you want to go.
In the next part of this article on two-bedders, we’re going to find out where two-bedders have narrowed the price gap with three-bedder units. We’re going to name the condos in question, so you’ll be able to find where, for the price of a new launch two-bedder, you could buy a resale three-bedder instead.
Follow us on Stacked for this update coming soon. If you’d like to get in touch for a more in-depth consultation, you can do so here.


