

Yanni Angelakos, Head of Investment Insights, Nasdaq Capital Access Platforms
Mike Cho, CFA, Senior Research Analyst, Nasdaq Capital Access Platforms
Tony Kristic, Senior Research Analyst, Nasdaq Capital Access Platforms
Strong fundamentals lead the equity bounce amidst the rotation
- Corporate earnings remain the dominant force shaping equity returns, but the nature of the conversation is evolving
- Equity market churn continues under the index level
- Fed is shifting the onus of tightening conditions onto the markets as real rates drive the increase in nominal yields
Biweekly Chart in Focus: Banks, small caps & international equities outperforming since Nasdaq-100 Index® (Nasdaq-100®) June 2nd highs
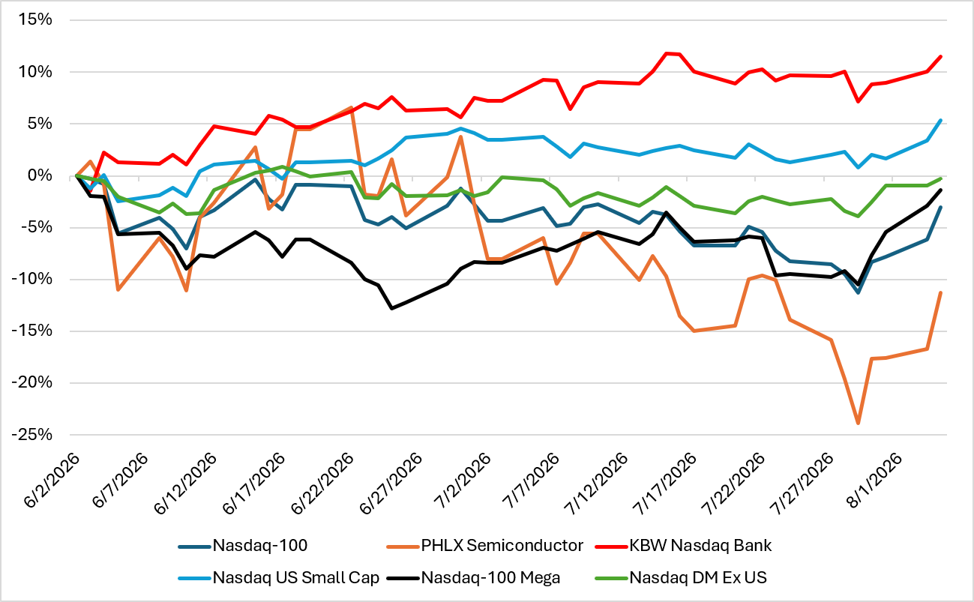
Source: Bloomberg. As of August 4, 2026.
Summary
The past two weeks offered investors a masterclass in the gap between headline beats and market reactions. Corporate earnings remained the dominant force shaping equity returns—but the nature of the conversation is shifting. It is no longer enough to beat the number. Markets are now interrogating the cost of growth, the durability of AI-driven demand, and the credibility of capital allocation decisions.
While the S&P 500 Index just surpassed its June 2nd highs and the Nasdaq-100 Index® (Nasdaq-100®) is now only -3% from its respective high (as of August 4th), it is the continuing rotation under the index surface on which investors are focused. As our Biweekly Chart in Focus shows, the likes of banks, small caps, and international equities have outperformed the mega cap tech space—notably semiconductors fell by 28.6% at their lows.
The tech giants have made up ground as investors have digested earnings and on the latest standing down of a reescalation of military actions in Iran which has pushed oil prices from their highs of over $90/bbl (WTI crude). Despite higher energy costs—e.g., WTI is still 17% from its recent lows in early July—the U.S. economy remains on very solid footing, increasingly driven by AI. Coupled with investors coming to grips with a new communication path by the Federal Reserve, markets are recalibrating Fed expectations.
Post the Fed’s July 29th meeting, the bond market appears to be pricing in a “hold for now, hike later” scenario. For equity investors, the Fed’s posture matters most through its effect on the discount rate and on financial conditions. A Fed that is increasingly hawkish at the margin—even if not yet acting—can be a headwind for long-duration growth assets. It can also reinforce the case for quality and value over speculative growth.
Details
An informative Q2 2026 earnings season
The week of July 27th was the most consequential of earnings seasons so far, with Microsoft, Meta, and Amazon reporting within a day of each other. Add in Alphabet from the prior week and all of these stocks are higher since their respective earnings reports. However, the markets had initially not uniformly celebrated these companies’ results as the markets rewarded names that can demonstrate AI monetization today (Microsoft, Amazon) while they penalized those where the spending story runs ahead of the revenue story (Alphabet, Meta). This is a notable evolution from earlier in the year when capex ambition alone was sufficient to excite investors—Nasdaq Index Insights issued a recent report on this topic.
84% of the Nasdaq-100 Index companies that have reported have beaten Q2 EPS and 88% have beaten revenue estimates. This takes the blended (actuals+estimates) Nasdaq-100 earnings growth rate for Q2 to 75.1%, significantly higher than the forecasted growth rate of 28.9% (per FactSet) and would be the 13th straight quarter of double-digit gains. However, this earnings growth rate is heavily skewed by unrealized gains by Alphabet (net gain of $98 billion primarily due to its SpaceX equity stake) and Amazon (largely related to its stake in Anthropic of approximately $53 billion).
Per FactSet, as of the week ending July 31st, the blended S&P 500 earnings growth rate for Q2 rose to 47.4% from 38% YoY the week prior (Figure 2). This would make Q2 the largest quarterly earnings growth YoY since Q2 2021, which was driven by the Covid-19 base effect.
Excluding Alphabet and Amazon, the blended S&P 500 earnings growth rate would fall to 28.8% YoY. While a notable drop, it would still mark the second straight quarter of earnings growth of 20%+ YoY and 7th consecutive quarter of double-digit earnings growth.
On an aggregate basis, S&P 500 companies are reporting earnings that are 31.4% above expectations, which would make it the largest earnings surprise since this metric began in 2008 (FactSet). Again, though, this is driven by the large EPS surprises by Alphabet and Amazon; without these names, it is estimated to fall to 9.2% from 31.4%—making it important to look beyond the headline prints.
Figure 2: S&P 500 earnings growth (YoY%)

Source: FactSet
Despite this impressive rate of earnings beats, per Figure 3, the markets are rewarding companies less on beats while punishing companies less on misses relative to respective 5-year averages (FactSet).
Figure 3: S&P 500 companies’ average price reactions to Q2 earnings surprises vs. 5-year averages (-2 to +2 days around earnings releases)

Source: FactSet
Just churnin’
Although the S&P 500 has surpassed its June 2nd highs and the Nasdaq-100 has quickly bounced out of a technical correction from its recent nadir of -11.3% on July 29th, investors appear to be more focused on the churning of leadership under the index level. Staying within the technology space, S&P 500 Software and Services has outperformed the S&P 500 Semiconductor industry group by nearly 19% QTD as of August 4th. This intra-sector rotation has been driven by software recovering from AI disruption fears and strong earnings, while semis have sold off on concerns over the sustainability of AI capex and China competition.
Stepping back, while 56% of net S&P 500 sector level contributions YTD are coming from the Growth-oriented sectors of technology and communication services, this is almost entirely driven by technology (Figure 4). This compares with 75% of net S&P 500 returns coming from these two sectors in YTD 2025 through August 1st via a more balanced contribution (Figure 5). This speaks to Value sectors carrying more of the YTD returns in 2026 on a sector-weighted basis.
Figure 4: Decomposition of 2026 YTD price returns as of August 1, 2026

Figure 5: Decomposition of 2025 YTD price returns as of August 1, 2025

Source: Bloomberg AI. As of August 1, 2026. Notes: *Sector weights as of January 1st in each respective year may not add to 100% precisely. **Sector Factor Orientation proxy derived by: SGX weight > SGV weight = Growth; SGV weight > SGX weight = Value. ***Charts’ actual total YTD returns vary slightly from actual S&P 500 YTD returns as of respective August 1st dates due to intra-period constituent changes, rebalancing, sector sub-index compositions not perfectly identical to official GICS breakdowns within S&P 500.
After reaching +1 standard deviations versus the 10-year average, the S&P 500 equal-weighted index remains slightly positive on a 6-month rolling basis relative to the S&P 500 cap-weighted. Stepping back, Figure 6 shows the powerful bounce the S&P 500 equal-weighted has had since the -2 standard deviation levels in October 2025. As we noted in our prior piece, the equal-weighted indexes have outperformed since the June 2nd highs—a dynamic to continue to watch as equity returns have broadened.
Figure 6: Equal-weighted equities have rallied strongly vs. cap-weighted since Q4 2025

Source: Bloomberg
A “higher-for-longer” Fed policy repricing
The FOMC voted 9-3 on July 29th to hold the benchmark federal funds rate in the 3.5% to 3.75% range. The three dissenters all favored a 25-basis point hike. Chair Warsh has sought to streamline the policy statement and pivot away from heavy forward guidance as he seeks to shift the “responsibility” of tightening financial conditions to the markets rather than relying on the Fed. We are only two meetings into the new Chair’s term, but the markets are clearly adjusting to this new path forward. Baird Strategas notes that since 1914, the average drawdown in the first year of a Fed Chair’s term is 17% while the average drawdown in each calendar year is 14% (based on the DJIA).
The Fed’s hawkish dissent and the Chair’s desire to eliminate forward guidance—increasing risk premia—pushed Treasury 10-year yields towards 4.75% (highest since January 2025) and 30-year yields towards 5.30% (20-year highs). Coupled with elevated oil prices, these are not yet systemic risks, but they can morph into constraints on multiple expansion. In that environment, earnings delivery is not just the primary driver of returns—it is the only reliable one—making the current earnings strength even more important.
In our May 21st report we noted that the YTD change in nominal Treasury 10-year yields was, at the time, led almost entirely by changes in inflation expectations through May 11th. As of May 15th, the pendulum began swinging towards changes in real rates driving the rise in 10-year yields and since late April, breakevens have fallen around 20 bps while real rates have risen by around 57 bps. This has also been reflected in the widening of the yield curve as the spread between Treasury 2-year and 10-year yields reached a 2-month high at the end of July with both the short- and long-end of the curve selling off.
While not an exact science given the confluence of drivers in the roughly $33 trillion U.S. Treasury market, based on this high-level view the increase in real rates has accounted for nearly 97% of the entire move in nominal yields YTD (Figure 7). Net-net: the market is pricing tighter real policy without a corresponding lift in inflation expectations—a sign of the Fed being (or being expected to remain) restrictive relative to where inflation is settling.
Figure 7: YTD decomposition of nominal Treasury 10-year yield change

Source: Bloomberg. As of 7/31/26. Notes: “Fisher residual” stems from using the Fisher equation as the means of decomposition: Nominal ≈ Real + Breakeven is a direct application of Irving Fisher’s equation.
Resilient equity and credit markets also point to economic growth expectations fueling the rise in real rates. These growth expectations are another byproduct of the AI economy as Capital Economics estimates that roughly one-third of recent U.S. economic growth is AI-related via the capex and household wealth channels. Solid U.S. economic activity is a key underpinning for earnings which, in turn, are the key underpinning for equity returns. As a proxy of broader economic activity, the July ISM Manufacturing gauge hit its highest since May 2022, signaling ongoing strong demand. Leading components such as new orders, employment, and production all rose sequentially while prices paid cooled slightly.
Figure 8 shows the relationship between YoY changes in ISM Manufacturing and the Nasdaq-100 for a smoothed-out view. There has been a divergence recently given the aforementioned equity rotation since early June. However, as economic activity has remains solid, we view this more of a micro versus a macro dynamic.
Figure 8: ISM Manufacturing vs. Nasdaq-100 YoY

Source: Bloomberg
See how the data supports the story — explore the Global Markets Dashboard below.
Disclaimer:
Nasdaq®, Nasdaq-100®, and Nasdaq Stock Market® are registered trademarks of Nasdaq, Inc. The information contained above is provided for informational and educational purposes only, and nothing contained herein should be construed as investment advice, either on behalf of a particular security or an overall investment strategy. Neither Nasdaq, Inc. nor any of its affiliates makes any recommendation to buy or sell any security or any representation about the financial condition of any company. Statements regarding Nasdaq-listed companies or Nasdaq proprietary indexes are not guarantees of future performance. Actual results may differ materially from those expressed or implied. Past performance is not indicative of future results. Investors should undertake their own due diligence and carefully evaluate companies before investing. ADVICE FROM A SECURITIES PROFESSIONAL IS STRONGLY ADVISED.
© 2026. Nasdaq, Inc. All Rights Reserved.