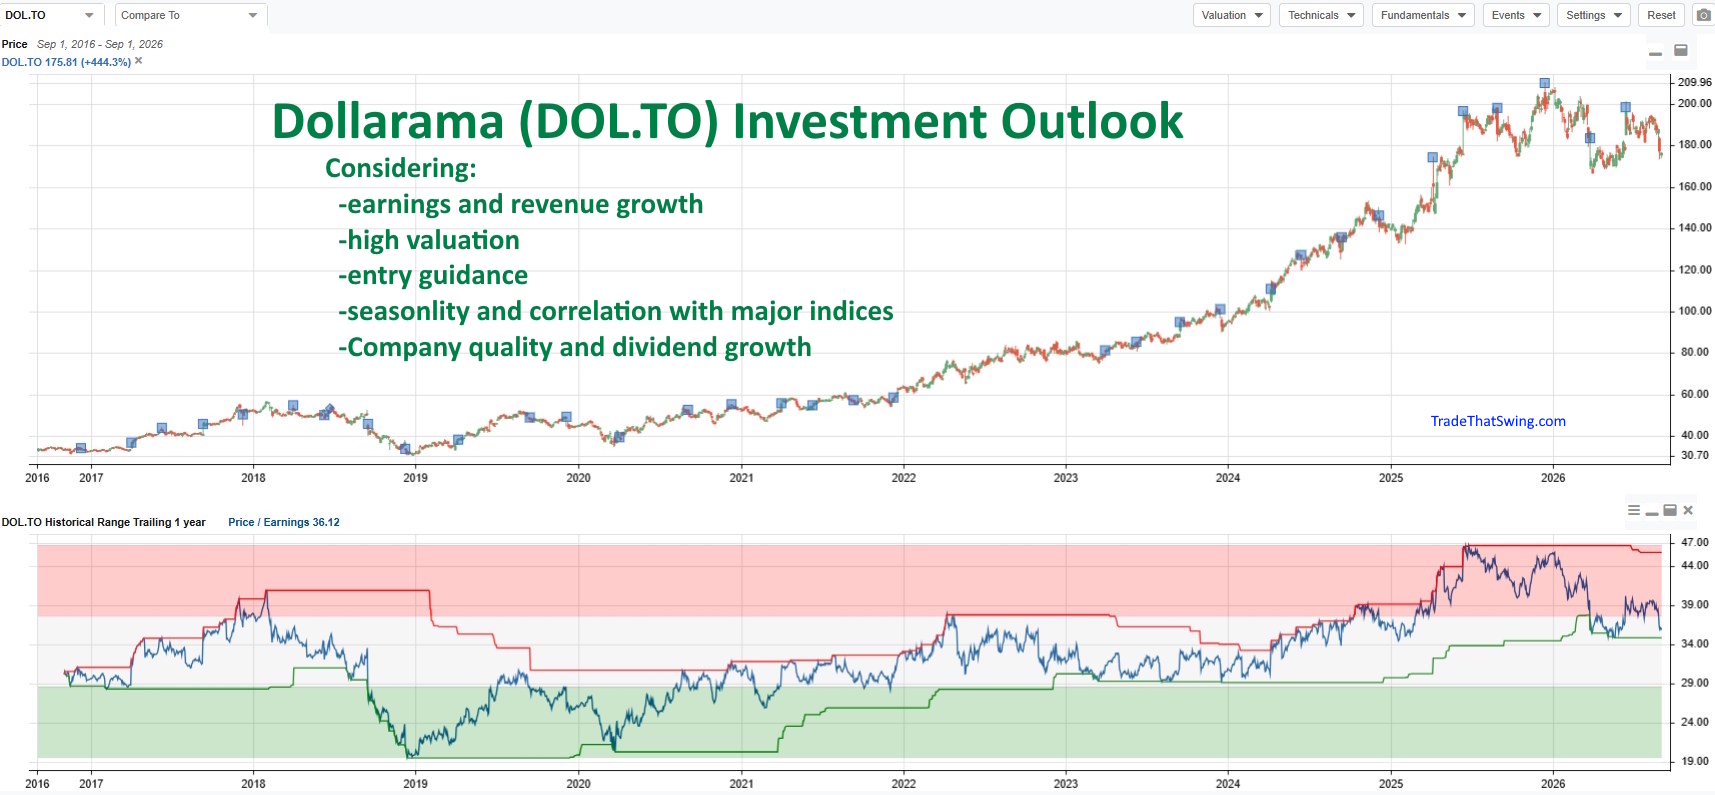

Dollarama is one of the few Canadian stocks to pass the stringent criteria and make it onto the Best Buy and Hold Stocks List.
Let’s dig into whether this company is worth investing in.
- 17% yearly EPS growth estimate over the next five years (9.9% median expected average for S&P 500 stocks)
- Annualized return over last 10 years: 14.6% (11.1% for S&P 500)
- 20.4% yearly EPS growth over the last five years (8.3% for S&P 500)
Basically, this company is growing earnings faster than most S&P 500 stocks, and the stock returns reflect that by outperforming over the last five and 10 years.
All data from StockRover, which also computes a Fair Value (based on discounted cash flows) of $150.21 for the stock, which currently trades near $175. This suggests the stock may be slightly overvalued; more on valuation later.
Among US and Canadian companies, it ranks in the top few percentiles for earnings and revenue growth and is also ranked high for quality (based on financial ratios).

The valuation score isn’t great at the moment, as discussed above (and more below).
The sentiment rank is currently fairly low, as the stock is already about 16% below its late-2025 all-time high. It fell as much as 21% from the high early in 2026. A lower stock price and/or rising earnings can improve the valuation issue.
Dollarama Decline and Rally Percentages
Over the last 10 years, buying on declines of roughly 15% to 20% has provided good entry points. While there have been two declines of more than 30% (41% and 33%), generally the stock has seen significant bounces after an approximate 15 to 20% decline.
Chart from TradingView (use like to save $15 on packages)

Rallies following declines—similar to the current one—aren’t always a straight shot higher. The stock can chop around, sometimes for years, rallying 20% to 70% with 15% or greater declines in between.
While profit targets could be used, there is also the option to exit based on the factors discussed in this article. If the company is continuing to perform well (earnings growth, revenue growth), over time the stock price will likely reflect that. If the company stumbles or fails to grow, it may be time to move on to other opportunities.
Dollarama Dividends
DOL.TO has steadily increased its dividends, and those dividends provide some cash flow when the stock isn’t moving higher.
According to StockRover, Dollarama has increased its dividend amount by 13.7% per year over the last decade. While the yield is only 0.3%, keep in mind that it’s low because the stock has increased nearly 19% per year, while dividends have increased by less than that.
In simple terms, the stock has produced strong long-term returns, and the cash flow (via dividends) from owning it has doubled about every six years.
Full-year dividends for 2026 are expected to be $0.47.

Dollarama Stock Performance By Month / Seasonality
According to StockRover, since 2009, August, October, December, and January tend to be weaker months. August and December are positive, but not as strong as other months.
Longer-term investors can potentially benefit by buying DOL.TO in weaker months. As mentioned, the stock has been down 15% to 20% over the last couple of months.

Dollarama Valuation
DOL.TO has a P/E of 36 according to StockRover, which is higher than the S&P 500 average and most of its competitors. Yet, as discussed, the company also has higher growth than most companies, which typically means people are willing to pay a higher multiple to own that stock.
The company has grown earnings very steadily, and that is expected to continue, so the Forward P/E is slightly lower at 30.1.
The following StockRover chart shows the stock has just started to fall out of elevated valuation territory. Historically, buying in the green area or near the bottom of the middle white area has provided the most safety on entries.

Dollarama Correlation with Market Indices
Investors often look to the major market indices for clues on when to buy stocks. For example, if the S&P 500 is weakening, an investor may wait to buy the stock at a better (lower) price.
That approach may work with DOL.TO, but not always. While it has risen along with the S&P 500 over the last decade, they don’t track each other very well (same goes for the TSX Composite Index). There are extended periods where DOL.TO will fall while the S&P 500 is rising, and when DOL.TO will rise while the S&P 500 is falling. Then there are periods when they move together.
The correlation coefficient whipsaws between near 1 and near -1. On the chart below, both SPY and DOL.TO have their own axis to make it easier to compare directional movements. This is not a performance comparison: DOL.TO has far outperformed SPY over this time frame (862% vs 348%). Chart from TradingView.

Consider market conditions/indices, but Dollarama does its own thing a lot of the time.
Dollarama Investment Outlook Final Word
DOL.TO has a long history of increasing earnings, which helped the stock significantly outperform the S&P 500 over the long run.
While the dividend yield isn’t high, the company has steadily increased the dividend amount, which is favorable for investors looking for a balance of increasing dividend cash flow over time, with the potential for above-average returns as well (if the company continues to perform well).
Declines of 15% or greater have historically been good buy points, like right now, yet the stock does show signs of being overvalued. It is a great company and has been a great stock. Opportunities to pick this one up on deeper declines have historically been worth seizing.
The Passive Stock Investing Using ETFs eBook lays out the ETFs to buy to create a long-term compounding machine portfolio, with almost no effort. No individual stock research required.
Cory Mitchell, CMT
Disclaimer: No current position in DOL.TO. Nothing in this article is personal investment advice, or advice to buy or sell anything. Trading is risky and can result in substantial losses, even more than deposited if using leverage. Affiliate links are used on the site: If you purchase a product via one of these links, this site may be compensated at no cost to you. Thank you for supporting the site in this way. Past results/performance isn’t always indicative of future results/performance.