

Investment activity in private markets across Asia–Pacific has generally contracted in recent years, pressured by everything from significant geopolitical shifts to the reorientation of global supply chains and foreign exchange volatility. However, India has emerged as an increasingly attractive destination for limited partner (LP) allocators. Its regional weight has increased amid China’s slowdown, and improved performance has seen investment activity from private equity and venture capital deals expand 1.6-fold to $207 billion between 2016–20 and 2021–25. Exits for the same period more than doubled to around $120 billion.
Yet India also faces challenges. While its regional standing has improved, its capital pool remains narrow. Private-capital intensity relative to GDP has stagnated: Deployment is heavily concentrated in a limited set of sectors, while other sectors central to India’s growth ambitions do not attract meaningful private-market investment. This concentration extends to fundraising among fund managers. While fundraising by domestic private equity firms has increased, capital remains skewed, akin to a winner-take-all dynamic: The six largest general partners (GPs) accounted for 64 percent of the total of $13.68 billion raised between 2022 and 2024, up from 59 percent from 2016 to 2018.
Addressing structural constraints limiting the breadth and depth of India’s private markets could create additional investable opportunities and enable a more diversified capital pool across sectors, asset classes, and fund managers. To better understand the country’s investment dynamics and measures that broaden its appeal, we surveyed more than 50 global LPs about their perceptions, preferences, and anticipated activities in India (see sidebar, “About our research”). Here’s what we found.
India’s private markets outperform regionally
After attracting just $6.4 billion in investment in 2006, India’s private markets are today central to the country’s economic growth. Private-capital deployment across asset classes was $44 billion in 2025, with its share relative to the country’s GDP more than doubling to 1.42 percent in the past decade compared with 0.68 percent from 2006 to 2015.
India has also emerged as a relative outperformer in Asia–Pacific’s contracting private-markets landscape. While the country has not been immune to the regional slowdown—private-capital deployment has plateaued since peaking at $74 billion in 2021—India’s total share of Asia–Pacific private equity (PE) and venture capital (VC) deployment has increased from around 12 percent between 2015 and 2019 to about 21 percent from 2020 to 2024 (Exhibit 1). And its attractiveness as a destination for alternatives investors seeking diversified long-term growth may further increase; India’s share of global GDP is projected to rise from 3.7 percent in 2025 to 7.0 percent by 2050.
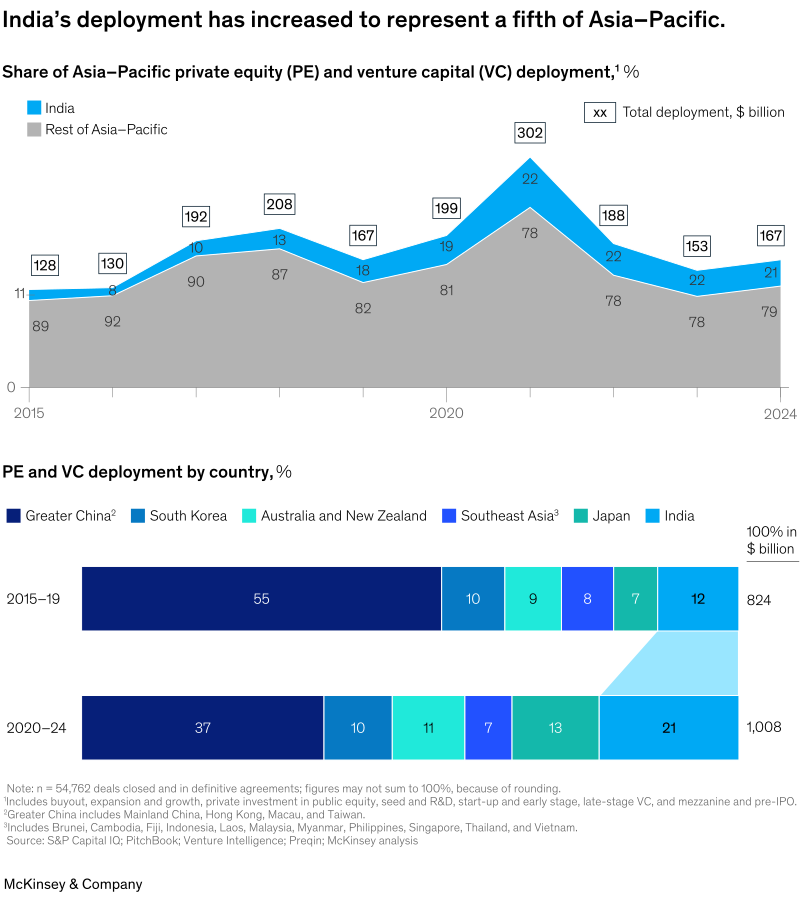
Two charts show the increase in private equity and venture capital deployed in India relative to the rest of the Asia-Pacific from 2015 to 2024.
An area chart showing the total amount deployed in both India and the rest of the Asia-Pacific in billions of dollars. In 2015, India comprised a fraction of the total of $128 billion deployed, but its weighting has consistently increased over the course of the decade. Although it has declined slightly from the percentage allocated to it when total investment peaked at $302 billion in 2021, it retains a significantly larger percentage of the Asia-Pacific’s $167 billion total in 2024 compared with 2015.
A horizontal stacked bar chart shows the percentage of private equity and venture capital deployed by country. The first bar shows totals for the 2015–19 period, with a total of $824 billion; the second shows totals for the 2020–24 period, when a total of $1,008 billion was deployed. Between the two periods, Greater China’s share fell from 55 to 37%, Australia and New Zealand rose from 9 to 11%, Southeast Asia eased from 8% to 7%, South Korea was flat at 10%, Japan increased from 7% to 13%, and India jumped from 12% to 21%.
Note: Exhibits cover 54,762 deals closed and in definitive agreements. Private equity and venture capital deployments includes buyout, expansion and growth, private investment in public equity, seed and R&D, start-up and early stage, late-stage VC, mezzanine and pre-IPO, turnaround, bridge loan, franchise funding, and concept. Greater China includes Mainland China, Hong Kong, Macau, and Taiwan. Southeast Asia includes Brunei, Cambodia, Fiji, Indonesia, Laos, Malaysia, Myanmar, Philippines, Singapore, Thailand, and Vietnam.
Source: S&P Capital IQ; PitchBook; Venture Intelligence; Prequin; and McKinsey analysis
Limited partners are increasingly prioritizing India
India accounts for more than a third of all Asia–Pacific investment exposure among surveyed LPs. Europe-based LPs indicated the highest exposure (around 60 percent), while exposure among those based in the Middle East, Asia–Pacific, and North America was about 20 to 30 percent of their total Asia–Pacific capital (Exhibit 2).
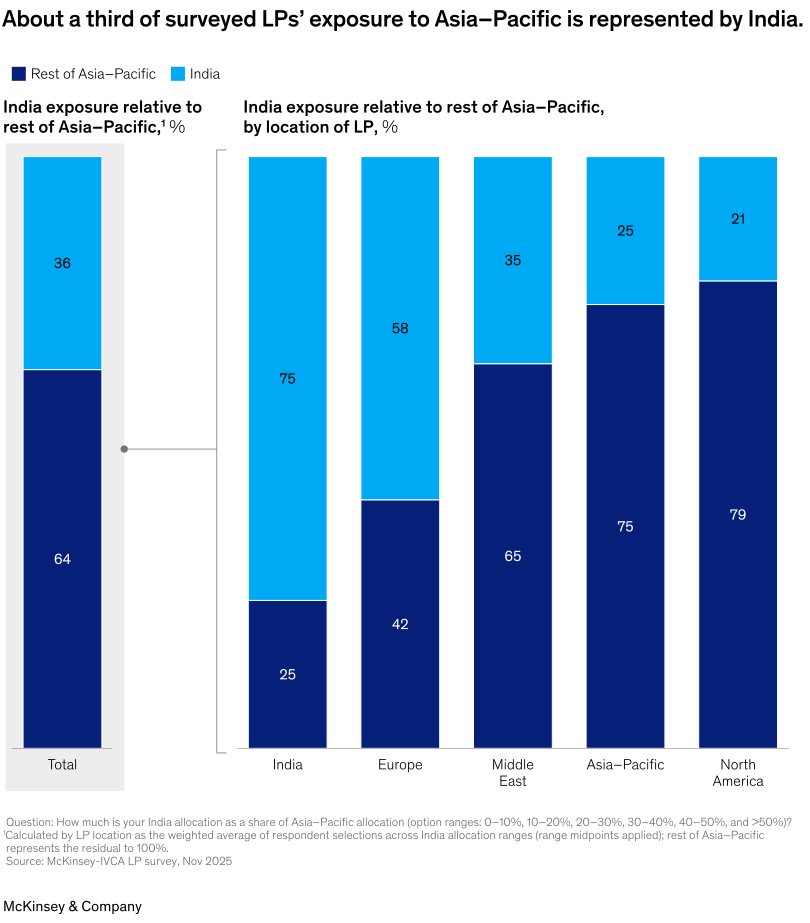
A stacked bar chart shows limited partners’ exposure to India in the context of their overall exposure to the Asia-Pacific. India represents 36% of total limited partner exposure in the Asia-Pacific. Five stacked bars break down exposure to India by the location of the limited partner. These show that India-based limited partners have 75% exposure to the country; those from Europe have 58% exposure to India; limited partners from the Middle East have 35% exposure to India; those from other countries within the Asia-Pacific have 25% exposure to India; and limited partners from North America have 21% exposure to India.
Survey question: How much is your India allocation as a share of Asia–Paci¬c allocation (option ranges: 0–10%, 10–20%, 20–30%, 30–40%, 40–50%, and >50%)?
Note: India exposure relative to Asia–Pacific was calculated by LP location as the weighted average of respondent selections across India allocation ranges (range midpoints applied); rest of Asia–Pacific represents the residual to 100%.
Source: McKinsey-IVCA LP survey, November 2025
India was the most attractive private-market destination in the Asia–Pacific, with 31 percent ranking it first and 76 percent placing it within their top three choices (Exhibit 3). More nuance emerges by LP size, with Japan preferred by LPs with more than $25 billion in assets under management (AUM). China’s ranking was polarized: 17 percent ranked it first, but 66 percent placed it fifth or sixth relative to other Asia–Pacific markets. These broad allocation preferences also reflect how markets have shifted in the past decade. For example, within Asia–Pacific, India and Japan’s joint share of PE and VC investment increased to 34 percent for 2020 to 2024 from 19 percent in 2015 to 2019. For the same period, China’s share declined to 37 percent from 55 percent.
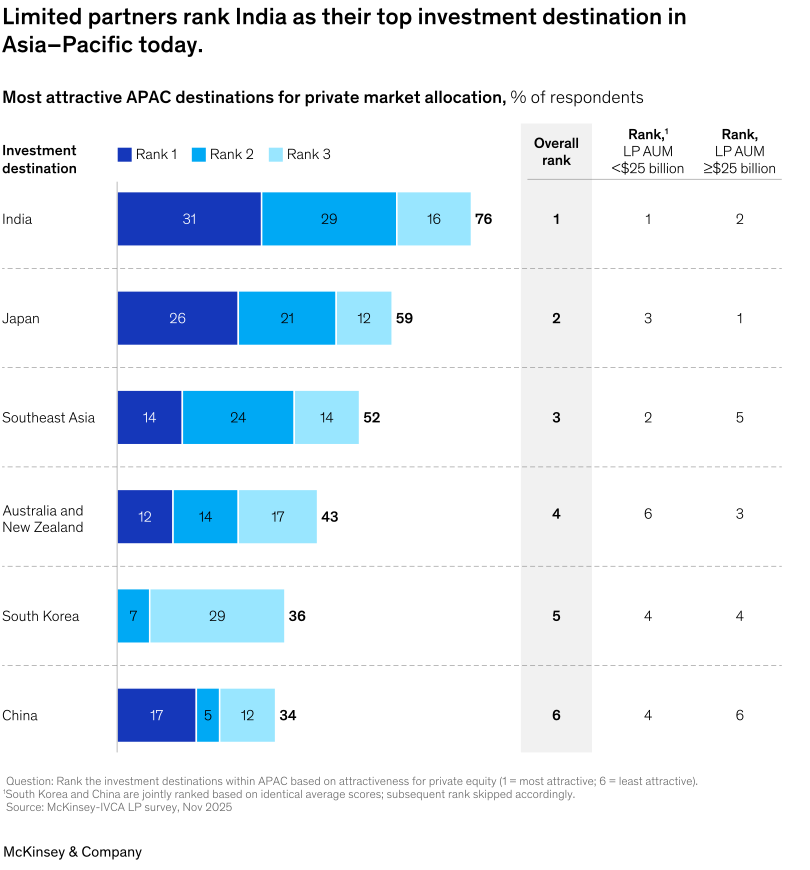
A horizontal stacked bar chart shows how limited partners view the attractiveness of private markets within the Asia-Pacific. It shows India is the most attractive Asia-Pacific destination, ranked first by 31% of respondents, second by 29% of respondents, and third by 16% of respondents for an overall rank of 76%. Second is Japan, which was ranked first by 26% of respondents and had a total rank of 59%; third was Southeast Asia with a total of 52%; fourth was Australia and New Zealand at 43%; fifth was South Korea at 36%; and sixth and least attractive was China at 34%.
Survey question: Rank the investment destinations within APAC based on attractiveness for private equity (1 = most attractive; 6 = least attractive).
Note: Rank order is based on the weighted average rank assigned to each country, calculated using the number of LPs selecting each country at each rank. And while certain LPs view China as the most attractive destination, about 40% ranked it as their least preferred market, driving its overall last position in the order.
Source: McKinsey-IVCA LP survey, November 2025
Investors have two lenses on India
Two views of India’s attractiveness as an investment destination have emerged. High-allocator LPs—major global investors characterized by a proactive stance to Asian exposure for growth and diversification, sustained allocations, higher future allocation intent, active co-investment participation with GP partners, and more frequent on-ground visits—tend to view the country as a complex, yet scalable, opportunity-rich private-markets destination. Moderate allocators, which carefully weigh known opportunities at home against emerging market risks, episodic exposure and track records, and more muted allocation intent, view India as a bright spot for GDP growth supported by a reform-oriented government. Yet while they feel accessing India’s opportunities remains highly contested and richly valued, it requires a look beyond the macro context and they approach the country with greater caution. As one group bets on India’s future, the other is more anchored on its past record.
India is a complex environment, where granular opportunity identification often matters far more than macro bets, with opposing views on whether India’s opportunities outweigh its risks. Consistent with those attributes, respondents provided insights into measures investors and policymakers can take to improve the country’s attractiveness as an investment destination. The survey compared high and moderate allocators across three areas: their views of India’s macro environment, PE market fundamentals, and private-market manager quality and selection considerations.
The limited partner view of India’s macro environment
Both high and moderate allocators broadly agree on India’s macro strengths, such as its political and economic stability, and on its key challenges, including currency risk, a complicated tax regime, and the difficulty of doing business and contract enforceability. However, they diverge in their degree of confidence on factors such as quality of governance, regulatory consistency, and foreign investment policy, which likely drives a different view of macro risks associated with in-country investments and, subsequently, capital allocation decisions.
Assessing the structural attractiveness of India’s private equity market
High and moderate allocators broadly align on the structural drivers of India’s private markets, such as entrepreneurial talent, economic growth, and domestic manufacturing and consumption. High allocators view exit potential, availability of quality targets, and depth of capital markets as relative strengths, reflecting confidence in India’s ability to support full investment cycles, but moderate allocators are more cautious, scoring these factors lower and, in some cases, weaker than other markets. Both high and moderate allocators rate ease of access—driven by visa and capital control considerations—and valuations as weaknesses compared with other markets, explaining the relatively defensive or cautious stand several allocators take toward India.
Private-market manager allocation considerations of limited partners
High-allocator LPs prioritize deployment opportunities (quality of deal pipeline and flow), risk-adjusted internal rates of return (IRR), and manager (team) quality as differentiators when considering private-market manager allocation. Moderate allocators focus on a longer checklist, including exit record as measured by distributed to paid-in capital (DPI), governance and disclosures, risk-adjusted IRR, and manager fees and costs as their dominant manager selection criteria. The significant difference in how high and moderate allocators weight manager selection criteria may explain LP diligence emphasis: While high-allocator LPs seek to understand drivers of return outperformance, moderate allocators focus on risk, liquidity, and governance.
Investor perceptions of the India opportunity
How do LPs view the opportunity presented by India? It depends. While participation in India has become more intentional, it is deliberate and risk managed. LP preferences are consistent with historical deployment trends around asset class, strategy, sector, and co-investment choices, and are designed to mitigate perceived macro and local private-market risks and access opportunities. Our survey examined these elements in depth, as well as attitudes toward allocations to India-based general partners (GPs).
Among India’s alternative asset classes, private markets are favored
Surveyed LPs allocate 64 percent of their India alternatives exposure to private markets, which are favored by investors from all geographies: LPs domiciled in Europe allocate 95 percent to private markets, while LPs in the Middle East allocate 73 percent, those in India allocate 71 percent, those in Asia–Pacific allocate 60 percent, and LPs in North America allocate 51 percent. There is more variation among LP institutions, with funds of funds heavily weighted toward private alternatives and pension funds preferring public alternatives.
Investors expect buyout and growth strategies to dominate
As the industry matures, investors increasingly prefer historically successful strategies with higher persistence. LPs indicate a preference for buyout and growth strategies over the next five years, while several other strategies, such as VC, remain under strong consideration. Control in buyouts provides greater influence over value creation and exit timing, which helps mitigate exit risk—a key concern of moderate allocators. Earlier-stage strategies, however, see relatively lower preference, reflecting perceptions of market saturation, meeting power law returns that justify risk, and in achieving timely public market exits (Exhibit 8).
Investment is concentrated in scalable and relatively defensive demand-driven industries
Sector preferences follow similar logic. LPs tilt toward export-oriented, consumption-led, and talent-backed export sectors such as pharmaceuticals, IT, and financial services rather than sectors more exposed to regulatory complexity, high capital investment, and execution and timing risks. This pattern is remarkably consistent across buyout, growth, and venture strategies, with the same core sectors emerging as preferred areas of allocation. Almost three-quarters of PE capital in India was concentrated across five core sectors from 2021 to 2025: technology (29 percent), financial services (15 percent), IT and IT services (13 percent), pharmaceuticals and healthcare (10 percent), and consumer goods (6 percent). LP interest is expected to remain focused on sectors that act as natural hedges against macro risks in the next five years, which includes risks and opportunities related to AI as investors seek more digital infrastructure opportunities and re-rate the IT services industry. Notably, core manufacturing, agricultural, construction, and metals and mining sectors solicit muted interest despite growth.
The appetite for co-investment is high
Co-investment has become a popular pricing feature for LPs. In addition to offering favorable economics, it allows LPs to express sector preferences that mitigate perceived macro and private-market risks in India. Co-investment participation—which was negligible two decades ago—has grown to account for about 25 to 28 percent of deployment value and 20 percent of deployment volume over the past five years. Historically, co-investment activity has also been concentrated in the same five core sectors. The preferred co-investment strategy is largely buyout—which provides greater control on exit timing—while co-investment sectors are skewed toward those that are currency and inflation hedged, such as pharmaceuticals, financial services, and IT services. Some 60 percent of LPs surveyed have participated in co-investments, with 54 percent of those LPs reporting outperformance relative to underlying fund investments and another 42 percent saying the performance of co-investments was on par with fund investments. Just 4 percent of LPs undertaking co-investments reported underperformance. LPs note that Indian GPs prefer to maintain fee pricing in exchange for generous co-investment opportunities that allow larger LPs to double down on large and attractive exposures.
Private equity leads asset class preferences
Private equity emerges as the preferred asset class among LPs in India, followed by secondaries and climate and sustainability, while infrastructure and private credit are viewed as broadly comparable to other markets. Real estate ranks as the least preferred asset class, likely reflecting LP caution given its higher exposure to several macro risks identified by respondents, such as regulatory complexity, historical concerns with past closed-end funds, contract enforceability, and permitting processes. Participation in real estate is dominated by partnerships with developers that create core pipelines for real estate investment trust (REIT) listings and asset-specific special purpose vehicles (SPVs). LPs noted that several GPs are in discussion on private-credit-related opportunities despite a limited track record.
Participation in India-focused funds is growing, and allocations may rise
Multiple domestic GPs have emerged in India in recent years, although they still represent only around 15 percent of total private equity deployment from 2023 to 2025 compared with 62 percent in Korea and 26 percent in Japan. Nonetheless, the share of deployment among domestic GPs has increased to 15 percent in the past three years from 10 percent during 2020 to 2022. These managers are well positioned to capitalize on India’s domestic GDP growth trajectory, leveraging their ability to navigate local dynamics and originate mid-market deals in consumption-led sectors such as food and beverage, fast-moving consumer goods, and consumer businesses in under-branded categories such as packaged foods and personal care. This aligns with emerging LP interest in more India-specific vehicles—more than 50 percent of LPs surveyed plan to increase their allocation to India-dedicated funds, and just 5 percent expect a reduction; 43 percent expect to allocate to one to five Indian GPs across asset classes. LPs today consider domestic fund sizes between $250 million and $1 billion to be most attractive, indicating their understanding of capital absorption potential. They note larger funds are being raised but only on the back of a record of scaled deployment and strong DPI and returns.
Several pathways can enhance India’s position as a destination for greater pools of foreign investment capital
Investor belief in the potential of India’s private market is strong and growing. Yet, relative to the size of the Indian economy, private-capital investments remain modest. Unlocking additional capital would require addressing execution and structural gaps, including the comparatively lower ranking of Indian GPs on DPI and exit record, and ease-of-doing-business factors (especially in manufacturing and capital-intensive sectors), as well as the need to mitigate several perceived country-specific risks. High allocators appear to be able to navigate some of these risks through their manager selection construction and investment portfolios and sector construction, pointing the way to the kinds of measures required to broaden India’s investment attractiveness.
India general partners retain significant room to grow
Returns on PE deals in which exits have occurred have improved over time, with the median IRR rising from 18.0 percent for the 2008 vintage year to 33.1 percent for the 2019 vintage year. Yet even though exit activity has improved in the past five years, a meaningful share of invested capital remains unrealized. Survey respondents ranked India’s GPs relatively modestly compared with other market GPs across numerous important selection metrics, including performance and IRR, exit record, diligence record, and the quality and tenure of investment teams (Exhibit 4). There remains wide variance among LPs based on their individual exposures and experiences. For example, top- versus bottom-quintile scores for both IRR and DPI were 7.0 versus 4.0.
Strengthening liquidity and exit pathways will be critical to improving global competitiveness. Measures such as expanding listing opportunities, deepening domestic capital markets, and easing cross-border capital flow could enhance options for investors to exit and improve DPI outcomes over time.
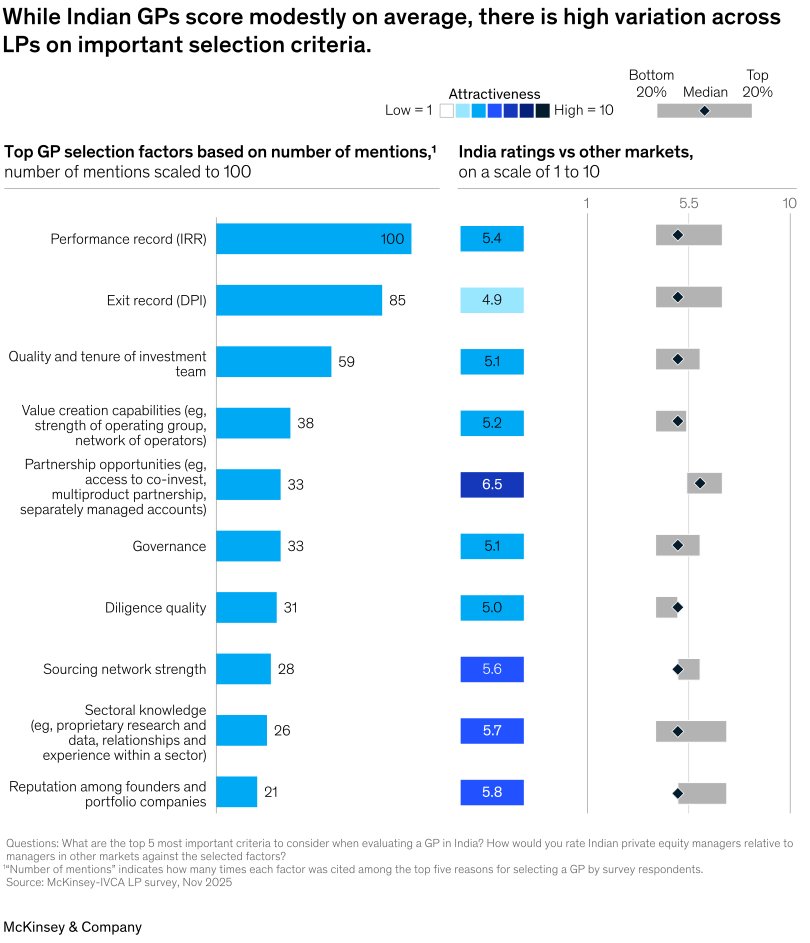
A bar chart shows top GP selection factors based on number of mentions, with the number of mentions scaled to 100. The top factor was performance record measured by internal rate of return, with a score of 100. Relative to other markets, as depicted alongside the selection factor ranking, India’s rating on performance record was 5.4 on a scale of 1 to 10. The second selection metric was exit record with a scaled score of 85—India’s rating versus other markets was 4.9. Third was the quality and tenure of the investment team with a selection metric score of 59—India’s rating on that relative to other markets was 5.1. India’s rating on four selection metrics factors were higher than other markets, led by partnership opportunities (which scored 33 but rated 6.5 out of 10 relative to other markets) and followed by sourcing network strength, sectoral knowledge, and reputation among founders and portfolio companies.
Survey questions: What are the top 5 most important criteria to consider when evaluating a GP in India? How would you rate Indian private equity managers relative to managers in other markets against the selected factors?
Note: Top GP selection factors based on number of mentions is based on the average attractiveness rating (1–10 scale) assigned by limited partner respondents for each target fund size range. “Number of mentions” how many times each factor was cited among the top ¬five reasons for selecting a GP by survey respondents.
Source: McKinsey-IVCA LP survey, November 2025
Making doing business easier and mitigating macro risk
LPs highlighted the need for a more predictable and less complex tax regime, faster regulatory approvals, clearer capital flow processes, and easier talent mobility. While currency risk persists, LPs account for annual Indian rupee depreciation of 2 to 3 percent in their underwriting. Some also view a weaker Indian rupee as a lever to raise the cost of imports, boosting demand among Indian domestic producers and export competitiveness.
To address macro risks, LPs highlight streamlining processes, enhancing regulatory clarity to make doing business easier, and facilitating smoother capital flows into and out of India, which includes greater clarity around valuation norms and tax treatment (including carried interest taxation and pass-through status), and simplifying approval processes for cross-border transactions. It also encompasses shaping next-generation reforms for alternative investment funds; enabling structures that better accommodate long-term institutional capital (such as longer-duration vehicles with periodic liquidity windows); and aligning regulatory, capital gains tax, and disclosure standards more closely with global norms.
Addressing structural issues could support sector diversification
High capital concentration in a limited set of sectors contributes to valuation pressure. Addressing structural constraints could unlock capital into India’s emerging growth arenas, such as those identified by the McKinsey Global Institute, including AI software and services, urban construction, medical devices, aerospace and defense, leasing, digital infrastructure (for example, data centers), specialty chemicals, and cloud services. These sectors present opportunities for growth equity, roll-ups, and platform plays, particularly where deal sizes have historically been subscale and India’s endowments are favorable. However, LPs and GPs note several sunrise sectors are capital intensive, and ease-of-doing-business delays increase risk and impact returns.
Broadening asset class participation can expand the market
Beyond traditional PE and VC, there are opportunities across additional asset classes. Infrastructure and infrastructure investment trusts have seen renewed interest as investors seek predictable, long-duration cash flows. Roads, renewables, transmission, and pipelines offer predictable cash flow attractive to stable low beta yield-oriented investors. Real estate has gained momentum, with around $25 billion deployed from 2021 to 2025, particularly in logistics and warehousing. Structural growth in e-commerce, manufacturing, and supply chain localization is driving demand for high-quality industrial assets.
Recent updates to REITs and infrastructure investment trust (InvITs) regulations—including expanded investment flexibility, streamlined issuance pathways, tax benefits, and broader eligibility for institutional capital—are designed to enhance operational efficiency and portfolio optionality. Together, these measures could support deeper institutional participation and improve liquidity across India’s real estate and infrastructure investment trusts.
Private credit is also an emerging opportunity. About $36 billion was deployed in India from 2020 to 2024, driven by factors including demand for bespoke financing, improved creditor resolution frameworks, and persistent funding gaps for mid-market enterprises. Indeed, LPs note that several domestic funds have launched plans to participate in select credit areas, including investment-grade bonds, senior or subordinated debt, mezzanine financing, and distressed private credit.
Finally, recent moves by India’s pension regulator to widen investment options for private pension funds to alternative investment funds (AIFs) is expected to bring more capital to domestic funds, providing a much-needed expansion of the LP base beyond foreign investors.
India is an increasingly attractive institutional investment destination within Asia–Pacific. Yet while firms with both high and moderate allocations agree on the country’s strengths, addressing weaknesses they have identified and areas where their views diverge is critical to making India more attractive as an investment destination. Doing so could not only unlock a deeper pool of investable opportunities but foster a more diversified capital pool to power an increasingly critical driver of the country’s economic growth in high-potential sunrise sectors.