
Yanni Angelakos, Head of Investment Insights, Nasdaq Capital Access Platforms
Mike Cho, CFA, Senior Research Analyst, Nasdaq Capital Access Platforms
Tony Kristic, Senior Research Analyst, Nasdaq Capital Access Platforms
Key Points
- Investors push through geopolitical risks & higher energy prices, focusing on a strong Q1 earnings season
- Resurgence of the AI theme has led U.S. equity returns from the recent lows & to new highs—semis outperforming software by 70% over the last 6 months, the most in 25 years
- Portfolios contending with higher equity dispersions & positive stock-bond correlations
Summary
The Nasdaq-100 Index® (NDX®) ended April higher by 15.6%, its best month since October 2002 (18.9%), while the S&P 500 returned 10.4%, its best month since November 2020 (10.8%). These gains were driven by 1) averting the worst-case scenarios in the Iran war and 2) strong Q1 earnings and upward earnings revisions trends (see our prior piece for more).
Per FactSet and Bloomberg:
- Nasdaq-100 Q1 2026 earnings are on pace to increase by 51% YoY versus estimates of 22%.
- Nearly all the 53 Nasdaq-100 companies which had reported as of May 1st beat EPS estimates.
- Similarly, S&P 500 earnings are set to have their highest quarterly YoY growth rate (currently, nearly 24%) since Q4 2001 (32%).
- 84% of S&P 500 reporting companies have beaten EPS estimates—above historical averages.
Technology sector dispersion is most prevalent in the semiconductor versus software pair as the AI “enablers” (semis) have significantly outperformed the perceived AI “disruptees” (software). It is likely too early to decide whether this extremely wide relative performance gap will persist as there are winners and losers in every cycle. Regardless, the markets have priced in this narrative accordingly as semis have outperformed the software space by nearly 70% over the past six months—by far the highest level over the past 25 years.
Dispersion is not idiosyncratic to just the tech sector as S&P 500 dispersion remains above its 5-year average. In theory, higher equity dispersion should favor active stock pickers as it can present more stock-specific opportunities and the scope to generate alpha. Yet flows are not reflecting this: Q1 2026 was the second strongest quarter of ETF net inflows since 2010. Another portfolio dynamic is still positive stock-bond correlations as they remain above their 10-year average. This leaves investors continuing to search for other portfolio ballasts—particularly when Treasurys do not function as safe havens, as we saw in March 2026 when yields rose.
Biweekly Chart in Focus: Returns for U.S. equity indexes, styles, themes YTD & since recent March 30th lows

Source: Bloomberg. As of May 5, 2026. Notes: Nasdaq-100 Mega Index is designed to target the performances of approximately the top 45% cumulative weight of the Nasdaq-100 Index.
Details
Strong Q1 2026 U.S. earnings season continues
It has been a very solid Q1 2026 earnings season thus far. As of May 1st, 50 out of 53 Nasdaq-100 companies (around two-thirds of market cap) have beaten EPS expectations by an average of 16% with an index level growth rate of 51%. Net income for Alphabet (GOOG & GOOGL) and Amazon (AMZN) were aided by increases in valuation in their stakes in private companies. Our friends at Nasdaq Index Insights pointed out that excluding these private investments, Nasdaq-100 Q1 EPS growth would actually be 28% YoY. This is a notable decline from 51%, yet still solidly above growth expectations of 22% YoY.
Figure 2: Nasdaq-100 Q1 2026 EPS & revenue beat & misses

Source: Nasdaq Global Indexes, FactSet. As of May 1, 2026.
Notable S&P 500 Q1 earnings season observations per FactSet (as of May 1st):
- On pace for 27.1% YoY EPS growth (Figure 3)—would be the highest since Q4 2021 (32%). (Similar to Nadaq-100’s EPS growth YoY, this would also be lower excluding the aforementioned markups in private investment stakes.)
- AI theme driving sector YoY EPS growth (Figure 4): communication services (53.2%), technology (50%).
- Despite concerns about higher energy prices, analysts have not lowered their EPS estimates for Q2. While the increase in WTI crude oil was far less severe in April versus March (3.6% vs. 51.3%), WTI was still higher by 83% year-to-date through the end of April. Nevertheless, the Q2 bottom-up EPS estimate increased by 2.1% in April. This contrasts with the historical trend when analysts usually reduce earnings estimates during the first month of Q2 (Figure 5). The caveat is that the clear oil beneficiary, the energy sector, led the index EPS increase (+45.1%). Six out of the eleven sectors saw an increase in their bottom-up EPS in April—so, a balanced dynamic.
- 84% of companies had beaten the mean EPS estimate—above both the 5-year (78%) and 10-year (76%) averages, thus far.
Figure 3: S&P 500 Q1 earnings growth YoY% highest since Q4 2021

Source: FactSet. As of May 1, 2026. Notes: Q1 2026 is blended (actual + estimated)
Figure 4: S&P 500 Q1 earnings growth YoY% by sectors
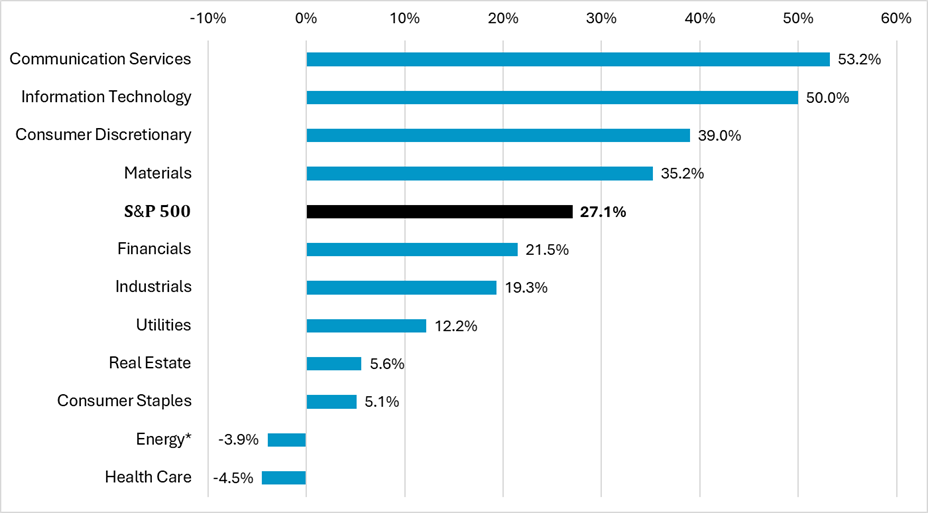
Source: FactSet. As of May 1, 2026. Notes: Q1 2026 is blended (actual + estimated). *Energy EPS estimate YoY set to benefit from higher energy prices come Q2 2026 (current estimates: 93.8% YoY).
Figure 5: Change in bottom-up S&P 500 Q2 2026 EPS estimate during April 2026 vs. historical adjustments in Q2 EPS estimates in April

Source: FactSet. As of May 1, 2026.
Recent valuation & performance observations
Key near-term macro risks for the markets remain geopolitical volatility and higher energy prices. Yet, U.S. equities have hit new highs against a backdrop of lower forward P/Es given the aforementioned earnings strength and a resilient U.S. economy (underpinned by AI capital investments and, thus far, a durable consumer)—providing for a constructive equity outlook.
U.S. equity valuations have 1) derated on an absolute basis and 2) seen their premium versus the 10-year averages compress relative to mid-2025 (Figure 6). As we noted in our prior piece, EM equities are also benefiting from a strong earnings growth outlook, mainly driven by the AI theme. Higher earnings growth have translated into EM’s forward P/E trading at a discount relative to its 10-year average. The Nasdaq Emerging Market Index (NQEM) also hit new highs in early May.
Figure 6: Regional next 12-month price-to-earnings (P/E)

Source: Bloomberg. As of May 4, 2026.
On the flip side of P/E, as also shown in the Biweekly Chart in Focus, the AI theme/megacap tech has reestablished itself to drive the “P” for U.S. equities from the recent March 30th lows (Figure 7—namely, tech and communication services). We’d be remiss if we didn’t note the concentrated returns for broader U.S. equities: per Bloomberg, seven stocks have driven 80% of the S&P 500’s year-to-date gains through April—all of which are notable participants in the AI theme.
Investors continue to model for the potential impact from extraordinary capital expenditures among the four AI hyperscalers that reported results on April 29th (Microsoft (MSFT), Meta Platforms (META), Alphabet (GOOG/GOOGL), Amazon (AMZN)), and to what degree their AI infrastructure investments will drive revenues and earnings over time. Per their earnings reports, $133 billion in aggregate was spent on capex in Q1—an increase of 70% from a year ago. These four AI hyperscalers are forecasting a combined $725 billion in total capex this year.
Figure 7: S&P 500 sector returns YTD & since recent March 30th lows

Source: Bloomberg. As of May 1, 2026.
In the interim, those companies which are reaping the benefits from the massive AI infrastructure build out are the “picks-and-shovels” enablers, such as semiconductors. At the epicenter of the AI theme, semiconductors are the backbone for the immense computational power needed for AI computing and data storage. The markets have rewarded these companies as forward earnings expectations for the S&P 500 semiconductor industry have been revised notably higher on the back of the insatiable demand for chips: as we also noted in our prior piece, 2026 EPS growth for the semi space has been revised to nearly 89% YoY from 55% YoY at the start of 2026 (per Bloomberg).
Contrast this with those companies which have been in the markets’ cross-hairs as part of the narrative that business models stand to be severely disrupted in short order by AI—such as the software sector. 2026 EPS growth for the S&P 500 software industry has barely moved since the start of the year: 13.7% YoY to 14.9% YoY (per Bloomberg).
As with most market themes, there will be winners and losers over time as investors perform their due diligence. Is it too early to confidently discern these winners and losers? Likely. In the meantime, Figure 8 shows the PHLX Semiconductor™ Index (SOX™) higher by nearly 70% over the past six months relative to the S&P 500 Software Index—equivalent to a +4.5 standard deviation move relative to the 25-year average. The latest parabolic move by the SOX was in April as it rose by 38.4%—its largest monthly increase since February 2000 (50.4%).
However, as markets and sectors move in cycles, investors should take note whenever there are extreme dispersions: over the past 25 years, when SOX has outperformed the software index by more than +2 standard deviations versus the historical average, the average return over the next six months has been -0.5% and it has outperformed only 33% of the time.
Figure 8: Semis outperforming software by +4.5 standard deviations vs. historical average over last 6 months

Source: Bloomberg. As of May 1, 2026.
Elevated equity dispersions & higher stock-bond correlations
Per Bloomberg, as a proxy for broader U.S. equity market dispersion—i.e., a measure of the difference in performance between individual stocks and their broader index—Figure 9 shows the S&P 500 dispersion index. The current level of around 36 indicates high dispersion—i.e., stocks within the S&P 500 are showing significantly different performance patterns. This is elevated compared to typical market conditions but below the extreme levels seen during the COVID-19 crisis (March 2020 peak of 58.9). It suggests meaningful divergence in how individual stocks and sectors are performing, creating an environment where stock selection matters considerably.
- Low dispersion: 14-20 range (stocks moving together, low differentiation)
- Moderate dispersion: 20-30 range (normal market conditions)
- High dispersion: 30-40 range (significant divergence, elevated uncertainty)
- Extreme dispersion: 40+ (crisis conditions, such as March 2020)
Figure 9: S&P 500 dispersion at upper end of last 5 years & above the average

Source: Bloomberg. As of May 1, 2026, weekly. Notes: dispersion index is calculated based on the standard deviation of returns across S&P 500 stocks. While the underlying calculation involves statistical measures that could be expressed in percentage terms, the published index itself is presented as a level for easier comparison over time.
Higher dispersion is usually equated with a “stock picker’s market” in terms of active managers selecting the winners and losers. However, per Bloomberg, net ETF inflows in Q1 2026 were the second highest since 2010 with the largest quarter being Q4 2025. Since 2010, ETFs have posted net inflows in all 65 quarters—including 16 when U.S. equities had negative returns (Q1 2026: S&P 500 returned -4.6% and Nasdaq-100 returned -6%). While actively managed ETFs’ market share has risen to 11.8% of U.S. ETF assets as of Q1 2026 from 3.9% in Q1 2020, investors continue to favor utilizing passively managed ETFs based on their 88.2% market share capture—even during more volatile periods.
Reiterating a narrative that has been in the marketplace for years now, record ETF flows continue to illustrate the difficulty active U.S. equity managers have had in outperforming their respective benchmarks and, in turn, attract new flows. For more insights regarding global cross-asset active management performance trends in 2025, please see the just released Nasdaq eVestment report.
Concurrently, a dynamic that we have flagged in the past as an ongoing challenge for investors and portfolios is the step-up in stock-bond correlations over the past five years—Figure 10. The increase in the correlation of U.S. equity daily returns and Treasury 10-year bond total daily returns has left investors searching for a portfolio ballast. This is particularly the case during periods of market stresses such as March 2026 during the peak of the Iran war concerns, in which equities sold off yet 10-year Treasurys did not function as a safe haven asset as yields rose in response to increased inflation expectations given spiking oil prices.
This has only further fueled the search for other portfolio hedges and evolving from the traditional 60/40 portfolio approach. Private markets are not a ubiquitous fit for all portfolios, are best utilized via a long-term investment horizon given liquidity constraints, and, as we have seen with the recent private credit concerns, differentiation amongst managers is key. Yet, given the increased stock-bond correlations, they continue being cited as offering a portfolio ballast over the longer-term—in addition to their more historical role of offering a layer of diversification and uncorrelated returns relative to public markets. Please refer to Nasdaq’s Private Capital Indexes for more information on Nasdaq’s private market index solutions.
Figure 10: Elevated U.S. stock-bond correlations leave investors looking for portfolio ballasts

Source: Bloomberg. As of May 1, 2026.
Treasury yields are expected to remain sticky in the short-term as high energy prices keep inflation expectations above recent averages (although they have come off the highs), and given high U.S. fiscal deficit and debt levels. Concerns around the inflation outlook were reflected in the April 29th Fed meeting which had a hawkish tilt as three of the four dissenting FOMC members opposed maintaining an easing bias.
Following the latest Fed meeting, Fed funds futures—which have been extremely volatile as they are at the behest of the Iran war’s news flow vis-à-vis oil prices and inflation expectations—are signaling a pause in Fed rates. This leaves the likely incoming Fed Chair, Kevin Warsh, in a difficult predicament given the pushback to lower rates from FOMC members. The Trump Administration clearly wants lower rates. Yet, it is a challenging dynamic in the near-term for further easing given the inflation outlook, on top of already sticky core inflation.
See how the data supports the story — explore the Global Markets Dashboard below.
Disclaimer:
Nasdaq®, Nasdaq-100®, and Nasdaq Stock Market® are registered trademarks of Nasdaq, Inc. The information contained above is provided for informational and educational purposes only, and nothing contained herein should be construed as investment advice, either on behalf of a particular security or an overall investment strategy. Neither Nasdaq, Inc. nor any of its affiliates makes any recommendation to buy or sell any security or any representation about the financial condition of any company. Statements regarding Nasdaq-listed companies or Nasdaq proprietary indexes are not guarantees of future performance. Actual results may differ materially from those expressed or implied. Past performance is not indicative of future results. Investors should undertake their own due diligence and carefully evaluate companies before investing. ADVICE FROM A SECURITIES PROFESSIONAL IS STRONGLY ADVISED.
© 2026. Nasdaq, Inc. All Rights Reserved.