
Lentor Modern’s early buyers made $314K on average. We look at land prices, sales, sub-sale gains and rents across all 7 new Lentor condos.
Five years ago, Lentor Hills was a relatively quiet neighbourhood, made up largely of the landed homes at Teacher’s Housing Estate and a handful of HDB blocks.
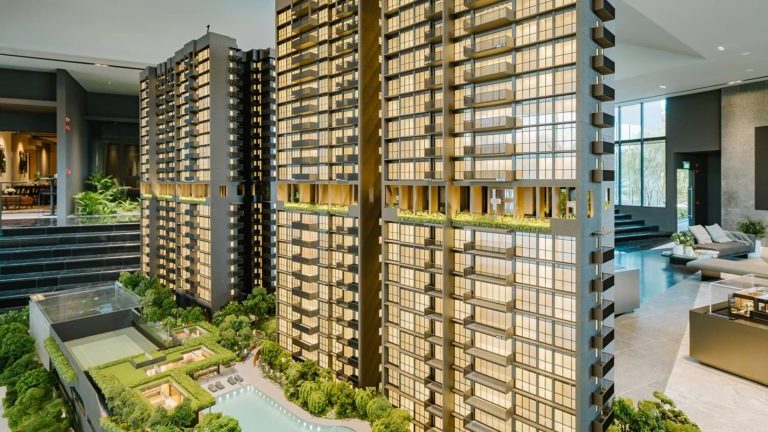
That has changed considerably. Seven new condominium developments are adding more than 3,400 private homes to the area, all within walking distance of Lentor MRT station. An eighth development site was sold in March 2026, setting a new record land price for the neighbourhood.
What’s interesting about Lentor is how closely these developments can be compared. The seven sites were sold through the Government Land Sales (GLS) programme within four years of each other, are located in the same neighbourhood, and broadly target a similar pool of buyers.
Yet their sales performances have been quite different. Some projects sold most of their units within weeks of launching, while others took almost three years to sell out. And despite developers paying significantly less for some of the later land parcels, that didn’t necessarily translate into cheaper homes.
With Lentor Modern now completed and recording its first sub-sales, we looked at URA transaction data across all seven developments to see how they compare in terms of launch prices, sales performance and early profitability. We also examined what the upcoming supply could mean for buyers and existing owners.
How Lentor was built: eight land sales in five years
It started in July 2021 when GuocoLand was awarded the Lentor Central site for $784.1 million, or about $1,205 psf ppr. The tender was very competitive, attracting nine developers vying for the site. At the time, we wondered whether a new condo in Lentor would be worth waiting for at a potential $2,000 psf.
Then something unexpected happened. Subsequent GLS sites in Lentor drew fewer bids and lower prices.
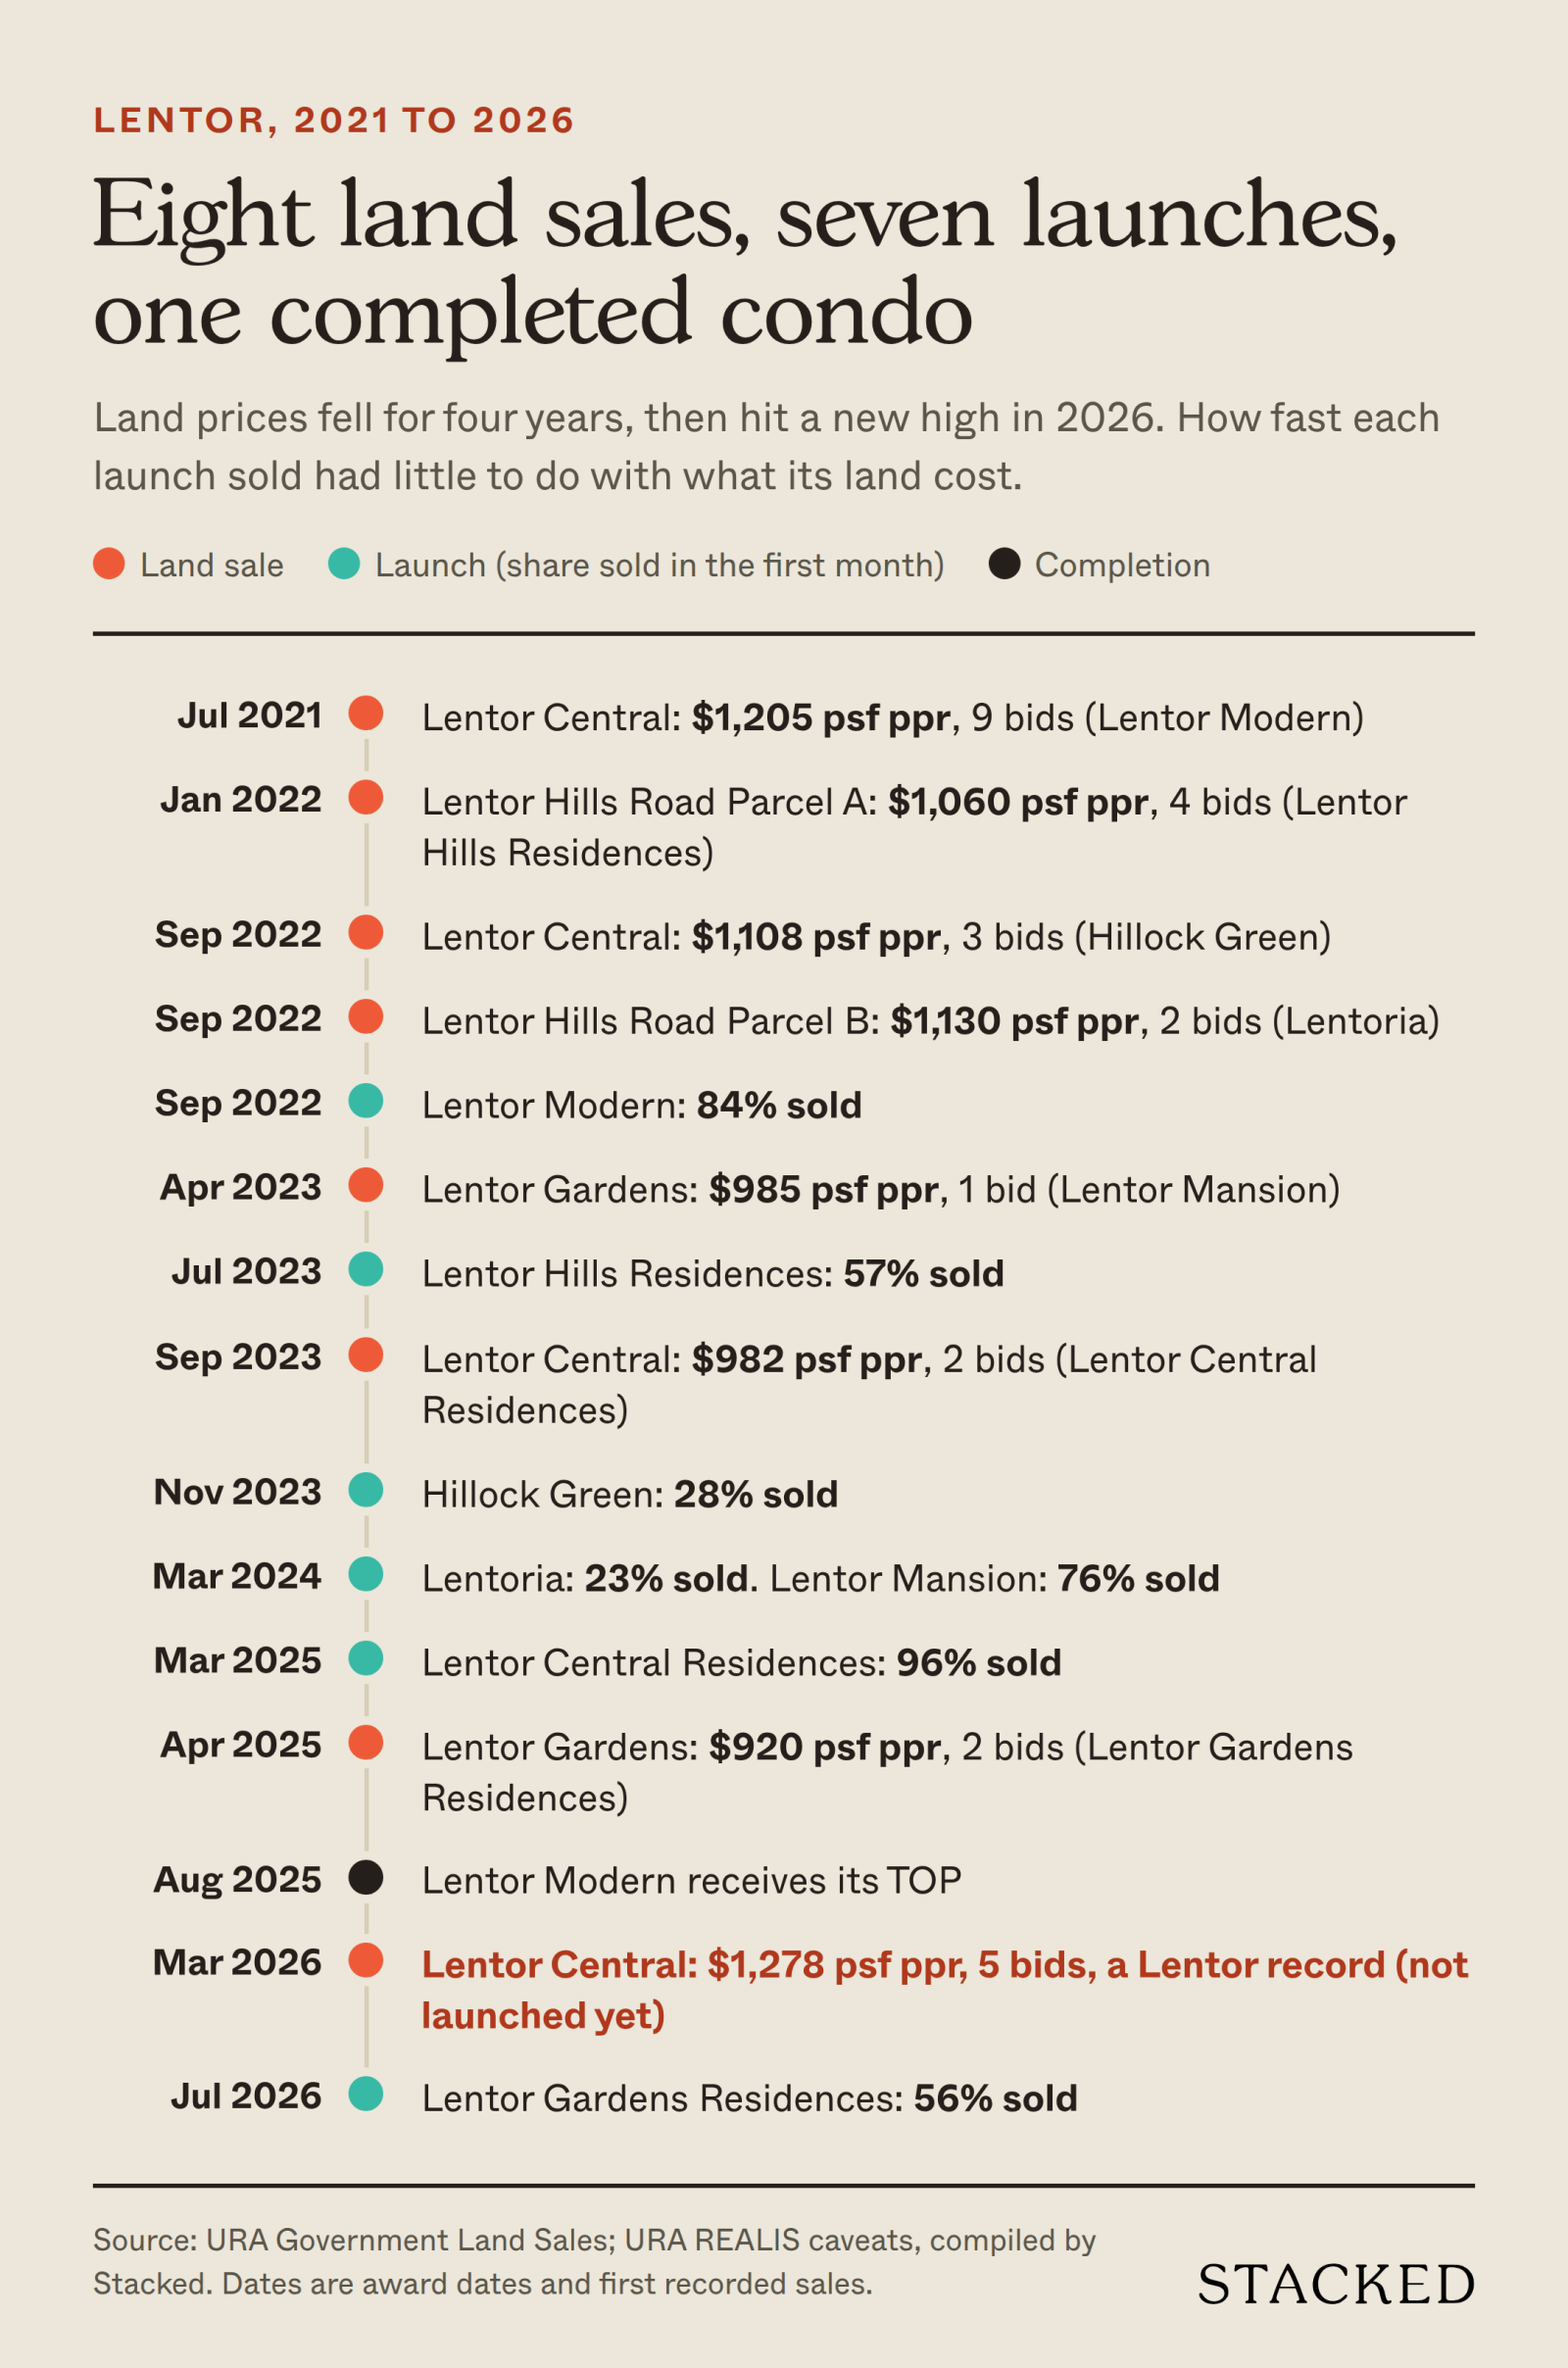
By April 2023, the Lentor Gardens site that became Lentor Mansion drew a single bid, at about $985 psf ppr. The next Lentor Gardens site went to Kingsford in April 2025 after the developer submitted a $920 psf ppr land bid, the lowest land rate at the time for a development site in Lentor.
Broadly speaking, we thought that some developers were getting cagey about the prospects of selling new condos in Lentor. It seemed that each new parcel was another competitor down the road, trying to capture the same profile of buyers a few months later.*
Then March 2026 broke the pattern. The latest Lentor Central site drew five bids and went for $657.1 million, or about $1,278 psf ppr: a new high for Lentor.
*It’s also worth noting how much of Lentor ended up with one family of developers. GuocoLand, Hong Leong and the Hong Leong-linked TID have a hand in six of the eight sites, including the newest one. Only Hillock Green and Lentor Gardens Residences sit outside that group.
Cheaper land did not mean cheaper homes
Here’s the thing: if the land price got about 24% cheaper between 2021 and 2025, you might expect the new homes from those developments would fetch lower, or more competitive, prices. But they didn’t.
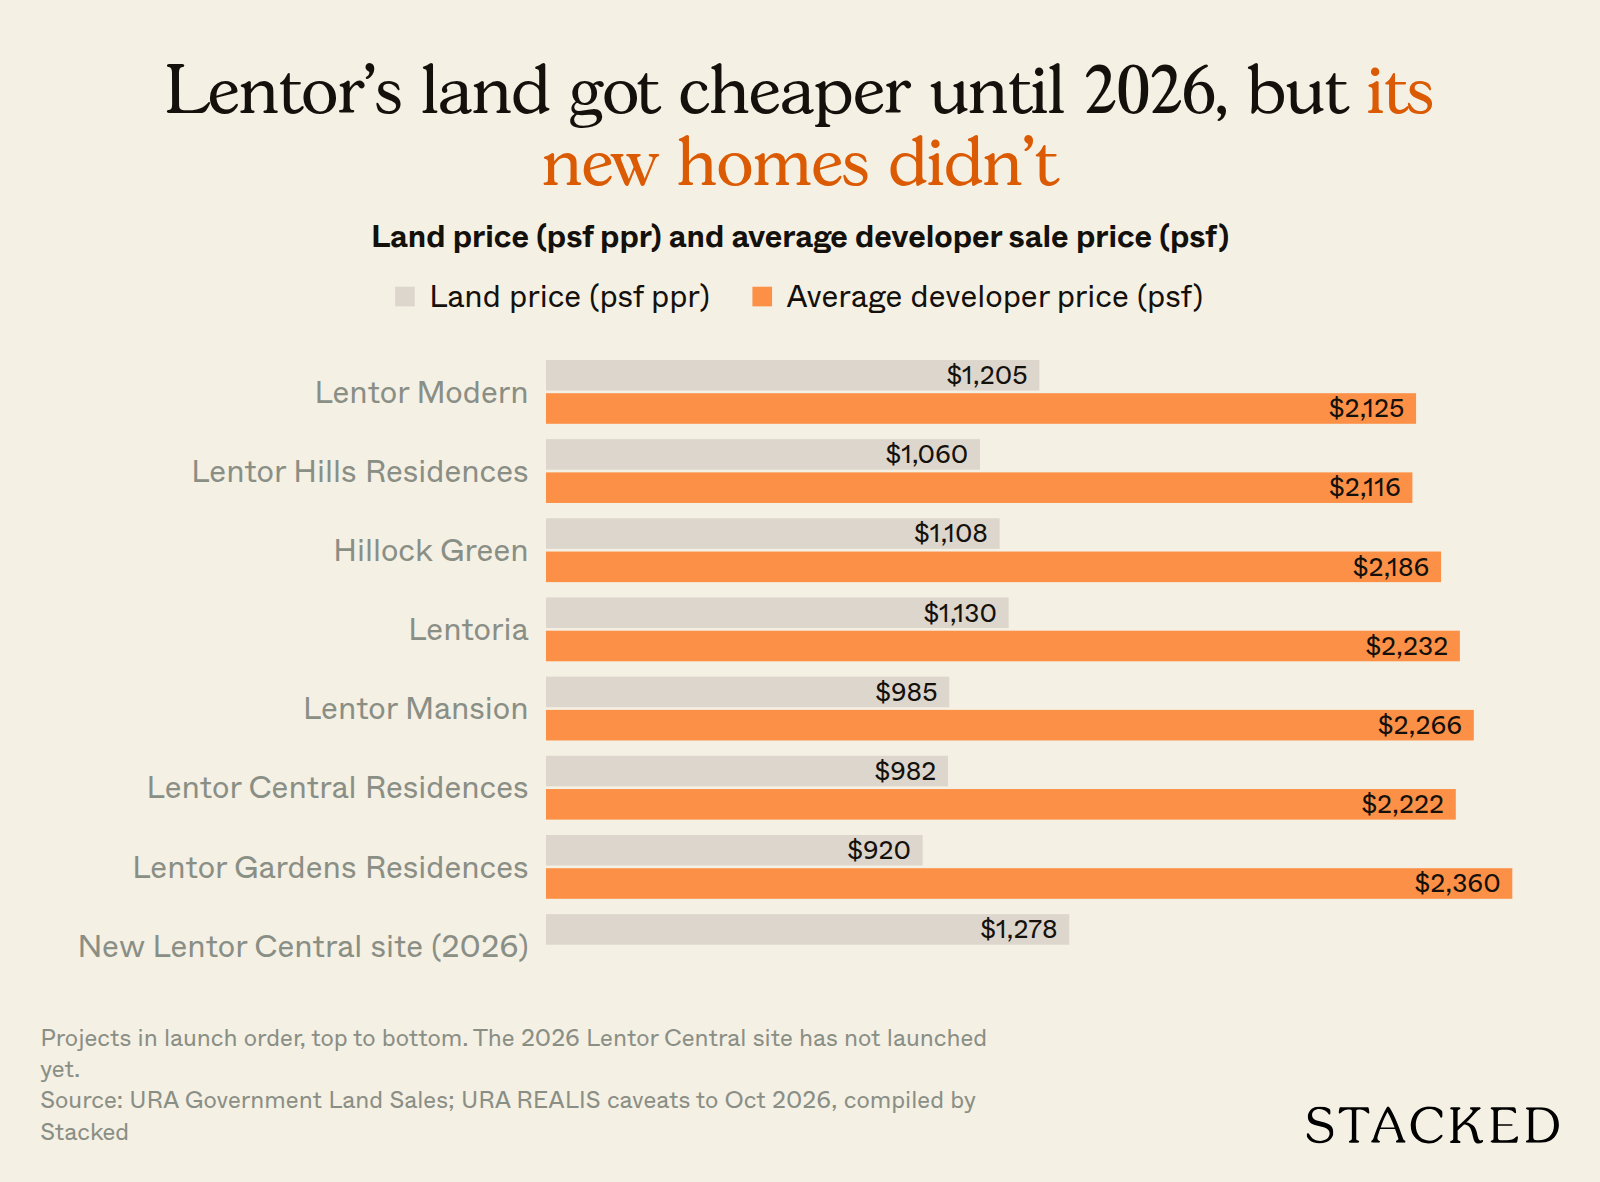
Lentor Modern’s developer sales set an average price of $2,125 psf. Lentor Gardens Residences, which attracted one of the lowest land bids, has recorded an average selling price of $2,360 psf so far. That’s about 11% more expensive in its average selling price, on a land tender that cost about 24% less.
We ran each project through our own development cost estimate (land, construction, financing, professional fees and marketing). On those rough numbers, the developer’s markup over the cost of the development climbs from about 10% at Lentor Modern to about 38% at Lentor Gardens Residences:
| Project | First sale | Units | Sold by developer | Land price (psf ppr) | Avg developer price (psf) | Est. breakeven (psf) | Est. markup over cost |
|---|---|---|---|---|---|---|---|
| Lentor Modern | 09/2022 | 605 | 605 | $1,205 | $2,125 | $1,933 | 10% |
| Lentor Hills Residences | 07/2023 | 598 | 598 | $1,060 | $2,116 | $1,820 | 16% |
| Hillock Green | 11/2023 | 474 | 474 | $1,108 | $2,186 | $1,963 | 11% |
| Lentoria | 03/2024 | 267 | 252 | $1,130 | $2,232 | $1,993 | 12% |
| Lentor Mansion | 03/2024 | 533 | 533 | $985 | $2,266 | $1,797 | 26% |
| Lentor Central Residences | 03/2025 | 477 | 477 | $982 | $2,222 | $1,793 | 24% |
| Lentor Gardens Residences | 07/2026 | 499 | 316 | $920 | $2,360 | $1,709 | 38% |
These figures are estimates, as developers do not disclose their actual construction and development costs. Our calculations also don’t fully account for differences between projects, such as Lentor Modern’s integrated mall and direct MRT connection.
Nonetheless, the difference is significant. While land prices fell by as much as 24% between 2021 and 2025, the savings were not passed on to buyers in the form of lower selling prices. Instead, our estimates suggest that developers who secured the later sites at lower prices stood to earn substantially higher margins.
This isn’t necessarily surprising. Some of these sites attracted just one bid, suggesting that other developers were less willing to take on the risk of building in an area with so many competing launches. Those who did take the risk were able to price their projects according to what buyers were willing to pay, rather than what they had paid for the land.
Same street, very different sales
Beyond land prices, there were also significant differences in how quickly the seven developments sold.
Despite being located within the same neighbourhood and targeting a similar pool of buyers, some projects sold most of their units within their first month, while others took almost three years to sell out.
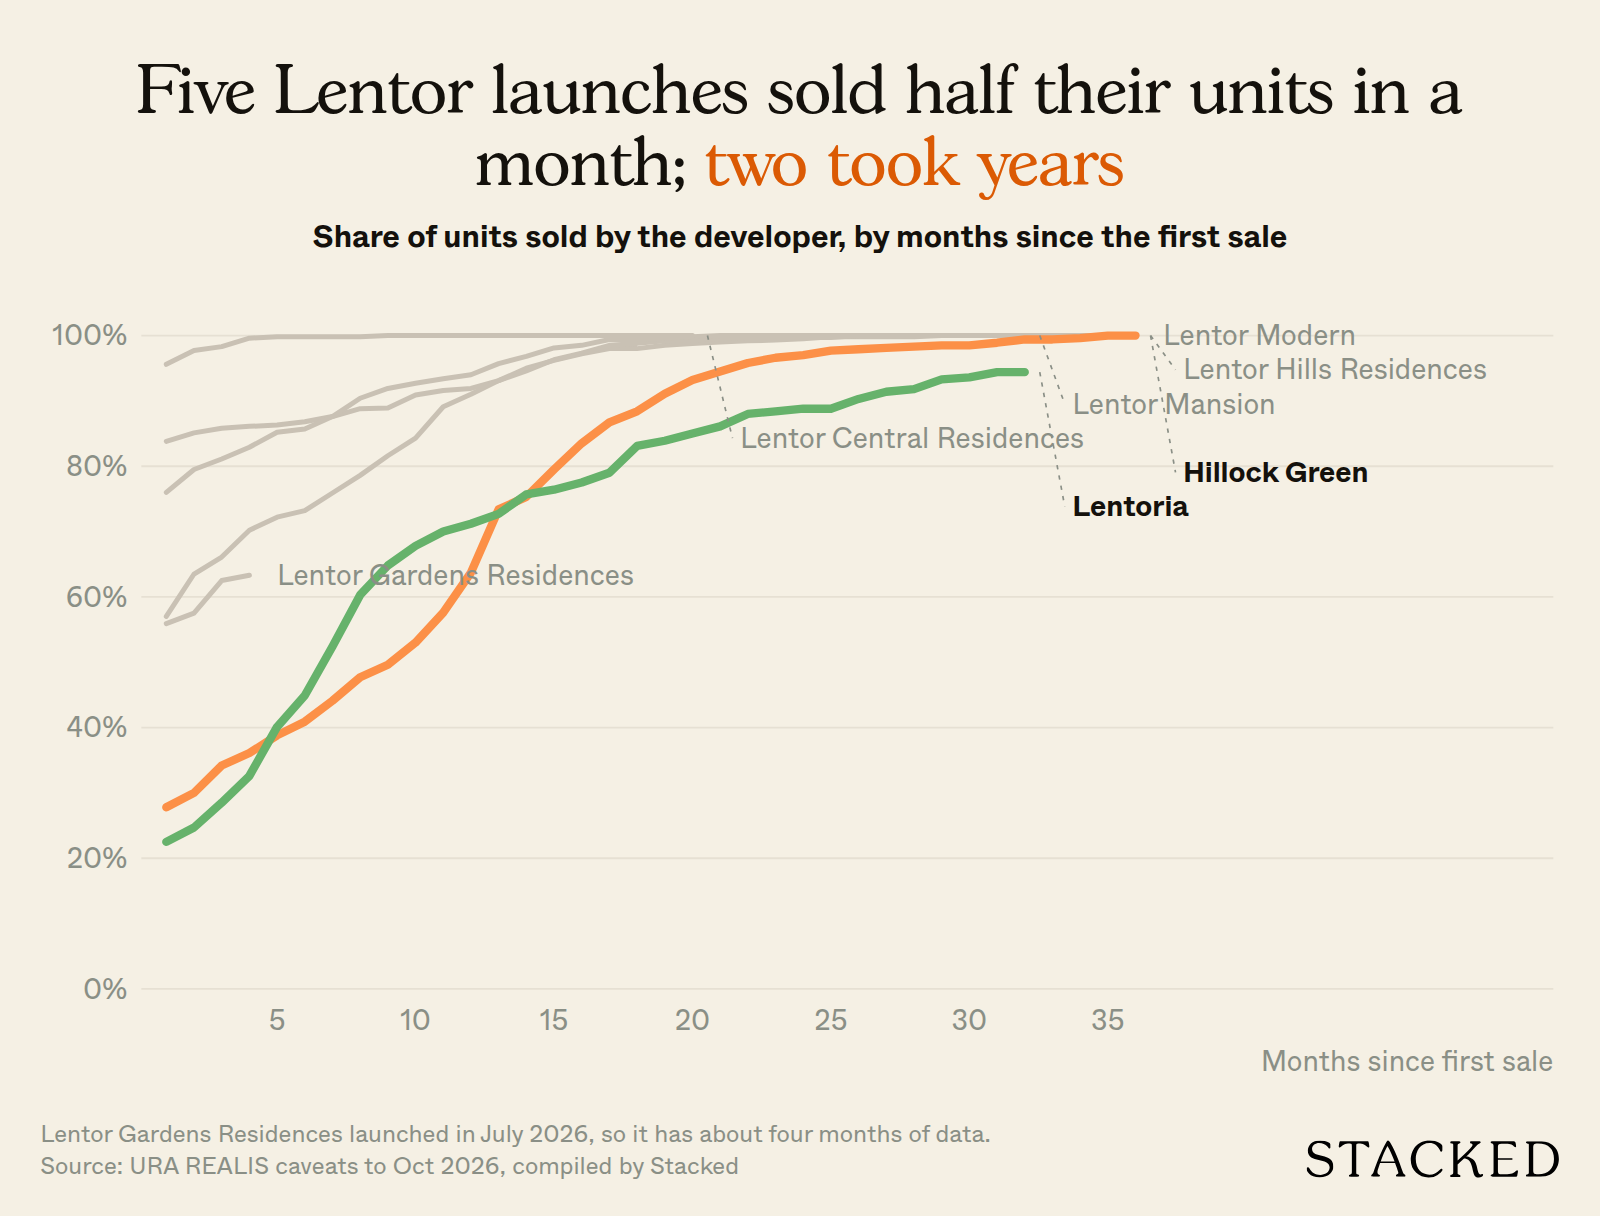
Lentor Modern sold 84% of its 605 units within the first month of its sales launch (we went through the reasons at the time). Lentor Mansion sold 76% of its units in its first sales month too. Lentor Central Residences went one better, with 96% of its 477 units gone within a month of its sales launch in March 2025.
On the other hand, Hillock Green and Lentoria were a different story. Hillock Green sold 28% of its total units in its first month of sales, and its last few unsold units only transacted in September 2026, close to three years after its launch. Likewise, Lentoria sold 23% of its units in its first sales month, but more than two and a half years on there are just 15 units available.
So what happened? We don’t think there’s one big reason, and anyone who tells you otherwise is probably selling something. But a few things stand out:
- Timing. Hillock Green launched in November 2023, four months after Lentor Hills Residences had sold 57% of its 598 units in its first month of sales. A good chunk of the buyers who wanted a Lentor condo that year had already bought one.
- Quantum, not psf. Lentoria and Lentor Mansion launched within two weeks of each other in March 2024. Lentor Mansion was the pricier of the two in terms of $PSF price, but its two-bedders commanded an average price of about $1.36 million against the approximately $1.60 million average selling price at Lentoria. This is largely attributed to the fact that the units were smaller in size (592 sq ft against 724 sq ft).
Buyers who waited for a discount didn’t get one
Here’s where it gets interesting for anyone who held off, hoping the slower sales would result in lower prices.
At a glance, Hillock Green looks like it did. Its developer sales averaged about $2,037 psf in the third quarter of 2026, against about $2,262 psf a year earlier. But that’s mostly a result of the unit mix: the last units to transact were larger sized units for their bedroom type, and larger units carry a lower psf. Compared like for like, by bedroom count, Hillock Green’s prices barely moved.
Lentoria went the other way. Its developer kept raising prices as more units were sold:
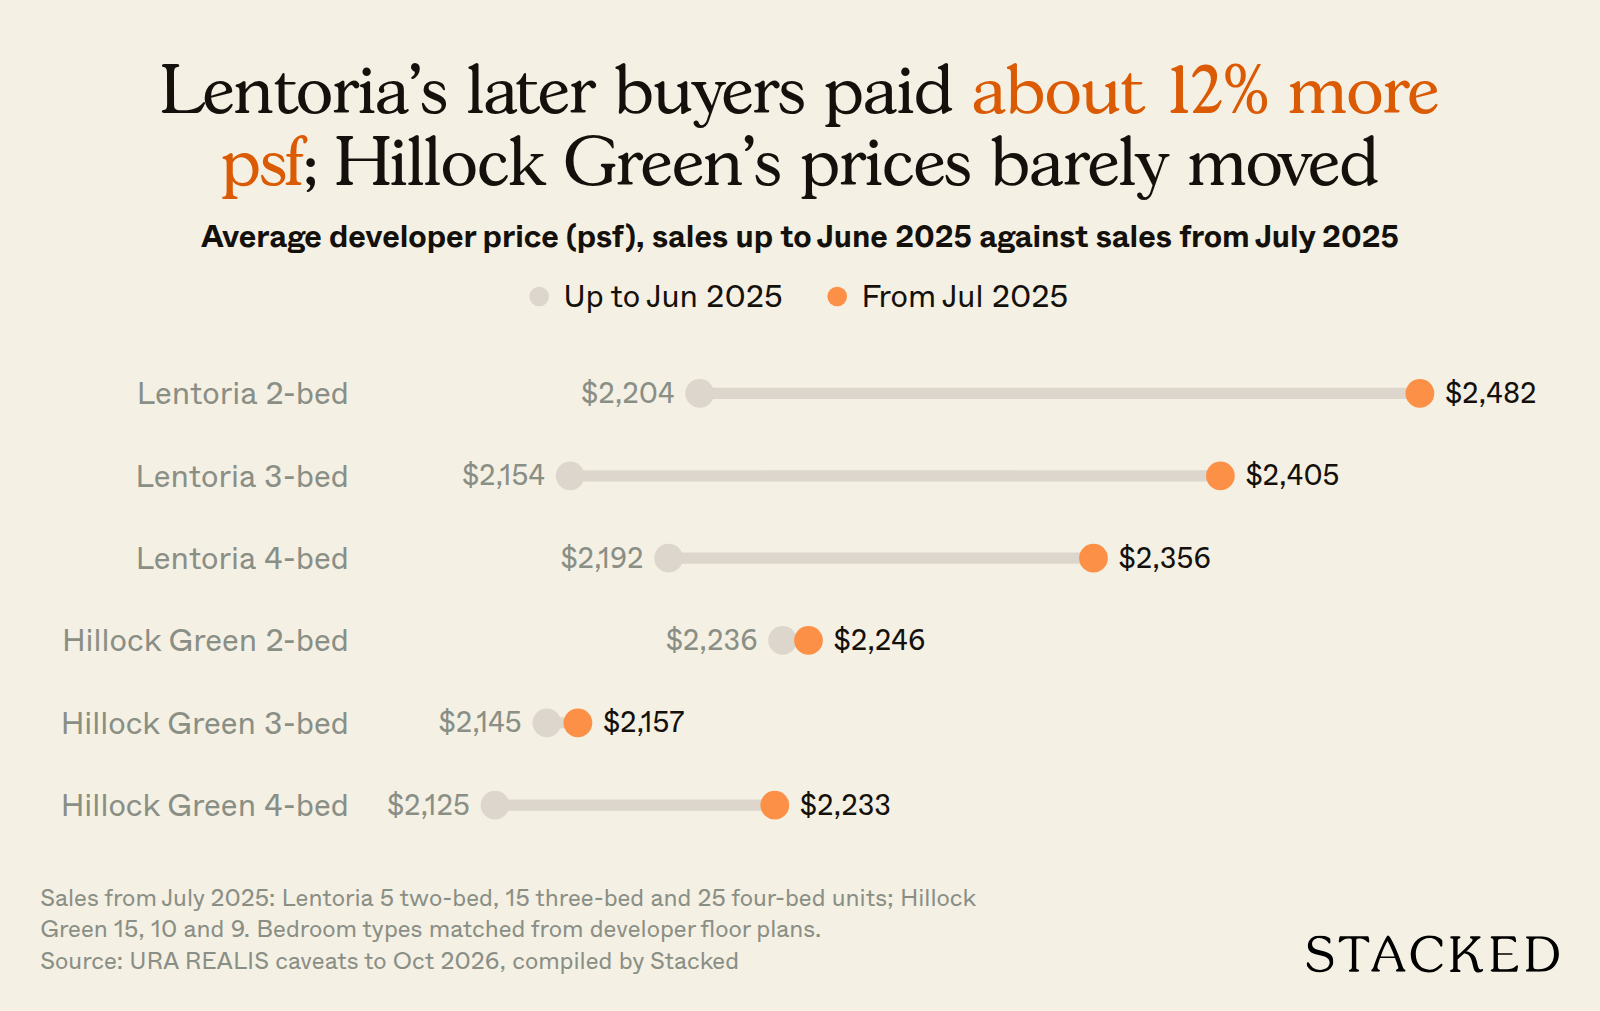
Buyers who picked up a two-bedroom unit at Lentoria from July 2025 onwards paid an average of $2,482 psf, against $2,204 psf for buyers who picked a unit before that: about 13% more, for units of almost identical size (725 sq ft against 723 sq ft). Meanwhile, the transacted price for a typical three-bedder rose by about 12%.
Bear in mind the later sample sizes are small (just five 2-bedders, for instance), so stack and floor level make a bigger difference to the average prices. But the point still stands. In Lentor, the developments with relatively slower sales didn’t discount their selling price. If anything, it was the developer with unsold units that kept raising prices.
The report card: Lentor Modern’s first sub-sales
Lentor Modern received its TOP in August 2025, which makes it the only Lentor project with real resale data so far. And as we noted when Lentor’s first condo was completed, the first movers are doing well.
The average seller made about $314,000, or a gain of 15.3%, over an average holding period of about 3.6 years. Only one seller suffered a loss, and that was by a marginal $1,340 amount, which is roughly the price of a decent sofa.
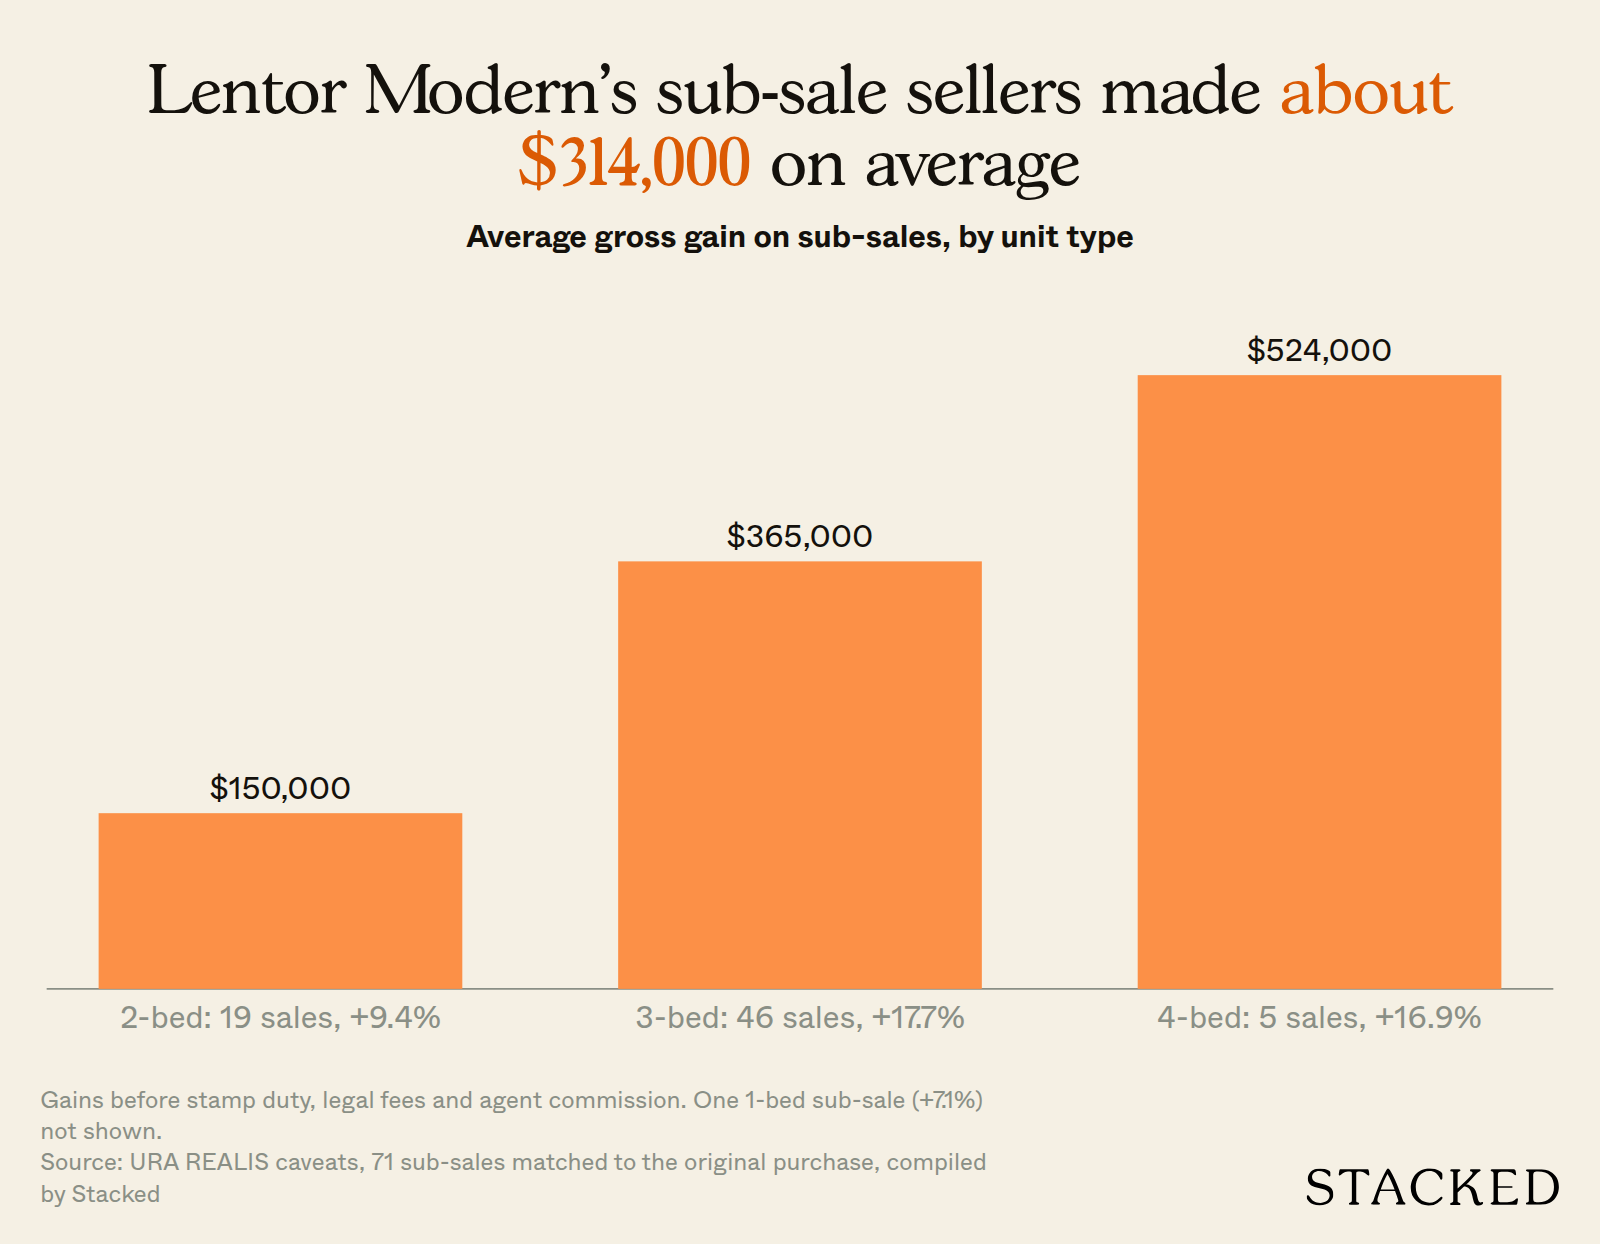
The data also suggests that three-bedders performed best overall in terms of profitability: there were 46 sub-sales, averaging gains of about $365,000 (17.7%). Meanwhile, two-bedders made about $150,000 on average (9.4%). There were only five 4-bedder sub-sales, but they made an average gain of about $524,000 (16.9%).
There are, however, a few caveats to these gains:
- The gains are before transaction costs. The figures do not account for stamp duty, legal fees or agent commissions. For example, the buyer’s stamp duty on a $2.17 million 3-bedder purchased in 2022 would have been approximately $71,000.
- The annualised returns are more modest. An average gain of 15.3% over 3.6 years works out to roughly 4% per year, before transaction costs.
- Lentor Modern has advantages that the other developments don’t. As the only integrated development in the area, it has a mall and direct access to Lentor MRT station. Its early resale performance may therefore not be representative of what buyers at the other six developments can expect.
For owners who kept their units and rented them out, URA rental contracts since completion show about $3,965 a month for a 2-bedder and $5,540 for a 3-bedder. On the original purchase price, that’s a gross yield of about 3 per cent:
| Type | Contracts | Avg monthly rent | Avg developer price | Gross yield |
|---|---|---|---|---|
| 1-bed | 31 | $3,324 | $1,152,000 | 3.5% |
| 2-bed | 91 | $3,965 | $1,565,000 | 3.0% |
| 3-bed | 44 | $5,540 | $2,171,000 | 3.1% |
| 4-bed | 7 | $8,207 | $3,105,000 | 3.2% |
Owners are also asking for more. PropertyGuru listings at Lentor Modern reflect that most listed units are asking for about $2,435 psf on average, against about $2,380 psf actually achieved on its 71 sub-sales.
What’s coming: about 2,350 more homes in 2027 and 2028
Lentor Modern faced relatively little competition when it was completed in 2025. That will change over the next two years, with several other developments in the area expected to receive their TOP in 2027 and 2028.
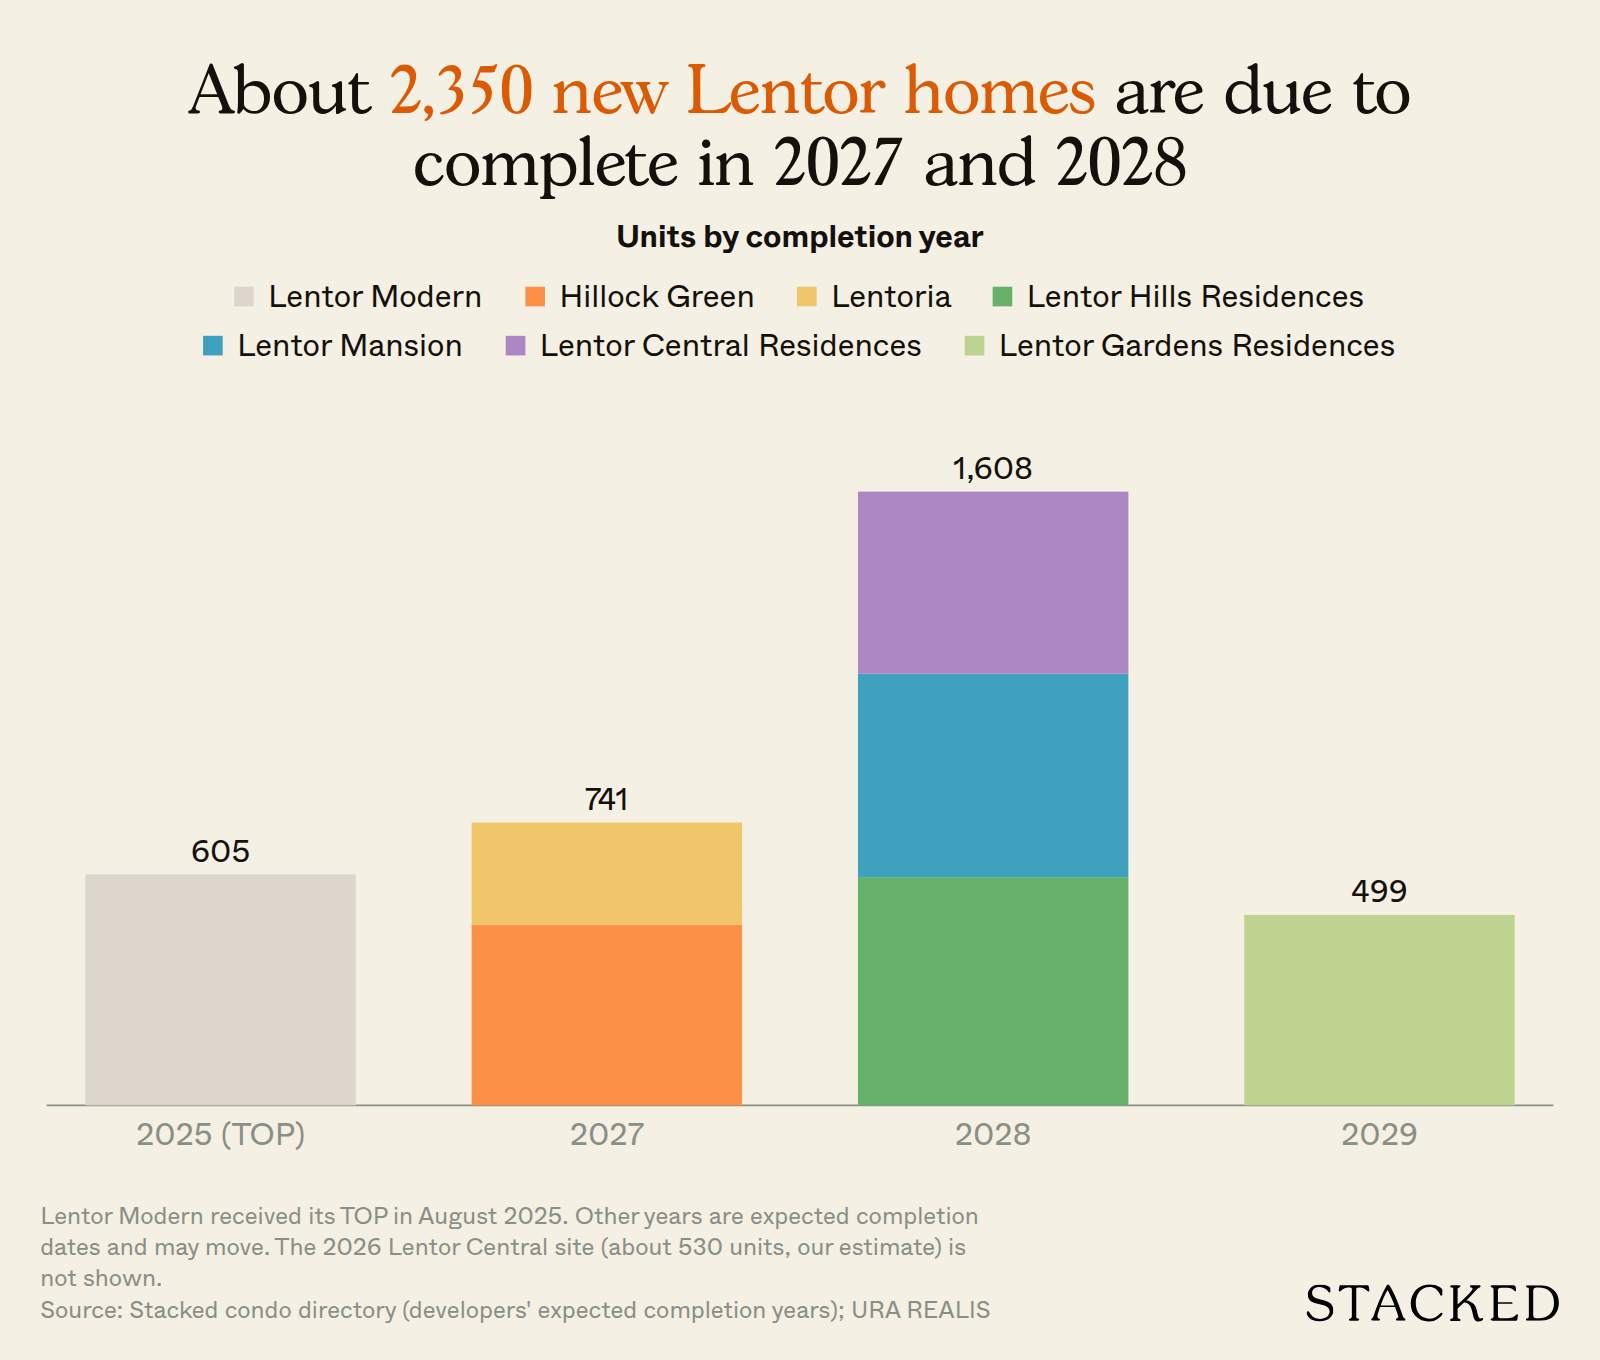
Going by the expected completion dates, Hillock Green and Lentoria (741 units between them) are due to be completed in 2027, and Lentor Hills Residences, Lentor Mansion and Lentor Central Residences (1,608 units) in 2028. Lentor Gardens Residences follows shortly after in 2029, with the new Lentor Central site after that.
That’s about 2,350 homes completing within roughly two years, all around the same MRT station. Not all of them will be rented out or sold, of course; plenty of buyers here are owner-occupiers. But for landlords, that $3,965 2-bedder rent will have a lot more competition. And for sellers, buyers will have more units to compare side by side.
As we pointed out when Lentor Modern completed, the bigger risk may not be supply itself, but how alike the projects look to a buyer comparing unit mixes, layouts and price bands.
There’s also the gap with the older condos around Lentor:
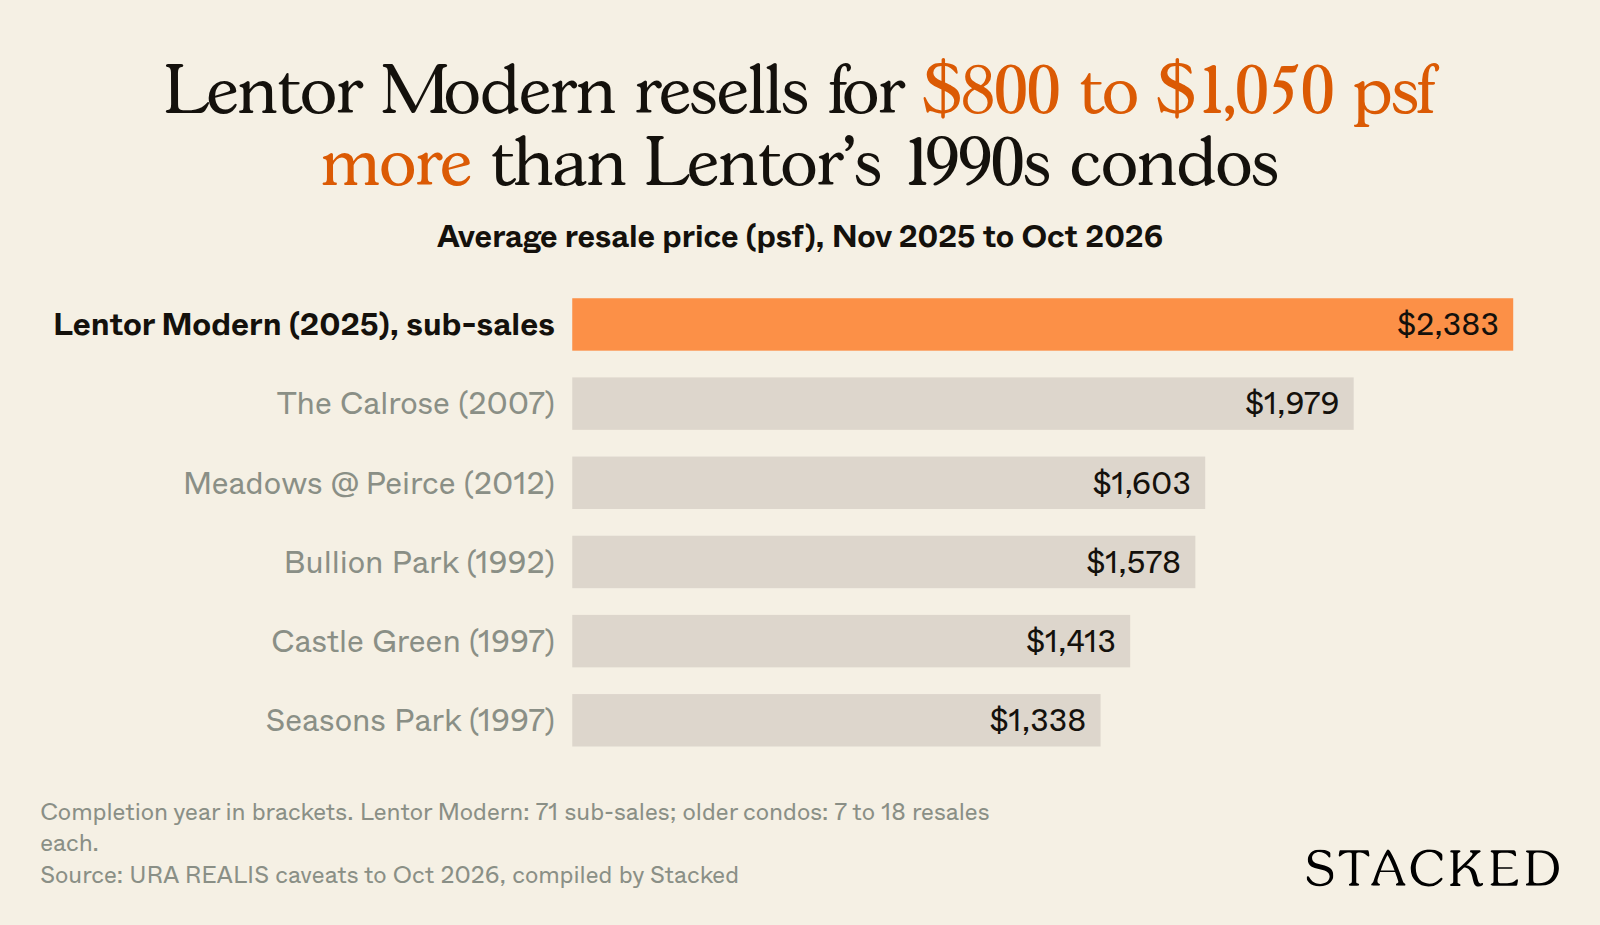
Over the past 12 months, resale transactions at Castle Green and Seasons Park, both completed in 1997, averaged about $1,413 psf and $1,338 psf respectively. This is roughly $1,000 psf lower than the average sub-sale price at Lentor Modern.
The price difference is partly due to the age of these developments, as well as the premium buyers are willing to pay for newer homes. However, with six more new condos entering the resale market over the coming years, buyers will have considerably more options within Lentor itself. It remains to be seen whether the current price premium can be sustained as competition increases.
If you’re buying in Lentor now
Most of the units across Lentor’s seven new condos have now been sold. Based on caveats lodged up to late October 2026, Lentor Gardens Residences had about 183 of its 499 units remaining, while Lentoria had just 15 unsold units. The other five developments had sold out.
For buyers considering a home in Lentor, the table below compares the average prices and unit sizes across all seven developments, based on their developer sales to date.
| Project | Type | Units sold | Avg size (sq ft) | Avg psf | Avg price | Lowest price |
|---|---|---|---|---|---|---|
| Lentor Modern | 1-bed | 63 | 527 | $2,185 | $1,152,000 | $1,072,000 |
| Lentor Modern | 2-bed | 231 | 712 | $2,196 | $1,565,000 | $1,352,000 |
| Lentor Modern | 3-bed | 248 | 1,050 | $2,067 | $2,171,000 | $1,821,000 |
| Lentor Modern | 4-bed | 63 | 1,528 | $2,031 | $3,105,000 | $2,896,000 |
| Lentor Hills Residences | 1-bed | 74 | 531 | $2,213 | $1,175,000 | $945,000 |
| Lentor Hills Residences | 2-bed | 219 | 726 | $2,160 | $1,568,000 | $1,356,000 |
| Lentor Hills Residences | 3-bed | 197 | 1,051 | $2,063 | $2,167,000 | $1,822,000 |
| Lentor Hills Residences | 4-bed | 108 | 1,363 | $2,057 | $2,804,000 | $2,545,000 |
| Hillock Green | 1-bed | 22 | 532 | $2,263 | $1,199,000 | $1,085,000 |
| Hillock Green | 2-bed | 191 | 718 | $2,237 | $1,604,000 | $1,267,000 |
| Hillock Green | 3-bed | 158 | 1,017 | $2,146 | $2,181,000 | $1,797,000 |
| Hillock Green | 4-bed | 103 | 1,293 | $2,134 | $2,755,000 | $2,360,000 |
| Lentoria | 1-bed | 17 | 538 | $2,314 | $1,245,000 | $1,185,000 |
| Lentoria | 2-bed | 115 | 724 | $2,216 | $1,603,000 | $1,438,000 |
| Lentoria | 3-bed | 67 | 997 | $2,210 | $2,200,000 | $1,873,000 |
| Lentoria | 4-bed | 53 | 1,248 | $2,270 | $2,829,000 | $2,540,000 |
| Lentor Mansion | 2-bed | 214 | 592 | $2,302 | $1,362,000 | $1,137,000 |
| Lentor Mansion | 3-bed | 199 | 909 | $2,249 | $2,043,000 | $1,710,000 |
| Lentor Mansion | 4-bed | 75 | 1,227 | $2,234 | $2,741,000 | $2,642,000 |
| Lentor Mansion | 5-bed | 45 | 1,493 | $2,219 | $3,312,000 | $3,170,000 |
| Lentor Central Residences | 1-bed | 55 | 467 | $2,330 | $1,088,000 | $978,000 |
| Lentor Central Residences | 2-bed | 210 | 748 | $2,242 | $1,676,000 | $1,388,000 |
| Lentor Central Residences | 3-bed | 106 | 996 | $2,185 | $2,178,000 | $1,813,000 |
| Lentor Central Residences | 4-bed | 106 | 1,292 | $2,161 | $2,789,000 | $2,368,000 |
| Lentor Gardens Residences | 2-bed | 120 | 699 | $2,388 | $1,670,000 | $1,412,000 |
| Lentor Gardens Residences | 3-bed | 127 | 972 | $2,330 | $2,265,000 | $1,896,000 |
| Lentor Gardens Residences | 4-bed | 69 | 1,214 | $2,367 | $2,876,000 | $2,688,000 |
A few things to note:
- Lentor Mansion has the smallest 2-bedders in the area, at about 592 sq ft. That’s why its 2-bedder price (about $1.36 million on average) is the lowest despite the higher psf. If you need a proper second bedroom for a growing family, check the floor plan before you check the price.
- 3-bedders have averaged between about $2.04 million (Lentor Mansion) and $2.26 million (Lentor Gardens Residences). For reference, that’s the unit type where Lentor Modern’s sub-sale gains have been strongest so far.
- Lentor Mansion is the only one with 5-bedders, at about 1,493 sq ft and $3.31 million on average.
As for the next launch: the record land bid of March 2026 puts our estimated breakeven for that site at about $2,190 psf, higher than for any Lentor project before it. We estimated earlier that it could start from about $2,700 psf. If the past five years are anything to go by, it won’t be priced to be the cheapest in Lentor.
Follow us on Stacked for more news and updates on the Singapore property market.
Data notes: developer sales, sub-sales and rental contracts are from URA REALIS, compiled by Stacked, up to late October 2026 (rentals to August 2026). Land prices are from URA’s Government Land Sales results. Margins and breakevens are Stacked’s own development cost estimates, not developers’ figures. Bedroom types are matched from developer floor plans. Gains are before transaction costs. Asking prices are from PropertyGuru listings.